Topic: end of week and trailing

Hello everybody.

Is there a way to add trailing stop to orders, and at the same time use the exit  logic "end of the week"?

If I use "Week Closing",  Trailing Stop and Trailing Stop Limit are no longer available.

By the way.. If I use Week Closing, is mandatory to use the opening logic "Day of Week"? Of FSB is cabable to detect the exit hour on the last day of the week?

Thanks in advance.

divarak

Re: end of week and trailing

There are many indicators that you can use to exit a trade, does not have to be labeled trailing stop

Have a look in Closing Logic Conditions and see what you can use from there

Do not be afraid to let the generator do its thing and show what may be good to use.

My 'secret' goal is to push EA Studio until I can net 3000 pips per day....

Re: end of week and trailing

Blaiserboy wrote:

There are many indicators that you can use to exit a trade.

Any suggestions Blaiserboy?

I am running tests on a small demo account, 500 USD, 20 pips SL.. But I'm getting tired to test and generates strategies with a System Quality Number > 4.0 and sharpe > 0.4.. All looks great in FSB, even resists the MonteCarlo tool (with variation of 50% on default tests the strategy remains profitable...

But when I put in on MT4, the strategy seems build from bleed the account, not make it bigger.

For how long do you ran an strategy on MT to consider it profitable or not?

Any suggestion?

I know that I sound desperate, but I feel I'm going nowere, and can't get results.

Regards, and thanks in advance.

divarak.

4 (edited by yonkuro 2020-05-22 05:41:11)

Re: end of week and trailing

Hi,

Instead of running the  EA on a demo account and waiting for a few weeks to see the result. You can use partial data to test your approach.

For example you have 100.000 bars of data, use only 80.000 bars to play with your approach, you can optimize and do anything you want with those data

When you get, for example 100 strategies, you can test them on the remaining 20.000 bars, to see if it's profitable or not.

I think it's a faster and more efficient way to filter the strategies.

Cheers.

do or do not there is no try

Re: end of week and trailing

I do not like to rely on the metrics as I build the strategies as the data is from the past. I think we have to test the future data and keep in mind that what is losing today may be a winner tomorrow.

Testing with a walk forward is probably the best way to see what is going to happen, Yonkuro has a great idea of segmenting the data. You can further segment data by managing the dates in the 'Market' tab.

You might also consider working with higher time frames until you get what you seek.

Believe me, you are not the only one to have become frustrated and discouraged in the strategy building. I think that very few achieve success without a lot of disappointments.

My 'secret' goal is to push EA Studio until I can net 3000 pips per day....

Re: end of week and trailing

Blaiserboy wrote:

Believe me, you are not the only one to have become frustrated and discouraged in the strategy building. I think that very few achieve success without a lot of disappointments.

I totally agree with you Dave!

7 (edited by ats118765 2020-05-22 09:39:06)

Re: end of week and trailing

divarak wrote:

I am running tests on a small demo account, 500 USD, 20 pips SL.. But I'm getting tired to test and generates strategies with a System Quality Number > 4.0 and sharpe > 0.4.. All looks great in FSB, even resists the MonteCarlo tool (with variation of 50% on default tests the strategy remains profitable...

But when I put in on MT4, the strategy seems build from bleed the account, not make it bigger.

For how long do you ran an strategy on MT to consider it profitable or not?

Any suggestion?

I know that I sound desperate, but I feel I'm going nowere, and can't get results.

Regards, and thanks in advance.

divarak.

Something to keep in the back of your mind. Data mining tools work on the principle that an 'optimal solution' which is data mined captures an edge from the in sample data (the data in which the solution was mined) which has the ability to persist for an 'unknown' period of time into an uncertain future.

We also know that markets adapt over time and are never purely stationary.

So you might like to consider reversing your approach to segmenting data. The intent is to ensure that your data mining activities are as current as possible to capture more recent market conditions.

Consider using an insample component that extends up to the most recent available data. This ensures that your solution possesses 'recency' at least for a period of time until conditions evolve.

Your out of sample portion of the data plus your insample portion is used to test the overall 'robustness' of your solution during varying market regimes.   

Consider the following example. Data mine with a 15% in sample component right up to the prior day and leave approximately 85% untouched back to the earliest available data.

So in this example I would use a data set that extends from 1985 to current day (35 years) and I would segment this into a 5 year Insample component and a  30 year OOS component.

So the workflow process would use the 5 year 'recency window' to create collections with 'recency embedded in them' which are then filtered using the validation process over the entire sample range to reduce the collection to those that:
1. Are robust over a broad array of historic market conditions; and
2. Are a subset of these robust solutions that have 'recency' embedded in them.

This therefore produces a result like the attached where you have two trajectories with your equity curve:
1. A long term robustness trajectory; and
2. A short term recency trajectory.

It is therefore likely that your future trajectory will lie somewhere between these two extremes. It is highly unlikely to exceed the 'recency trajectory' as this component has been data mined.....but more likely to outperform the long term 'robustness trajectory' as you take advantage of more recent market conditions.

The idea is that you do this workflow process at say 6 monthly intervals to ensure that the 'recency effect' keeps your EA's current.

Note: It is actually easier (provided you first design your EA around which you then data mine) to use the entire 35 year history for in sample data mining to create your robust collection....and then to filter that collection by validating and ranking the top risk adjusted performers for the past 5 years.....but many that insist on splitting into OOS and IS don't like this idea. The key 'robustness measure' in this process is that you are using an extreme data sample that possesses an array of different 'actual' market regimes as opposed to simulated regimes produced through a Monte Carlo approach.

Post's attachments

Equity Curve.PNG 89.77 kb, file has never been downloaded. 

You don't have the permssions to download the attachments of this post.
Diversification and risk-weighted returns is what this game is about

Re: end of week and trailing

Rich.....

Would it be possible for you to illustrate some settings re the  85/15.

I think I am grasping your approach but I am lost as to how you execute the plan.

Would you be able to clarify a bit

Thanks very much

daveM

My 'secret' goal is to push EA Studio until I can net 3000 pips per day....

9 (edited by ats118765 2020-05-22 17:43:55)

Re: end of week and trailing

Blaiserboy wrote:

Rich.....

Would it be possible for you to illustrate some settings re the  85/15.

I think I am grasping your approach but I am lost as to how you execute the plan.

Would you be able to clarify a bit

Thanks very much

daveM

Hi Dave

I do this stuff mostly within MT4....but I was thinking that a way to apply it for EA Studio would be as follows.

If you wanted to do this exercise within EA studio  using the validation tool, you would need to upload your entire data history into EA Studio. I think we can have up to 500,000  bars in EA Studio (not sure).

Undertake your workflow process to data mine using the data horizon for say the last 5 years (up to  say last month) using D1 data for your trend following model. The reason why I suggest a trend following model is that it is very unlikely that other methods will stack up over such large data sets.

Rather than optimise these strategies, simply generate lots of different 'entry' types of trend following models using your presets where possible and use initial stop and trailing stop only for exits. Diversification is what you are looking for.

This will generate a collection per market of say 100 solutions that have been data mined over the 5 year range (no OOS). Save this set and then create another set on another market. Let's say we get a collection of 10 different markets with say 100 solutions each. Assume we use validation criteria that sets the bar fairly high for this short term testing.

Now that you have your sets of 100 x 10 markets..save these collections and name them and then re-import into the validator but then retest the entire set of collections on very long range data also up to last month. Approximately 85% of the data in this phase will be OOS. Set the validation criteria a bit lower but ensure that your criteria demonstrate positive expectancy and good return/drawdown.

Save the successful candidates from the run. You may find you need to redo the entire workflow to this point a few times until you build a sufficient stock pile of collections that have passed both the short range and the long range test period.

Let's say you create a stockpile of say 100 solutions per market that are both:
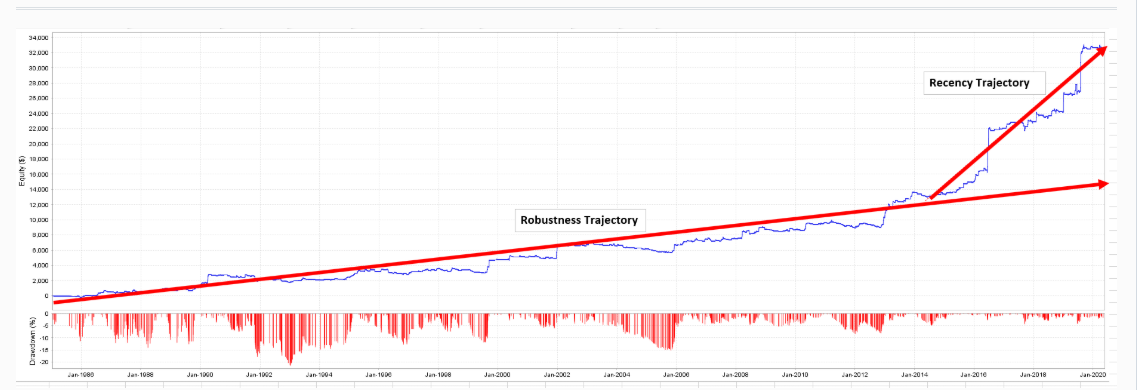
1) Short term solid performers - This ensures that your solutions are 'recent' strong performers; and also
2) Robust candidates long term (that won't fall over as soon as you implement them live). This preserves your capital.

Then re-import back into the validator and use the short term settings again and rank your validated results from top to bottom using your preferred metric. I would probably use return to drawdown again.

You will then need to compile say the top xx of them into a preferred sub portfolio (per market) using portfolio compiler software (say QuantAnalyzer) to get the best bang for buck in terms of correlation.....and then further compile these sub portfolios into multi-market solutions that offer 'the best bang for buck' in terms of correlation.

Put onto a demo (only for a short period to confirm it is free of execution issues) and deploy as soon as you can.

Retain these collections and rerun using the validator next month using a rolling 5 year window) but retain all the history for the robustness phase (this should just keep growing)...but the rolling 5 year window ensures your EA's keep fairly sharp. Continue to add to your base collections as well so that you continuously grow your collections.

This process would only be advised for trend following models where Monte Carlo and Walk forward testing methods are not recommended.

Something like this Dave. I hope it makes sense :-)

Cheers

Rich

Diversification and risk-weighted returns is what this game is about

Re: end of week and trailing

Thanks for taking the time for all of these details

I am seeing now why I should have studied more math back in the day.

Attempting to do automated trading without math skills is almost impossible.

I will start to work on this later in the day.

I really appreciate your efforts

Thanks again.

daveM

My 'secret' goal is to push EA Studio until I can net 3000 pips per day....

11 (edited by hannahis 2020-05-22 17:31:53)

Re: end of week and trailing

Retain these collections and rerun using the validator next month using a rolling 5 year window) but retain all the history for the robustness phase (this should just keep growing)...but the rolling 5 year window ensures your EA's keep fairly sharp. Continue to add to your base collections as well so that you continuously grow your collections.


Excellent post!

I was about to ask you have you ensure the "recency" of your EA and I guess at every 6mth intervals, you use your same EA collection and re-run the lastest 5years data via Validator? (did I get it right?)

Cheers

Hannah

Re: end of week and trailing

Blaiserboy wrote:

Thanks for taking the time for all of these details

I am seeing now why I should have studied more math back in the day.

Attempting to do automated trading without math skills is almost impossible.

I will start to work on this later in the day.

I really appreciate your efforts

Thanks again.

daveM

Cheers Dave. I totally understand mate.

These data mining techniques are stunning 'Programming works of master craftsmen' and you can really quickly lose your way....but in the end I personally feel that you really need to step back and then get under the hood to examine each step of the process to identify if it adds or detracts to the value of the outcome.

Diversification and risk-weighted returns is what this game is about

Re: end of week and trailing

hannahis wrote:

Retain these collections and rerun using the validator next month using a rolling 5 year window) but retain all the history for the robustness phase (this should just keep growing)...but the rolling 5 year window ensures your EA's keep fairly sharp. Continue to add to your base collections as well so that you continuously grow your collections.


Excellent post!

I was about to ask you have you ensure the "recency" of your EA and I guess at every 6mth intervals, you use your same EA collection and re-run the lastest 5years data via Validator? (did I get it right?)

Cheers

Hannah

You got it Hannah...but use whatever re-balance period you like. It might be worth doing the 5 year window on a monthly basis if you feel that is necessary. It keeps you occupied at least . :-)

Diversification and risk-weighted returns is what this game is about

Re: end of week and trailing

ats118765 wrote:

Approximately 85% of the data in this phase will be OOS.

Rich

You mean 85 IS and 15 OOS?

Why don't you look OOS data separately? Why do you add the last 15% data for overall check-up? It is already established that all of those, which get tested in the 2nd phase, are "winners", so it only makes sense to check whether they are winners on the OOS part. Are you trying to say that 15% of data is too short for really assessing the trend-following edge? It is an interesting idea, hope you can explain it a bit more, usually OOS is looked separately.

15 (edited by ats118765 2020-05-23 04:41:56)

Re: end of week and trailing

footon wrote:
ats118765 wrote:

Approximately 85% of the data in this phase will be OOS.

Rich

You mean 85 IS and 15 OOS?

Why don't you look OOS data separately? Why do you add the last 15% data for overall check-up? It is already established that all of those, which get tested in the 2nd phase, are "winners", so it only makes sense to check whether they are winners on the OOS part. Are you trying to say that 15% of data is too short for really assessing the trend-following edge? It is an interesting idea, hope you can explain it a bit more, usually OOS is looked separately.

The entire data range for the example is 1985.01.01 to say 2020.04.30

Phase 1) The data in which the EA is created in the reactor is say 2015.04.01 - 2020.04.30 = The dated range represents the In Sample part of the entire date range. (In sample  = 15% of total data range). This is where the collections are created and honed for recent market conditions. This is also where it is possible to 'curve fit' the result.

Phase 2) The remaining data is used for validation only = 1985.01.01 - 2015.03.31 = OOS (85%). This is where the phase 1) collection is filtered to include only those survivors from Phase 1) that also exhibit robustness.

The result of both phases is a collection of :
1) Recent performers; AND
2) Survivors.

You validate across the entire data sample to generate an equity curve that gives both 'robust phases and 'recency phases' and plot regressions across the components to give 'future performance bounds' within which you oversee performance.

https://atstradingsolutions.com/wp-content/uploads/2020/05/Equity-Curve.png

If future performance falls below the 'robustness projection', you replace the EA.

I find that there is inevitably a drop in performance when you take data mined EAs into the battlefield. This is understandable and to be expected however as future conditions are always slightly different from those market conditions in which the EAs were created. The problem however is that we just don't know whether the EAs are in a natural drawdown or are victims of curve fitting and have no enduring substance. This method plots logical bounds within which you manage the performance of your EAs.

Note: This process is only suggested for trend following models. Other methods require different robusness tools such as Monte Carlo and Walk Forward etc.

You only need a small in sample component to test whether your model is a trender or not. Most of the work is through the design process (eg. entry presets) plus stop and trailing stops. The data mining component (15%) is simply used to detect suitable parameters for the overall design that reflect 'more current market conditions' and are diversified options with a weak edge. The bulk of your test needs to be OOS (eg. 85%) to see how that solution stacks up over 'unfavourable' market conditions. This is to provide a degree of capital protection to your models.

How you then compile your diversified collection that have passed these tests is essential and where you need a compiler to examine correlations between the return streams.

Diversification and risk-weighted returns is what this game is about

16 (edited by ats118765 2020-05-23 04:58:32)

Re: end of week and trailing

In forward testing land for trend following systems....your worst drawdown is always ahead of you. In backtest land, the corollary is that your worst drawdown is always behind you.

The deterioration progressively deteriorates in time away from the period in which the design was created. So if your design was created using recent data...the deterioration occurs in the past away from this recent set of conditions in a backtest.....and in the more distant future with live trading. 

Have a look at the drawdown profile of the chart posted in the prior post. You will see that the Drawdown increases as you go further back in time. This is principally due to the fact that the Ea's were mined with data between 2015 to 2020. A similar deterioration is likely to be expected  going forward in time. It is not because 'they are necessarily broke' but rather a natural consequence of signal deterioration over time with adaptive markets. You therefore need to establish 'bounds of tolerance' in your projections going forward to establish whether the system is 'broke' or simply 'less efficient' than it used to be. Without hindsite it is very difficult determining which is which....so the worst case bound (your long term historic projection - robustness projection) is your benchmark.

What you tend to find is that the efficacy of your trend following model (signal strength) progressively deteriorates when subjected to noise and probably associated with the fact that markets evolve over time. Even trends are affected by the impacts of noise.

So you need a method to keep them sharp and 'contemporary'. The trends of the 1980s and 1990s are different to the trends of today which are much more 'volatile' in nature. So the models you create in the 1980s (eg. the Turtle strategy) needs to adapt to more recent trends to survive and prosper.

The core strategy itself (say the entry and exit of the Turtles strategy) can 'almost' be defined in EA studio using entry presets etc. etc. etc and you can then data mine around this core trend following strategy to generate a diverse array of 'contemporary variables such as the lookback length, volatility range etc.'. The data mining process is used to 'sharpen' the core model to reflect more recent conditions. Unfortunately you need to work within the limitations of the software so there are some features in EA studio that are lacking for the trend followers out there...such as volatility based stops and trails....but there are work around's which can almost achieve the desired result.

Diversification and risk-weighted returns is what this game is about

Re: end of week and trailing

Ah, it is 85/15 this way, yes. Thank you, Rich, for taking time to explain. Your posts offer great value!

Re: end of week and trailing

footon wrote:

Ah, it is 85/15 this way, yes. Thank you, Rich, for taking time to explain. Your posts offer great value!

Cheers footon :-)

Diversification and risk-weighted returns is what this game is about

Re: end of week and trailing

Hello Everybody! Sorry not no show up before. Thank you all for the replies...

Yonkuro, how about use OOS in Generator/Optimizer? Should I get the same results? I also agree with Balaiserboy about the data horizon option.

ats118765, it is really interesting what you post about long term sucess strategies... In my case I am focused on short term strategies, I hope I can put into work your explanation.

Now I am getting another problem...

I used week closing on some strategies... But on the last day of the week, the positions still there, and now the next week started, the positions didn't close either...

I am doing something wrong? The week closing indicator isn't the only one in the exit slots.

Re: end of week and trailing

Probably you didn't have a signal then. If you have weekend close + another conditions, then those conditions are evaluated at weekend close, just like you made it to do. It is important to understand the relation between closing point and closing condition slots.

Re: end of week and trailing

footon wrote:

Probably you didn't have a signal then. If you have weekend close + another conditions, then those conditions are evaluated at weekend close, just like you made it to do. It is important to understand the relation between closing point and closing condition slots.

footon... Do I have a way to force to close operations no matter if they are profitable or not at the end of the week, and also use another indicator to close some positions?

If I put week closing 2, there is no way to close positions using another indicator.

Regards.
divarak

22 (edited by ats118765 2020-05-25 03:54:41)

Re: end of week and trailing

divarak wrote:

ats118765, it is really interesting what you post about long term sucess strategies... In my case I am focused on short term strategies, I hope I can put into work your explanation.

Hey divarak. If you are looking at short term strats you will need a different form of workflow method. The process I outlined was specific to diversified systematic trend following of a medium to long term duration.....

Cheers

Rich

Diversification and risk-weighted returns is what this game is about

Re: end of week and trailing

divarak wrote:
footon wrote:

Probably you didn't have a signal then. If you have weekend close + another conditions, then those conditions are evaluated at weekend close, just like you made it to do. It is important to understand the relation between closing point and closing condition slots.

footon... Do I have a way to force to close operations no matter if they are profitable or not at the end of the week, and also use another indicator to close some positions?

If I put week closing 2, there is no way to close positions using another indicator.

Regards.
divarak

Try this => https://forexsb.com/repository/reposito … -week-exit