1 (edited by rjectweb 2018-05-19 22:26:31)

Topic: Resolve Correlations - unexpected behaviour

Hi,
please take a look at this situation in the following images. The best strategy in the collection sorting it by "Return/Drawdown" is a correlated strategy (pink background). The issue is when I hit the button "Resolve correlations", as the first strategy is a correlated one, it is removed from the collection. But it was the best one! (it has the best Return/Drawdown ratio, and it is better than the strategy that now is in first place). I feel the "resolve correlations" button should have removed the other strategies the first one was correlated with, instead of the best strategy in the collection. Am I missing something here?


https://s31.postimg.cc/a6ntcoxc7/Correlations_1.png


https://s31.postimg.cc/gx4am57nb/Correlations_2.png


Please, also take into account that this situation might be also present when we have the "resolve correlations automatically" checked. If that is the case, a better strategy might automatically be removed in Reactor when another (it could be worse) strategy (correlated with the first) appears in the collection (=passes the acceptance criteria).

Thanks a lot for having a look at this.
Warmest regards
RJ

Re: Resolve Correlations - unexpected behaviour

It looks like the collection sorting is not refreshed in this case. Normally the "best" strategy must be at the top and the correlated ones bellow it. How do you received this view? Is it after changing the sorting criteria?

Re: Resolve Correlations - unexpected behaviour

Hi, thanks for answering.

This specific collection comes from the Validator. Optimization for best "Return/Drawdown". The different images show how they are when I change the sorting criteria. In most cases, the first one is a correlated strategy.

Do you think it would help to show which strategies (the numbers) are correlated with each one?

https://s31.postimg.cc/qc6ud1clz/Correlations_3.png

https://s31.postimg.cc/6hksqx547/Correlations_4.png

https://s31.postimg.cc/ldjbyivyf/Correlations_5.png

https://s31.postimg.cc/l0rxsclef/Correlations_6.png

https://s31.postimg.cc/4prtw0th3/Correlations_7.png


Using the validator I am somehow forcing the situation here, but I feel (not completely sure) that I had this behaviour before when working with the Reactor too. I feel in some situations when clicking the "resolve correlations" a better than others strategy has been removed, I didn't cate much about that, not understanding very well why they were removed and just trusting how the algorithmic works. But now I feel this behaivour happened before (either with Reactor or Validator, not sure). In any case, after changing the sorting criteria, the best strategy shouldn't be a correlated one, I guess.

Thanks a lot for having a look at it.
Best regards-

Re: Resolve Correlations - unexpected behaviour

I'll check for a possible issue.

Thank you for the report!

Re: Resolve Correlations - unexpected behaviour

The problem is fixed! Please reload the app.

The bug appeared when change the Sorting Criteria. It wrongly first detected the correlations and then applied the new sorting order. Obviously it must be the opposite.

Now the app first re-sort the strategies and then applies the Correlation Analysis. It marks for removal the correlated strategies with the worse sorting param.

Re: Resolve Correlations - unexpected behaviour

Great! It's been fixed really fast! Thanks a lot!

Re: Resolve Correlations - unexpected behaviour

RJ,

How did you get your balance lines to be so linear?  What settings did you use in EAS?

I'm still only a 1 month user.

Thanks for your help,

Samuel

8 (edited by rjectweb 2018-06-01 19:44:17)

Re: Resolve Correlations - unexpected behaviour

Hi Freebird!, how are you doing?

Those are the best strategies in a collection. The collection is sorted by certein criteria, in this case: return to drawdown. So those are the best in the collection. But please notice it is not guaranteed at all that those strategies will be profitable. In fact, most of them will fail. My best advice to anyone starting would be not to hurry and test your strategies in a demo account. Learn how to use the tool and most important, learn and find a method to change strategies in your account (demo). When you were able to sistematically grow a demo account, then you will be ready to go live. I'm telling this because I myself am struggling to find a profitable way to change strategies in an account. I'm learning by my own errors and it is a slow process. Knowing when a strategy is ready to be traded and when it is ready to be removed is a lot more difficult than building strategies. EA Studio is a great tool and using it you will build hundreds (thousands) of strategies that will work well at least for some time. But when to trade live, when to remove them, when to add them to a portfolio without not adding too much risk/correlation is the most difficult question. Sometimes you will find that the strategy that has worked incredibly well so far starts getting bad as soon as you trade it live. Learning how to handle that situations is what will guide you to success--- So my advice is take it easy, learn how to use the tools and not to hurry trading your EAs live. Try to (sistematically) build a demo account first smile

OK, back to your question: how to build "linear" strategies. I think you will find your own method, but what I usually do is to use "performance filters" in the collection tab, and this way the collection does not show/remove the strategies that do not pass the filter (when you have more than 100, only the best according to the filters and sorting criteria remain). For example, if you place a filter to have mimimum Return to Drawdown equal to 3 (or 4) you will end up with many strategies very sharp and "linear". Try that. That's what I usually use. However, you must also balance your acceptance criteria not to be very restrictive, and let optimizer in the reactor do its best. I also use montecarlo (usually 100 tests, 80% profitable for the strategies to pass). These are my settings and you can start using them, but nothing will replace your learning and knowledge about the tool. After I have built a nice portfolio of strategies I trade them in a demo account. I usually require from them to have 15 trades before I watch them to decide if they are good or not. Most of the strategies were not good.

Now I'm waiting for the next upgrade of the tool (Walk Forward), and hopefully that will allow us to build more robust strategies and possibly some kind of expiration time, valid period and this way we will have more ideas about when to start trading a strategy and when we should remove it smile

Warmest regards Freebird!
Please keep posting and sharing your results here. I like reading posts and I learn a lot from other's experiences!

Regards from Madrid!
RJ

Re: Resolve Correlations - unexpected behaviour

Gracias RJ!

Yo pensare que dije.

I'm still establishing my workflows with the program so i like to hear how others are using it.

Here's the idea I have for workflow so far:

in the evening, start EAS generating a collection on several markets
in the morning, bundle them into to PE, then load them onto a demo acct
After some amount of time, go live with the profitable ones, starting out with 0.01 lots
prune out bad strategies
increase lot size with winners
repeat above

I'm also interested in utilizing MT Sidekick but I haven't gotten there yet.

I also intend to unpack each indicator and see which ones typically go with other ones.  There has got to be a pattern.

I played around with the Alligator indicator on FSB on some recent EURUSD data and it made money but when I analyzed the biggest wins, the strategy was going long on a downtrend (up to 20 lots), then cashing out when it hit some ridiculous MVA (150, 160).  There's no way I've got the guts to do that.

Anyways, I think there's an edge out there.  I just have to find it.  I listen to podcasts on trading, and if those guys did it, I think I can too.

How long have you been using FSB and EAS?

Still an optimist for now,

Samuel

10 (edited by hannahis 2018-06-04 20:13:34)

Re: Resolve Correlations - unexpected behaviour

rjectweb wrote:

Knowing when a strategy is ready to be traded and when it is ready to be removed is a lot more difficult than building strategies...But when to trade live, when to remove them, when to add them to a portfolio without not adding too much risk/correlation is the most difficult question. Sometimes you will find that the strategy that has worked incredibly well so far starts getting bad as soon as you trade it live. Learning how to handle that situations is what will guide you to success---
Regards from Madrid!
RJ


This is absolutely true if all we build are mediocre EA, then Portfolio Management is a nightmare.

Over the years, I realised what make Portfolio Management difficult is because my EA is "unreliable", not robust enough to handle different market situations and hence I have moment of brilliant success and then next I faced absolute disaster down the road.  My conclusion is...go back to the drawing board.  The EA is your main building block.  It's determine whether a portfolio is successful or not.  You can play around with money management but ultimately it still boils down to how robust the EA is being build, whether it can handle most trading situation.  And since most of the time in between breakouts are ranging period, that occupy most of the trading hours, the ability to handle ranging signals (with many false breakouts is by far an essential skill one must have to develop good robust EA).

So instead of figuring when to (trade) turn on and turn off an EA, we might as well put build these "turning on and off rules" into an EA (easier say than done).

For those who aren't building your EA manually but rely more on software to search, then do search for EA with high PF with high Net Profit.  Some high PF EA hardly trade, so you need to ensure EA also have high Net Profit.  Or Reward/Risk ratio is another alternative, though I still prefer PF.  An EA with good PF show that it has a trading edge. 

So the higher the PF, the less likely I'm going to need to replace/change (the EA in the) Portfolio and more likely for my Portfolio to be stable and reliable. 

Simply put, if I have an EA with PF above 3.0 as compared with another EA with PF 1.5, which would you allocate more money to trade in?

Likewise, a portfolio filled with 20 or 100 EA with PF below 1.5 is going to bring you through lots of roller coaster ride (not for the faint hearted).  So in order to make a good portfolio, pack it with a few high PF EA is far better than packing it with 20s, 30s mediocre EA with PF below 2.

Eg 1 EA (with PF 3.0) x 10 lot size is far better than 10 EA (with PF 1.5) with 1 lot size each.

Re: Resolve Correlations - unexpected behaviour

hannahis wrote:
rjectweb wrote:

Knowing when a strategy is ready to be traded and when it is ready to be removed is a lot more difficult than building strategies...But when to trade live, when to remove them, when to add them to a portfolio without not adding too much risk/correlation is the most difficult question. Sometimes you will find that the strategy that has worked incredibly well so far starts getting bad as soon as you trade it live. Learning how to handle that situations is what will guide you to success---
Regards from Madrid!
RJ


This is absolutely true if all we build are mediocre EA, then Portfolio Management is a nightmare.

Over the years, I realised what make Portfolio Management difficult is because my EA is "unreliable", not robust enough to handle different market situations and hence I have moment of brilliant success and then next I faced absolute disaster down the road.  My conclusion is...go back to the drawing board.  The EA is your main building block.  It's determine whether a portfolio is successful or not.  You can play around with money management but ultimately it still boils down to how robust the EA is being build, whether it can handle most trading situation.  And since most of the time in between breakouts are ranging period, that occupy most of the trading hours, the ability to handle ranging signals (with many false breakouts is by far an essential skill one must have to develop good robust EA).

So instead of figuring when to (trade) turn on and turn off an EA, we might as well put build these "turning on and off rules" into an EA (easier say than done).

For those who aren't building your EA manually but rely more on software to search, then do search for EA with high PF with high Net Profit.  Some high PF EA hardly trade, so you need to ensure EA also have high Net Profit.  Or Reward/Risk ratio is another alternative, though I still prefer PF.  An EA with good PF show that it has a trading edge. 

So the higher the PF, the less likely I'm going to need to replace/change (the EA in the) Portfolio and more likely for my Portfolio to be stable and reliable. 

Simply put, if I have an EA with PF above 3.0 as compared with another EA with PF 1.5, which would you allocate more money to trade in?

Likewise, a portfolio filled with 20 or 100 EA with PF below 1.5 is going to bring you through lots of roller coaster ride (not for the faint hearted).  So in order to make a good portfolio, pack it with a few high PF EA is far better than packing it with 20s, 30s mediocre EA with PF below 2.

Eg 1 EA (with PF 3.0) x 10 lot size is far better than 10 EA (with PF 1.5) with 1 lot size each.


did you ever get a strategy from eastudio with eg 8years data with pf above 2??

12 (edited by hannahis 2018-06-14 21:18:43)

Re: Resolve Correlations - unexpected behaviour

Hi Deadlef,

Sorry for the late reply, I didn't realised you posted me a question.

1. The post I wrote previously, is a generally comment about portfolio "quality" irregardless whether the EA is from EA Studio or FSB Pro or any other software builder.

2. I mostly use FSB Pro to build my EA, only recently did I try out 10 EA from EA Studio just for "fun".

3. Out of these 10 EA, there is 1 EA (from EA Studio) that has PF 2.20  (based on 1mth demo results, NOTE: I forgot to mentioned that these 10 EA, I added an external trailing Stop EA as an alternative exit strategy).  See attached pic as "proof"

https://s33.postimg.cc/y38vqno57/E_studio_results_with_external_trailing.png

It's just 1mth of trading results, so nothing is conclusive and it's premature to say anything.  Just some info.  These are generated using 1 min time chart with only 5mth of the default data.  Also I've an external trailing EA to "improve" the results, etc.

4. To achieve PF 2.0 above (in the long run), I personally don't think you can achieve it with a "general search" from a software (unless the EA hardly trade at all).  Unless the above mentioned EA (from EA Studio continue to do as well as the results posted, it would definitely be a pleasant surprise, a nice one though, so I'm keeping my finger crossed and wait and see the results after a couple more months).

I usually manually build my own EA via FSB Pro and hence PF 2.0 can be done if you have really good trading rules (in another words, you need to combine brain power and computer power).

Here is a 3wks results with some EA PF about 2.0

https://s33.postimg.cc/btuyjmnej/3wks_results.png


Here is another different batches of demo results with 1.5mths demo trade.

https://s33.postimg.cc/i7k1mz7qz/1.5mths_results.png

Though these are very short period of trading results, can't download any longer date cos too much data (nearly 4K EA results) and website can't handle it.

https://s33.postimg.cc/4izg7swt7/too_long.png


I'm just want to say it is possible to build PF 2.0 EA (I'm not here to proof anything but to remove any psychological barrier of what we think is impossible). If you can believe it, you can achieve it.  Cos no one attempts to do things if they don't believe it's achievable in the 1st place.  The reason why I'm still here, building and building EA is because I believe I can keep "out do" myself and get better and better results till I'm completely satisfied and feel confident that my EA can trade and survive in whatever type of market situations.  Because I believe it's achievable, that's why I endured all these years of "disappointments".  Without hope (vision to see what's possible), we give up easily.  And if anyone wants to survive in this EA development process, hope (with a proper vision of what's possible) is very important.

While there will always be skeptic out there that don't believe or think it's impossible, then let it be.  Cos it is they (the skeptic) who aren't going to have such EA cos they don't believe in themselves in the 1st place to achieve it.  So it's really up to each individual user to determine what's your standard, how much efforts and commitment do you really want to master this EA development skills.  No one can stop you and last of all, don't let any skeptics stop you.   

Best wishes
Hannah

Ps: I don't check the post regularly, so if I don't reply, it's because I didn't notice it.

13 (edited by hannahis 2018-06-15 09:55:05)

Re: Resolve Correlations - unexpected behaviour

Lastly, did I use 8yrs data?

It is not true that the longer the data, the better it is.

Selection of which data to use is far more important than the duration of data.

The whole idea about data selection is to train your EA. 

So the question we need to ask is what kind of market you want to train your EA in?

Not how long you want to train your EA.  In fact, if you choose too long data, it will work against you.

Personally I don't believe in using any data that is older than 2009 (thereabout).  Ever since the increasing prevalence of Algo trading, the market behaviour has changed very dramatically.  So if anyone used data that are "ancient" to train the EA, it is actually training the EA to be "dumb".  Market fluctuation is less dynamic in those ancient days and then to use those data is to dull your EA to be less responsive to market changes.

From my own observation, I sometimes have EA that are trained in shorter data doing better than those in longer data.  The reason, it's the "quality" of the data in terms of how tough the market conditions are in these data.

For example, if you train your EA to survive well from Jan till June 2018, your EA is more robust than if you pick from Oct - Dec 2017.  Most EA will be profitable in Nov - Jan 2018 because it's relative an easy period to trade.  So if I used Oct-Dec 2017 data to create my EA, these EA will die (in demo/live trading) during this current Jan-June period because it's not trained to respond to "weird/odd" market situations.

So for me, if I were to optimise my EA via FSB Pro, I usually look through the trading history and pick very difficult trading months to train my EA cos these current 6mths period (Jan - June 2018) is one of the toughest period and it would be good to use compared to using a longer period with relatively easy trading market conditions.

Re: Resolve Correlations - unexpected behaviour

I agree that longer data is not better.  In fact, I'd go much further and say only current data really matters -- since we are trading under current market conditions. 

A strategy is simply an algebraic formula with a few variables and constants.  When you train / optimize a strategy it computes constants to yield the best Net Balance, SQN, Profit Factor or whatever metric you choose to optimize.  Since you are trading *today* and not in 2009, then it doesn't make sense to use old data that is unrelated to current market conditions.

Using old data skews the computation and gives too much importance to irrelevant data.  You do need a minimum number of bars when optimizing -- I'm guessing around 2000 - 4000.  But beyond that you are wasting CPU time that could be used for other purposes -- e.g. generating more strategies.

We don't know what the market conditions will be tomorrow -- however, frequently updating your data source and refreshing (i.e. retraining) your strategies with the latest data gives your strategies the best chance to perform well under current market conditions.

It comes down to probabilities -- what is the probability that tomorrow's market conditions match with 2009 or with last week?  There's no guarantee, but I'd go with last week.  That's why I favor last week's data over 2009 data.

15 (edited by rjectweb 2018-06-15 15:46:24)

Re: Resolve Correlations - unexpected behaviour

Hi there!
Here's my contribution to this topic.

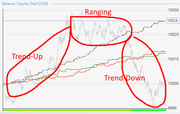
I think, in the end everything is related to market conditions / market regimes.

One could try to partition/segment the market conditions into different kind of market regimes according to some variables or conditions. Imagine how different it is a trending market from a ranging market, a volatile market from a non-volatile market, etc.

One possible partition/classification of the market conditions could be based on trend conditions and volatility conditions. Thant would give us these situations: Strong Trend -  Weak Trend - Range, and each of those states could be Volatile or Non-Volatile: total 6 types of market regimes. This classification is only an example but could help us to understand the idea.

The idea is those market conditions are cyclical, and now the market is in some condition (for example, heavily trending and highly volatile) but in a couple of months from now it will be in a different regime (for example ranging with low volatility).

If we train our EAs to perform well in a specific market regime this EA will likely perform well as long as this market regime lasts. But when the market conditions change the EA most likely will fail. Sorry if this is too obvious for most of you.

So imagine we use a training period of 15.000 bars. Those bars represent a period of several years (about 10) if the bars are H4 bars, but only a couple of months if they are 5mins bars. If we only use the last couple of months of 5min data, our EAs will likely be only fitted to the market conditions we have now. That will be the case for example if during the last couple of months the market has been ranging (and not trending) and as soon as the market starts trending our EAs will likely start failing.

I guess the idea behind using more bars is to try to not only adapt/fit our EAs to current market conditions because nobody knows when the current conditions will change and what conditions will come next. So when people use longer data (more bars) what they are trying is to cover other market regimes when building their EAs and as a result to get more reliable EAs that will survive to market changes (other market conditions). However, an EA trained over many different market conditions could mean hundred of thousands bars in m5, and that means many hours to build 5min EAs.

In the end, in my opinion the question about how much data is enough doesn't have an unique answer. Is 4000 bars enough? Well, what kind of bars are those? are those H4 bars? 4000 H4 bars represent several years of data. In those years there might have been very different market conditions and for that reason, training your EAs over that time might be enough to build EAs capable of perform well over different market situations. On the contrary 4000 M5 bars is hardly a month and training your EAs only during a month might not be enough. Market conditions could be very different next week and for that reason your EA will likely fail and will not survive the new conditions.

So, I guess, overall using longer data may be better if you want to build more reliable EAs, more capable to adapt to other market regimes/changes in market conditions. On the contrary, using shorter data will likely give you EAs only adapted to the specific conditions we have now, and for that reason you'll have to be fast removing them when you notice the EA start failing or the market conditions have changed.

That is why I've written a couple of posts here about trying to identify market conditions beforehand and to trade only the EAs that were built to the specific market conditions we have now. That's not an easy task, but I think that can be done, for example if we use higher TF indicators.

In my view, the recent market situation for EURUSD wasn't so much an "odd period" or "strange behaviour". It was simply a Strong Downtrend - Highly Volatile period. Similar to what happened from april 2014 to the end of that year. It is not the conditions have been hard recently (in my humble opinion). It is more likely our EAs weren't so well trained to those conditions. If I had trained my EAs (only) during that old period (april 2014) I think quite likely my EAs in EURUSD April-May 2018 would have been profitable (because both market conditions were similar).

I get your idea, Hannahis, about this conditions being diffult for trading: well, they were difficult for being Long in such a strong Sell market. But I get the idea of training the EA in this conditions (thanks for the idea). A buying EA in such a "difficult" market regime will likely survive when the conditions were not that "hard". However, on the contrary, a selling EA optimized during this period could find difficult other periods when the selling strength won't be so notorious.

Sorry for such a large post, and please continue contributing to this topic. Please forgive me if most of this post was too obvious for you or please correct me if you think I'm wrong.

Warmest regards,
RJ

16 (edited by hannahis 2018-06-15 16:05:24)

Re: Resolve Correlations - unexpected behaviour

1. I'm not against short or long data.

2. I'm only questioning WHAT kind of data/market conditions during that period of data.

3. The assumption of longer data period is that we assume it contain more different market conditions/regimes (which may not be necessary so).

4.  Shorter data duration, we assume it's more "relevant", but market is ever changing, what degree of relevance depends on what relevance are we referring to, market dynamics/volatility etc?  Furthermore, shorter duration may not give the EA enough "exposure" to be robust to handle volatile markets.

5.  What's the primary purpose of Algo trading? Is to be "hands off" and let the EA does it's job.  So if I still have to decide when to turn off and when to turn on, that means I still have to be watching the market manually, what's the point of Algo trading then, IMO.  Unless you are have found a "pattern" of consecutive wins etc like Steve, who then created Side Kick to handle this decision.  As for me, I still prefer to build these rules into my EA instead of relying on some "arbitrary" statistic (cos I haven't found one that really suit my EA's profile), I rely on indicators' statistic (an area of my forte).

6.  If we know or can predict when/what is the next upcoming market cycle (man, that's a million dollar question), then we might as well put these logic into our EA opening/closing conditions.  Whatever market interpretation we can make, it means we can to certain extent put it into the rules, so that we don't have to manually turn on set of EA off and then turn another set of EA on. 

7.  The idea of classifying different market regime into different data set is interesting.  However the idea of a robust EA is that it can survive in different market regime.  When I want to build a Trending EA, do I then use Trending data regime?  Definitely "NO!!!"  In fact the opposite is true, if I want to "train my Trending/Breakout EA", I will choose a ranging data regime.  Why? if I use Trending data to build Trending Ea, of cos I'll get fantastic results.  What I need to do is to use ranging data to ensure the Trending EA will not be "tricked" by too many false signals during ranging times. The common reason why Tending EA isn't as profitable as it should be, is that it loses so much money in between the Trending, during ranging times.

8. In my personal preference, I would like a "reasonable" length of data.  But I won't just choose the duration just for the sake of duration, I will choose a duration that contain very "difficult" trading periods.  In fact last year 2017 Jan till now has been a rather challenging times (for certain types of EA/strategies).  So the current 2yrs data would be a good data set to use.

9.  Lastly, I observed that shorter time frame EA (M15, M30, H1 rules) are more "robust" than longer time frame rules because they are more reactive and hence always "stay relevant" to the market conditions.  The challenge is to strike a nice balance and find a good stable signal within these time frame (bear in mind that I'm also referring using only MT4 1min time chart as my EA platform).

17 (edited by rjectweb 2018-06-15 17:10:09)

Re: Resolve Correlations - unexpected behaviour

Hi hannahis, thanks a lot for your post. I learn a lot from this kind of posts. And I'm here to learn as much as I can. smile

hannahis wrote:

1. I'm not against short or long data.

2. I'm only questioning WHAT kind of data/market conditions during that period of data.

3. The assumption of longer data period is that we assume it contain more different market conditions/regimes (which may not be necessary so).

4.  Shorter data duration, we assume it's more "relevant", but market is ever changing, what degree of relevance depends on what relevance are we referring to, market dynamics/volatility etc?  Furthermore, shorter duration may not give the EA enough "exposure" to be robust to handle volatile markets.

Completely agree with you here.

hannahis wrote:

5.  What's the primary purpose of Algo trading? Is to be "hands off" and let the EA does it's job.  So if I still have to decide when to turn off and when to turn on, that means I still have to be watching the market manually, what's the point of Algo trading then, IMO.  Unless you are have found a "pattern" of consecutive wins etc like Steve, who then created Side Kick to handle this decision.  As for me, I still prefer to build these rules into my EA instead of relying on some "arbitrary" statistic (cos I haven't found one that really suit my EA's profile), I rely on indicators' statistic (an area of my forte).

But, in the end, all we must decide when to start or stop trading an EA live. The question is not if we must manually start and stop EAs, but when and how often we do this. Am I right? I'm not sure about your point here. In my post I'm not talking about building EAs for specific market conditions and manually deciding when to start or stop them. I'm talking about training our EAs across enough data to cover different market regimes. And then, if the EA is able to detect that right now it is not a good market regime for this EA, the EA should not trade. Not manually starting and stopping it.

hannahis wrote:

6.  If we know or can predict when/what is the next upcoming market cycle (man, that's a million dollar question), then we might as well put these logic into our EA opening/closing conditions.  Whatever market interpretation we can make, it means we can to certain extent put it into the rules, so that we don't have to manually turn on set of EA off and then turn another set of EA on.

Agree with you at all.
Yes, being able to predict next upcoming market conditions would be great smile. I'm not talking about this, though.
I'm talking about being able to classify our current market situation. Yes, detecting the current market situation will imply some rules, tipically in indicators based on higher timeframes. For example a MACD or RSI in daily timeframe and an ATR in daily/H4, for example, when building an H1 EA. And yes, that would be my idea in the end: using EAs that will start/stop when the market conditions are/aren't the best for them. That market detection rules might be added as a part of the construction proccess or even later as additional filters to remove the worst trading periods.

hannahis wrote:

7.  The idea of classifying different market regime into different data set is interesting.  However the idea of a robust EA is that it can survive in different market regime.  When I want to build a Trending EA, do I then use Trending data regime?  Definitely "NO!!!"  In fact the opposite is true, if I want to "train my Trending/Breakout EA", I will choose a ranging data regime.  Why? if I use Trending data to build Trending Ea, of cos I'll get fantastic results.  What I need to do is to use ranging data to ensure the Trending EA will not be "tricked" by too many false signals during ranging times. The common reason why Tending EA isn't as profitable as it should be, is that it loses so much money in between the Trending, during ranging times.

Good point here. I understand your idea about robust EAs. And I understand your idea about difficult periods of training certain kind of EAs. That's a good idea, thanks for posting it. But please understand I'm not talking about training EAs in specific datasets and manually deciding when to start or stop using the EAs. I'm talking about if I train an EA to be robust enough and survive very different market conditions (trained accross a dataset that have different market behaivours), if I additionally were abe to detect that the current conditions are not the best for my EA (using for example indicators in higher timeframes), it would be great if this EA wouldn't trade (right now). It is still in my MT4, but it won't trade. For example, you build an EA that it is a trending EA, but now we are in a range period. We can know that because the angle of the MA in daily TF is flat and there is no volatility (small daily ATR). So wouldn't it be better if this EA wouldn't trade?
I think I've posted here before: what sense does it make to go long against such a strong sell market in EURUSD? My EAs were trained across a period of time that covered (not only that period) April 2014 when there was a big sell off too. They are robust enough to survive this recent period of time, but they achieved losses during this period. They are slowly recovering now. It would have been better if they had an additional filter (it could have been an RSI daily not under 20 = STRONG DOWNTREND) not to trade during this period...

hannahis wrote:

8. In my personal preference, I would like a "reasonable" length of data.  But I won't just choose the duration just for the sake of duration, I will choose a duration that contain very "difficult" trading periods.  In fact last year 2017 Jan till now has been a rather challenging times (for certain types of EA/strategies).  So the current 2yrs data would be a good data set to use.

OK here. Agree again. As I said in my previous post the conditions recently were difficult for being Long in such a strong Sell market. I get the idea of training the EA in this conditions: a buying EA in such a "difficult" market regime will likely survive when the conditions were not that "hard". However, on the contrary, a selling EA optimized during this period could find difficult other periods when the selling strength won't be so notorious.

Thanks a lot for your post. I keep learning a lot from this kind of posts.
Warmest regards
RJ

18 (edited by sleytus 2018-06-15 18:53:24)

Re: Resolve Correlations - unexpected behaviour

My thinking now is the term "market conditions" is too general.  Forex data is a bunch of numbers that sometimes form patterns.  There are a gazillion possible patterns.  There is no way a simple algebraic formula with a few variables and constants -- i.e. a strategy -- can recognize all those patterns.  At best you can hope it can recognize a small subset.  When using the most recent data to compute the constants for your algebraic equation you have a higher probability of capturing some of the patterns your strategy is likely to encounter in the near future.

About a month ago I changed my approach and each weekend have begun refreshing strategies with the latest 4000 bars.  Also, I no longer spend much time generating strategies.  Instead, I'll spend time refreshing my current collection of strategies with the latest data.  As an aside -- it makes a difference whether you use data from a demo or real account -- they are not necessarily the same.

Re: Resolve Correlations - unexpected behaviour

Hi sleytus, thanks for your post.
I'm here to learn as much as I can. Can you please share a little more about the way you are doing things now? What kind of strategies are you building? 4000 bars in what timeframe? what do you mean by refreshing your strategies?
It sounds really interesting and new, could you share a little more?
Thanks a lot in advance!

Re: Resolve Correlations - unexpected behaviour

Hi rejectweb...

Timeframe -- I've tried them all, but have settled on H1 and H4 (mostly H1)

Currencies -- Again -- tried them all.  At one time I was trading 9.  But in the end I always come back to EURUSD.  I'm not sure why -- but perhaps the larger volumes work in our favor because it makes it easier to trade.

# Bars -- when trading EURUSD/H1 then 4000 bars works out to about the most recent 8 months

Strategies -- I've gone back and forth between FSB Pro and EA Studio -- each have their advantages.  Currently I'm back with FSB Pro because it makes it easier to tweak and refresh existing strategies.  EA Studio makes it easier to create a large number of strategies and package them in a portfolio EA.

Refreshing -- this means to (a) update your data source with the most recent data from your broker's *real* account; (b) re-optimize / re-train your strategies with this new data; (c) export the new *.mq4 files; (d) check the results using MT4 Strategy Tester, followed by MT4 Tracker to see the stats of the individual strategies.

It's been mentioned in the forum elsewhere but is worth repeating.  The *.mq4 files that are generated by EA Studio and FSB Pro are not the same code used by those applications when computing statistics.  We assume the *.mq4 files that are later generated will execute exactly as the code internal to EA Studio and FSB Pro.  And in the vast majority of cases it does.  When you use MT4 Strategy Tester to check a strategy it's not because you doubt the results from EA Studio or FSB Pro but, rather, to confirm the *.mq4 code that was programmatically generated by those apps works in MT4.

21 (edited by hannahis 2018-06-16 08:34:01)

Re: Resolve Correlations - unexpected behaviour

Hi Steve,

Thanks for your sharing.  Very interested to know more about your method too.

When you refreshed your EA with new data...

1.  Do you trade all of these EA right away in live account (even after you check with the MT4 tester?).  Is there any more additional criteria or method you use to know which strategy you will selected from these "refeshed" EA to be put into live trading account?

The problem I encounter is, even after I've optimised or fine tuned my EA, not all of them will be profitable and hence I need to run them in demo over a period of time so as to know which really "worked/profitable".  That's why I'm curious how you then select (after refreshing), do all of them "pass" and straight away go to live trading account?


2. How often do you do refreshing.  Once a month? what's your interval schedule?


3. What kind of strategies do you use that works well with such "refreshing techniques"? Trending, Reversal? etc?

Re: Resolve Correlations - unexpected behaviour

Hello Hannah...

1. It depends.  I have a few Real *micro* accounts that I sort of treat as Demo accounts -- this was something suggested by Blaiserboy many months ago and was one of the best pieces of advice I've learned from him.  I don't have specific criteria -- it's a combination of subjective and objective.  And sometimes I'm just really curious how some new strategies will trade and don't want to wait weeks or months testing in Demo accounts.  The problem with Demo accounts is there is a disconnect with Real accounts.  Lately, as I've spent more time "refreshing" strategies with the most current broker data (rather than generating strategies), then I feel more confident going straight to a Real *micro* account.

2. I haven't been following a "refreshing regiment" very long so my frequency of refreshing is arbitrary.  I primarily trade H1 and I've found I can refresh most all my strategies with the latest 4000 bars (8 months of data) within 2-3 hours.  At this point in time I'm motivated, so I've been doing it once a week (on weekends) when the market is closed.

3. I no longer think in terms of trending or ranging strategies.  You can take a "ranging market" and if you look more closely you'll see regions where the data trends.  And you can take a "trending market" and if you look more closely you'll see that there are times when the data ranges.  The data is just a stream of numbers with peaks and valleys and patterns -- I really don't attach additional attributes or biases.  That doesn't mean I'm right -- it's just the way I've been trained to look at data.

Related to (3) -- I continue to work on Sidekick, and I think it gets to the root of your questions -- how do you know which strategies to trade and when?  You've acknowledged that different strategies trade better or worse at different times -- and, of course, I agree.  I'm just not sure you can categorize them according to specific market conditions (which also requires that you can accurately deduce the current market condition).  So, rather than try to figure out what the current market condition is and which strategies historically traded best under those market conditions, I'd prefer to divide strategies into two categories -- (a) currently performs well, (b) currently performs crappy (excuse my French).  And I think Sidekick provides a way to do that.

23 (edited by hannahis 2018-06-16 12:25:06)

Re: Resolve Correlations - unexpected behaviour

Greetings Steve, hope all is well with you. 

Thanks for your detailed explanation.  I understand your workflow better now.

Glad to hear you found some workflow that you can rely on. 

As for me, because I use Excel files to tabulate my EA into weekly performance, I can see from each week which EA does well in what kind of market conditions.  Hence, I know which are ranging EA and which are Trending EA.  Thereby, I can select my portfolio better with a mixture of both ranging EA and trending EA.  I noticed their performance are vise versa, in another words, those that did well in ranging weeks tend not to do as well in Trending.

In addition, being able to identity which are ranging/trending EA, I'm able to zoom into these individual EA and decide what additional filters to add to improve their results.  This is extremely useful for me cos with each improved version, their performance increased, hence each new batches of EA, I get better and better results.  Thus this is how I build my EA rules by rules (by adding another layer of rules onto those good ones to improve them further and further...I realised this method would then increase the PF value and stablised my Portfolio.

I understand we both have different ways of approaching EA development and hence I share mine here so that users can learn from us these 2 different methods and decide which methods suits their preference best.

Have a great weekend ahead.

24 (edited by sleytus 2018-06-16 21:52:22)

Re: Resolve Correlations - unexpected behaviour

https://s8.postimg.cc/iuz4t1nxd/trending-ranging.png

I've attached an image that shows the price curve for EURUSD/H1 for the past 8 months, along with an equity curve from a strategy.

Points of interest:
1. The price curve includes regions of trending-up, ranging and trending-down
2. The strategy's equity curve is roughly linear throughout the "market conditions" of trending-up, ranging, trending-down

Interpretations:
1. Does this mean the strategy trades well under all market conditions?  Some people would say "yes".  I would "no".  The reason this strategy looks linear is because this particular data horizon includes a subset of patterns that this strategy does a good job recognizing.
2. If you look more closely you can see that the trending-up, ranging and trending-down regions also include regions of the other types of "market conditions".
3. Trending / ranging are terms used to describe macroscopic views of the data from 10,000 miles up in the sky.  Our strategies use indicators that can see only individual bars and react to ticks, moving averages, price changes, etc. -- they are clueless about these larger formations.  There are metrics like supply/resistance, supply/demand, volume profile that take into account the bigger picture -- but these are primarily used by manual traders (I believe).

What I'm suggesting is you could give me a strategy you claim works in ranging data and I will be able to find a chunk of trending data that also works well, and vice-versa.  Similarly, you could give me a strategy you claim works in ranging data and I will be able to find a chunk of ranging data where it performs poorly.  And that's because our strategies (i.e. simple algebraic formulas) can only recognize patterns that include a handful of bars.  And those simple patterns occur under all market conditions -- as the attached image shows.   At the risk of ruffling some feathers I'll even go a step further and say the attached image proves that market conditions do *not* play a role.  That's just my opinion and I've been wrong before (about 50% of the time), but that's my take on things right now.

25 (edited by sleytus 2018-06-16 22:20:08)

Re: Resolve Correlations - unexpected behaviour

hannahis wrote:

To achieve PF 2.0 above (in the long run), I personally don't think you can achieve it with a "general search" from a software (unless the EA hardly trade at all).

This was particularly interesting to me since I have also come to a similar conclusion.

I have created many strategies with PF much larger than 2, but when I add them to an account they don't perform anywhere close to that level.  So, I've come to accept they are probably over-fitted.

So now, when I generate / optimize a strategy with a PF much larger than 2 rather than get excited I get suspicious.  I wonder whether it would be worth asking Popov to add another Acceptance Criterium -- e.g. Maximum Profit Factor: 2.5.  In other words, ignore strategies whose PF is too high since that may indicate they are over-fitted.

This is also consistent with observations in other threads and posts that strategies with higher stats often perform worse.  So, maybe PF can be used to filter-out over-fitted strategies.  I don't know -- just a thought.