Table of Contents
Account Panel
Account Statistics
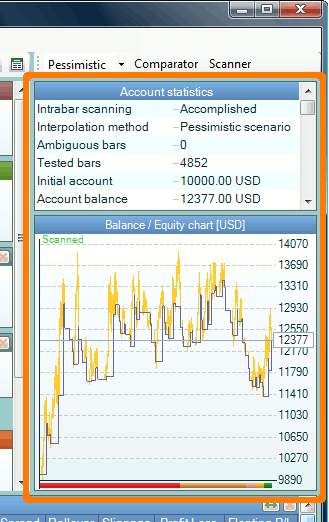
Historical backtest statistics are displayed here:
      Intrabar scanning        Not accomplished
      Interpolation method     Pessimistic scenario
      Ambiguous bars           0
      Tested bars              4858
      Initial account          10000.00 USD
      Account balance          12377.00 USD
      Minimum account          10000.00 USD
      Maximum account          13435.00 USD
      Maximum drawdown         2060.00 USD
      Gross profit             13635.00 USD
      Gross loss               11258.00 USD
      Sent orders              3567
      Executed orders          133
      Dealt lots               181
      Winning trades           32
      Losing trades            58
      Win/loss ratio           0.55
      Time in position         71 %
      Charged spread           364.00 USD
      Charged rollover         4827.00 USD
      Charged slippage         0.00 USD
      Total charges            5191.00 USD
      Balance without charges  17568.00 USD
      Account exchange rate    1.0000
Balance / Equity Chart
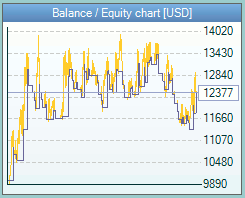
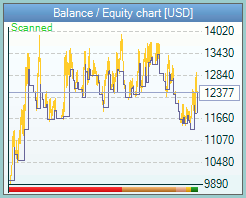
The Balance / Equity Chart shows the balance line and the current result line for the whole period of the back test.
The chart is different depending on whether intrabar scanning has been used or not. The first chart is without scanning and the second chart is with accomplished scanning.
The colour bar at the bottom of the chart shows the percentage of coverage of the intermediate periods. If the Automatic scan function is active but no intrabar data has been loaded, the chart will display a red sign saying Load intrabar data. For more details read the Intrabar Scanner page.
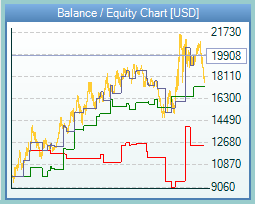
The chart can also show balance lines for long and for short trades when the option Testing → Additional Statistics is on.
- The green line shows the balance from the long trades;
- The red line shows the balance from the short trades.
When you move the mouse cursor over the chart, dynamic information is generated in the status bar of the program.
If you click on the chart a more detailed Chart will be shown.


