Re: Daily Analysis By FXGlory
USD/CAD Technical Analysis for 08.05.2024
Time Zone: GMT +3
Time Frame: 4 Hours (H4)
Fundamental Analysis:
Recent economic news releases from Canada and the United States are set to significantly influence the USD/CAD exchange rate. Here's a brief on the upcoming economic indicators:
Canadian Employment Change: Expected to show a rise of 20.9K, a significant recovery from the previous -2.2K, suggesting an improving labor market in Canada.
Canadian Unemployment Rate: Forecast to slightly increase to 6.2% from 6.1%, indicating minor fluctuations in the job market.
U.S. Unemployment Claims: Projected at 212K, up from 208K, which could reflect slight volatility in the U.S. job sector.
U.S. Prelim UoM Consumer Sentiment: Expected to decrease to 76.3 from 77.2, possibly hinting at a dip in consumer confidence.
Price Action:
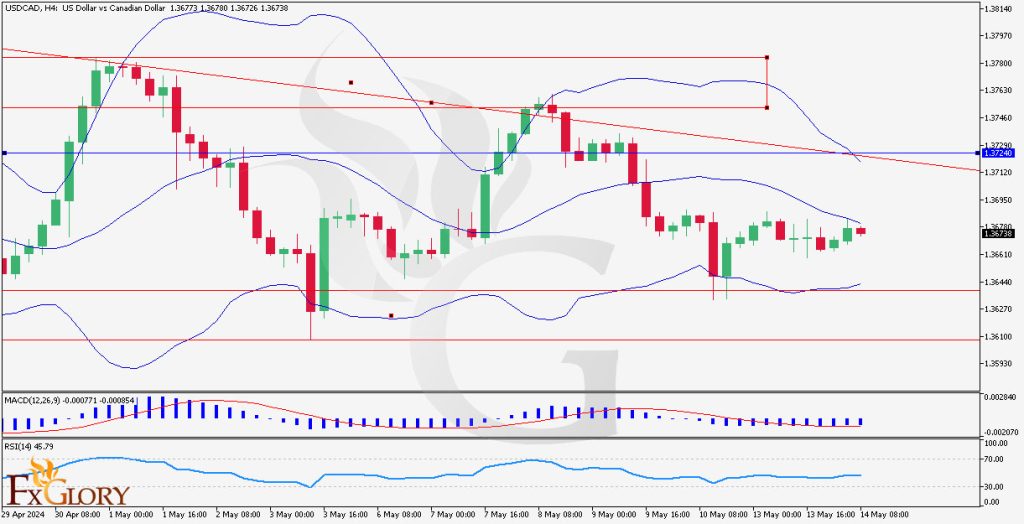
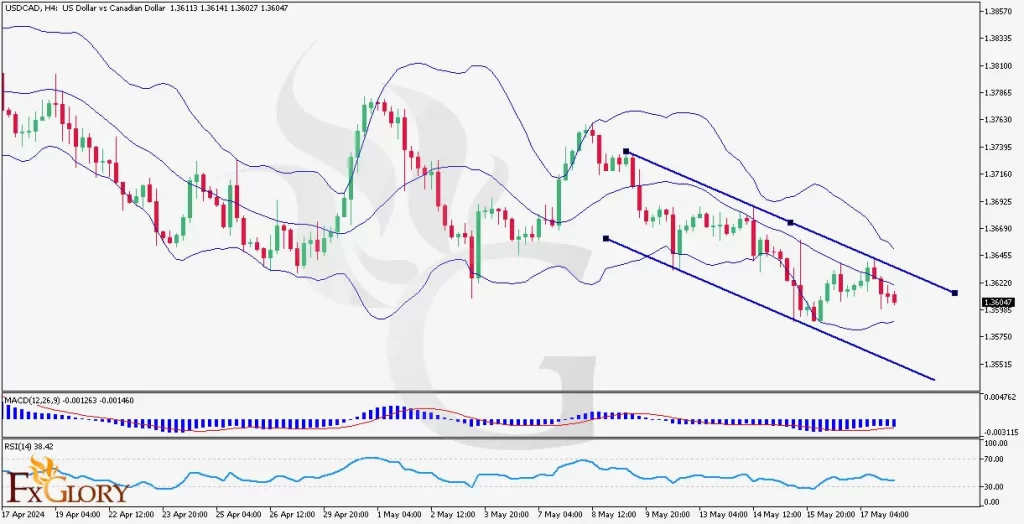
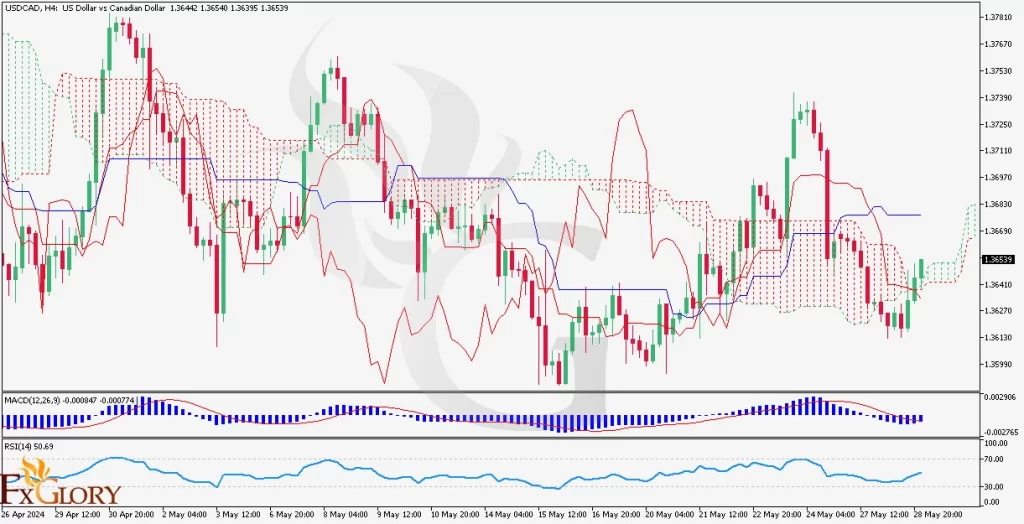
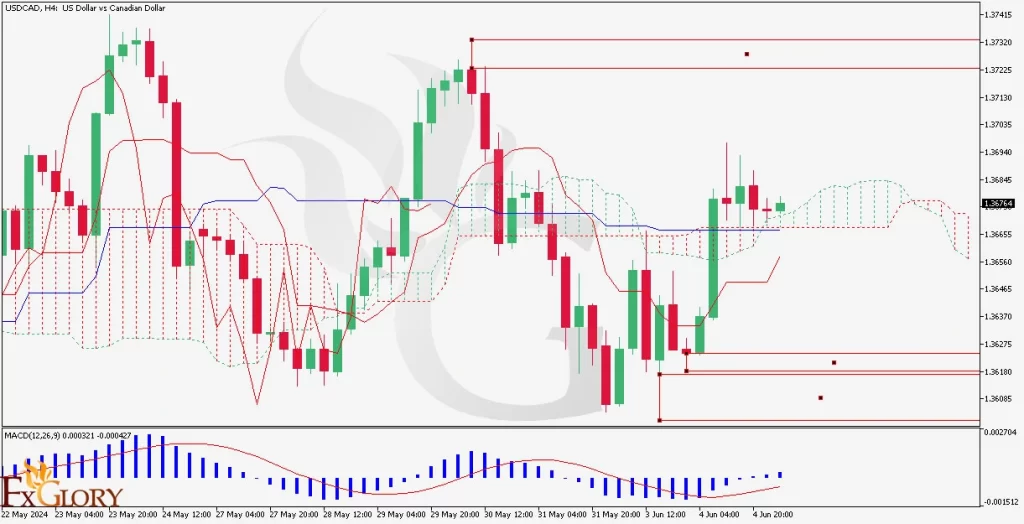
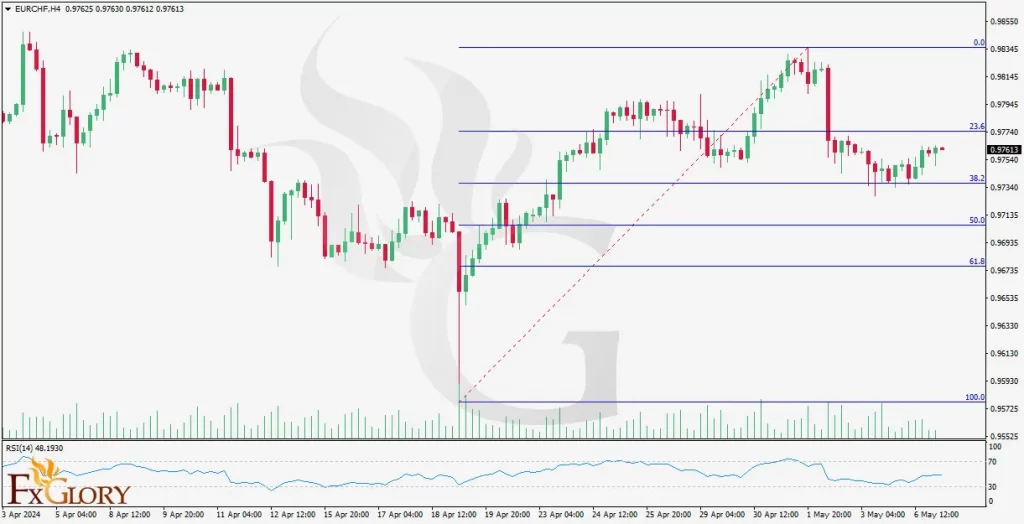
The USD/CAD pair is currently reacting to a dynamic support indicated by the descending red line on the chart, marking a critical support area that could signal a pivotal point for the currency pair’s future movements. This juncture is crucial for investors monitoring the US Dollar price forecast against the Canadian Dollar, as it offers insights for potential USD/CAD investment strategies and short trading opportunities. Given the technical indicators, including the positioning of the RSI and MACD, this moment could lead to significant shifts in USD/CAD investment analysis outcomes. Investors should keep a close eye on this development, as it might dictate the immediate directional trends and offer short-term trading opportunities in the forex market.
Key Technical Indicators:
RSI Indicator: Positioned on a static resistance line, suggesting potential pressure but still under the overbought threshold, hinting that there might be room for upward movement if fundamental data supports it.
MACD Indicator: Showing bearish potential as the MACD line is trending downwards, which could indicate upcoming selling pressure or a continuation of the current downtrend.
Support and Resistance:
Support: The recent lows around 1.37000 provide a short-term support level.
Resistance: The recent high near 1.37810 and 1.38355 serve as resistance levels.
Conclusion and Consideration:
Given the proximity to critical support and impending economic data releases, the USD/CAD pair is at a juncture that could lead to significant volatility. Traders should watch the interaction between the price and the descending resistance, as a break above could suggest bullish potential, particularly if Canadian data underperforms or U.S. data shows unexpected strength.
Disclaimer: The provided analysis is for informational purposes only and does not constitute investment advice. Traders should conduct their own research and analysis before making any trading decisions.
FxGlory
08.05.2024
