forex software

Create and Test Forex Strategies

forex software

Skip to forum content

Forex Software

Create and Test Forex Strategies

You are not logged in. Please login or register.


(Page 4 of 5)

Forex Software → Market Analysis → Daily Analysis By FXGlory

Pages Previous 1 2 3 4 5 Next

You must login or register to post a reply

RSS topic feed

Posts: 76 to 100 of 119

76 (edited by FXGLORY 2024-02-12 04:02:16)

Re: Daily Analysis By FXGlory

XRPUSD analysis for 12.02.2024

Time Zone: GMT +2
Time Frame: 4 Hours (H4)


Fundamental Analysis:
The XRP/USD pair represents the value of Ripple in terms of the US Dollar. Key fundamental factors influencing Ripple may include regulatory news concerning cryptocurrency, overall market sentiment in the crypto space, and technological developments within the Ripple network. Additionally, macroeconomic factors affecting the US Dollar, such as Federal Reserve policy, inflation rates, and economic indicators, can also impact the pair. Investors' appetite for risk in the broader financial markets often correlates with the performance of digital assets like Ripple.


Price Action:

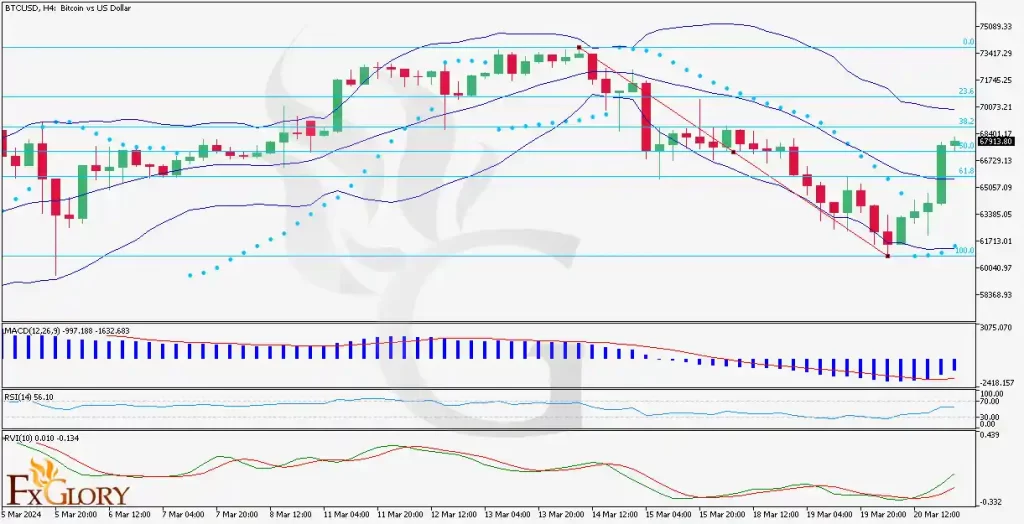
The H4 chart for XRP/USD demonstrates a bullish trend with price action forming a sequence of higher highs and higher lows. The market has sustained an uptrend after a period of consolidation, signaling a robust bullish sentiment. Currently, the price is persistently trading above the short-term moving averages, indicating maintained upward momentum.


Key Technical Indicators:
MACD: The Moving Average Convergence Divergence is displaying a bullish crossover with the MACD line above the signal line, suggesting continued bullish momentum.
RSI: The Relative Strength Index is above 70, indicating that the market may be approaching overbought territory, which could lead to a potential pullback or consolidation.
Parabolic SAR: The dots of the Parabolic SAR are below the price candles, signifying a bullish trend.


Support and Resistance:
Support: The nearest support level can be identified by the 50% Fibonacci retracement level, aligning with previous price consolidations.
Resistance: Immediate resistance is seen at the recent high, which is close to the 0% Fibonacci retracement level. A break above this could lead to testing new resistance levels.


Conclusion and Consideration:
The XRP/USD pair on the H4 timeframe presents a bullish outlook, backed by technical indicators such as the positive MACD and the bullish Parabolic SAR signal. While the RSI suggests caution for potential overbought conditions, the prevailing trend remains upward. Traders should consider the impact of upcoming economic announcements and regulatory developments in the crypto industry. Watching for a sustained break above current resistance or a retracement to support levels for entry points could be prudent, always with a mindful approach to risk management.


Disclaimer: This analysis is for informational purposes only and is not investment advice. Investors should conduct their own due diligence before engaging in trading activities.


FxGlory
12.02.2024

Post's attachments

XRPUSDH4.jpg 303.88 kb, file has never been downloaded. 

You don't have the permssions to download the attachments of this post.

77 (edited by FXGLORY 2024-02-13 07:51:29)

Re: Daily Analysis By FXGlory

EURUSD Technical Analysis for 13.02.2024


Time Zone: GMT +2
Time Frame: 4 Hours (H4)

Fundamental Analysis:
The EUR/USD pair, indicative of the Euro against the US Dollar's value, is sensitive to a range of economic stimuli. Key influences include policy shifts by the European Central Bank and the Federal Reserve, alongside pivotal economic data from both economies such as GDP growth, inflation, and job market dynamics. This currency pair is a global economic health gauge.


Price Action:
EUR/USD's H4 chart reveals a consolidation pattern, with the latest price action pressing against the upper Bollinger Band. This behavior signals a potential breakout or a retraction into the established range.

Key Technical Indicators:
MACD: The MACD remains subdued around the signal line, indicating a lack of decisive momentum in the market.
RSI: The Relative Strength Index hovers around the 50 mark, suggesting a balanced dynamic without clear overextension in either direction.
Parabolic SAR: The last four Parabolic SAR indicators have appeared above the price candles, suggesting a potential downtrend or a pause in bullish activity.
Bollinger Bands: The EUR/USD is trading within the Bollinger Bands, signifying a state of equilibrium with no significant breakouts observed.


Support and Resistance:
Support:
The primary support level is identified at the lower Bollinger Band, reinforced by historical lows.
Resistance: Resistance is currently at the upper Bollinger Band, and a convincing break above this could signal a shift to bullish momentum.


Conclusion and Trading Considerations:
The EUR/USD analysis on the H4 chart suggests a tentative market with a slight bearish hint given by the Parabolic SAR positioning. However, with MACD showing no clear trend and RSI indicating a neutral stance, the market lacks conviction. Traders should monitor forthcoming economic data releases, which could incite volatility and provide clearer direction. A prudent approach is recommended, with close attention to the Bollinger Bands for potential breakout or pullback indications.

Disclaimer: This analysis is for educational purposes only, not constituting investment advice. Traders should undertake their own research and practice caution when engaging in the market.


FxGlory
13.02.2024

Post's attachments

EURUSDH4.jpg 304.23 kb, 11 downloads since 2024-02-13 

You don't have the permssions to download the attachments of this post.

78 (edited by FXGLORY 2024-02-15 04:34:40)

Re: Daily Analysis By FXGlory

Forex News

Platinum analysis for 15.02.2024


Time Zone: GMT +2
Time Frame: 4 Hours (H4)


Fundamental Analysis:
Platinum, when paired against the US Dollar, is influenced by both commodity-specific and broad economic factors. The fundamental drivers for platinum prices include its industrial applications, particularly in automotive catalytic converters, and jewelry demand. Macroeconomic variables, such as the strength of the US Dollar, inflation rates, and global economic health, also play a pivotal role. Additionally, the investment demand for platinum as a hedge against inflation or economic uncertainty can impact its price dynamics.

Price Action:
The H4 chart of PLATINUM/USD indicates a volatile market with recent swings between gains and losses. The price has been moving within a relatively wide range, reflecting indecision among traders. A notable bullish candle has overcome the previous session's losses, suggesting a potential change in momentum. The market is currently testing a critical level that could determine the next directional move.


Key Technical Indicators:
Parabolic SAR
: The Parabolic SAR spots are observed above the price candles, suggesting a downtrend. However, it's important to monitor if the dots flip below the candles, which may indicate a potential upward trend reversal.
Bollinger Bands: The price has touched the upper Bollinger Band, which might act as resistance. The bands are wide, indicating increased market volatility.
MACD: The MACD line is below the signal line, and the histogram is in the negative territory, both signaling bearish momentum.
%R (Williams Percent Range): The %R is near the -80 level, suggesting that the market is not in an oversold condition, leaving room for potential downward movement.


Support and Resistance:
Support: The nearest support level is at the 61.8% Fibonacci retracement, with further support likely near the lower Bollinger Band.
Resistance: Immediate resistance is seen at the recent high near the upper Bollinger Band, followed by the 50% Fibonacci retracement level.


Conclusion and Consideration:
The technical picture for PLATINUM/USD on the H4 timeframe is currently bearish, given the position of the Parabolic SAR and the MACD. The recent price action indicates potential for a reversal if the price can sustain above the upper Bollinger Band. Traders should consider the fundamental factors affecting platinum and the US Dollar, and remain cautious of the current market volatility. A break above the resistance or below the support could give further clues on the directionality. It is recommended to employ prudent risk management strategies in this uncertain environment.


Disclaimer: The analysis provided is for informational purposes only and should not be considered investment advice. Market conditions can change rapidly, and traders should perform their own due diligence before making any financial decisions.


FXGlory
15.02.2024

Post's attachments

fx--PlatinumH4.jpg 329.94 kb, file has never been downloaded. 

You don't have the permssions to download the attachments of this post.

79 (edited by FXGLORY 2024-02-16 02:25:54)

Re: Daily Analysis By FXGlory

Forex News By FXGlory

USDSEK analysis for 16.02.2024


Time Zone: GMT +2
Time Frame: 4 Hours (H4)


Fundamental Analysis:
The USD/SEK currency pair is subject to a range of economic indicators from both the United States and Sweden, including interest rate decisions, GDP reports, and employment data. The strength of the US Dollar is closely tied to Federal Reserve policies and global risk sentiment. Conversely, the Swedish Krona is influenced by the Riksbank's monetary policy, as well as Sweden's trade balance and political stability. Global economic trends and commodity prices, given Sweden's export-oriented economy, also impact the exchange rate.

Price Action:
The H4 chart indicates a period of consolidation with a recent bearish move, suggesting an increase in selling pressure for USD/SEK. The price has breached below a previous consolidation area, indicating potential continuation of the downtrend. The last session closed with a bearish candle, reinforcing the current negative sentiment in the market.


Key Technical Indicators:
Parabolic SAR: The indicator's dots are positioned above the price candles, indicating a bearish trend. The persistence of this pattern could further confirm the downtrend.
Bollinger Bands: The price is oscillating towards the lower Bollinger Band, suggesting that the market is bearish. The band's width indicates moderate market volatility.
MACD: The MACD histogram is below the baseline, and the signal line is above the MACD line, both signifying bearish momentums.
RSI: The RSI is hovering around 40, which suggests that while the market is bearish, it is not in oversold territory yet.


Support and Resistance:
Support: The nearest support level can be identified at the lower end of the recent price consolidation area, followed by the lower Bollinger Band.
Resistance: Resistance can be seen at the level where the price broke down from the consolidation, with additional resistance near the middle Bollinger Band.


Conclusion and Consideration:
The technical indicators for USD/SEK on the H4 chart suggest a bearish outlook, with both Parabolic SAR and MACD indicating downward momentum. The recent price action supports the likelihood of further declines. However, the market is not oversold according to the RSI, which might imply that there is room for further downward movement before a potential reversal. Traders should monitor key economic releases from the US and Sweden, as these could significantly impact the pair's movement. Caution should be taken due to the market volatility, and employing a risk management strategy is advised.


Disclaimer:
This analysis is for informational purposes only and should not be construed as investment advice. Market conditions can change rapidly, and traders are advised to conduct their own research before making any financial decisions.


FxGlory
16.02.2024

Post's attachments

FXGlory - USDSEK - 02.16.2024 - Technical Analysis.jpg 345.05 kb, file has never been downloaded. 

You don't have the permssions to download the attachments of this post.

80 (edited by FXGLORY 2024-02-19 04:29:50)

Re: Daily Analysis By FXGlory

Forex News By FXGlory


XRPUSD analysis for 19.02.2024


Time Zone: GMT +2
Time Frame: 4 Hours (H4)


Fundamental Analysis:
XRP, paired against the US Dollar as XRPUSD, is influenced by both cryptocurrency market sentiment and macroeconomic factors affecting the USD. Regulatory news specifically targeting Ripple, the company associated with XRP, can cause price fluctuations, as can broader market trends in blockchain and financial technology sectors. Additionally, changes in investor risk appetite, as well as developments in monetary policy from the US Federal Reserve, can affect this pair's movement.


Price Action:
The XRPUSD H4 chart indicates a bullish trend, with the price having recently risen above several key resistance levels. The price has been making a series of higher highs and higher lows, suggesting a strong upward momentum. However, the current price is retracing, possibly retesting previous resistance levels now turned support.


Key Technical Indicators:
Bollinger Bands:
The price has pulled back to the middle Bollinger Band, which could act as support, suggesting a consolidation phase after the recent uptick.
RSI (Relative Strength Index): The RSI is above 60, indicating a strong bullish momentum, yet not in the overbought territory which offers room for potential further upward movement.
MACD (Moving Average Convergence Divergence): The MACD line remains above the signal line and above zero, confirming the bullish sentiment, although the histogram suggests a slowing momentum as bars decrease in height.


Support and Resistance Levels:
Support: The 50% Fibonacci retracement level is acting as immediate support, with additional support potentially at the 38.2% level if a deeper pullback occurs.
Resistance: The next resistance is near the 61.8% Fibonacci retracement level, with further pressure likely at the recent high just under the 0.58 mark.


Conclusion and Consideration:
The bullish trend in XRPUSD on the H4 chart is supported by the positive alignment of MACD and the above-midpoint RSI reading. The approach towards the 61.8% Fibonacci level could be critical; if it breaks, it may indicate continued bullish momentum. Traders should consider global crypto market sentiment and regulatory news affecting Ripple, as well as USD fluctuations. Risk management strategies should be in place to prepare for volatility inherent in the cryptocurrency markets.


Disclaimer: This analysis is for informational purposes only and should not be taken as investment advice. Decisions should be based on individual research and risk tolerance.


FxGlory
19.02.2024

Post's attachments

FXGlory-daily-Technical-Analysis---XRPUSD-H4.jpg 328.63 kb, file has never been downloaded. 

You don't have the permssions to download the attachments of this post.

81 (edited by FXGLORY 2024-02-20 09:18:43)

Re: Daily Analysis By FXGlory

EURNZD analysis for 20.02.2024


Time Zone: GMT +2
Time Frame: 4 Hours (H4)


The EURNZD pair's current bearish trend is showing signs of a potential reversal, influenced by the Eurozone's economic indicators and New Zealand's monetary policy decisions and commodity exports. The recent price action has rebounded from the lower Bollinger Band, moving towards the central average, indicating potential resistance. The MACD's trajectory below the signal line points to a diminishing bearish momentum, and the RSI's increase suggests a growing buying interest. The pair's support is identified at the recent lows, with resistance at the moving average and previous highs. As the bearish trend begins to wane, traders should closely monitor economic updates and maintain robust risk management strategies.


Disclaimer: This analysis is for informational purposes only and should not be construed as investment advice. Market conditions can change rapidly, and traders are advised to conduct their own research before making any financial decisions.


To gain deeper insight into the EURNZD's technical and fundamental analysis, please click on this link.


FxGlory
20.02.2024

Post's attachments

EURNZD H4 Chart Technical Analysis on 02-20-2024 .jpg 142.71 kb, file has never been downloaded. 

You don't have the permssions to download the attachments of this post.

82 (edited by FXGLORY 2024-02-21 10:45:08)

Re: Daily Analysis By FXGlory

CADJPY analysis for 21.02.2024


Time Zone: GMT +2
Time Frame: 4 Hours (H4)


Fundamental Analysis:
In the foreign exchange market, the CAD/JPY pair signifies the value of the Canadian Dollar against the Japanese Yen. This currency pair is swayed by economic reports, monetary policy decisions, and geopolitical events from both Canada and Japan. Important economic indicators like inflation rates, employment data, and changes in gross domestic product are critical in influencing the strength of each currency. Decisions by the Bank of Canada and the Bank of Japan on interest rates are also crucial. Moreover, as Japan is often considered a safe-haven market, global economic turmoil can lead to strengthening of the Yen.


Price Action:
The CAD/JPY H4 chart indicates a phase of consolidation with a slight uptrend bias. The price action is typified by higher lows and higher highs, suggesting bullish momentum. However, the latest candles show hesitation, indicating a possible consolidation or a forthcoming reversal, with the price stabilizing after recent gains.


Key Technical Indicators:
Bollinger Bands: The price is hovering near the upper Bollinger Band, suggesting that the bullish trend may be overextended. However, the bands are moderately wide, which indicates sustained market volatility.
MACD (Moving Average Convergence Divergence): The MACD line is above the signal line but appears to be converging towards it, signaling a potential slowdown in bullish momentum and the possibility of a bearish crossover in the near future.
RSI (Relative Strength Index): The RSI is above 50, which is bullish but approaching the overbought territory, suggesting that the market may be due for a correction or pullback.


Support and Resistance:
Support: The nearest key support level is at the recent swing low around the 110.800 zone, which could provide a base for the current trend.
Resistance: Immediate resistance can be found near the upper Bollinger Band, around the 111.400 level, which may pose a challenge for further bullish price movements.


Conclusion and Consideration:
The technical analysis of the CAD/JPY H4 chart suggests a current bullish trend that is showing signs of a potential pullback, as indicated by the proximity to the upper Bollinger Band and the converging MACD lines. The RSI also indicates that the market could be approaching overbought conditions. Traders should keep an eye on the price action near the upper Bollinger Band and watch for a crossover of the MACD lines for signs of a possible reversal. Upcoming economic data releases and policy decisions from the Bank of Canada and the Bank of Japan should be monitored closely as they may have a significant impact on the pair's movement. It's recommended to use sound risk management practices, including setting stop losses and taking profits at identified support and resistance levels.


Disclaimer: This analysis is for informational purposes only and should not be construed as investment advice. Always conduct your due diligence before trading.


FXGlory
02.21.2024

Re: Daily Analysis By FXGlory

Daily Forex News By FXGlory

BCHUSD analysis for 22.02.2024


Time Zone: GMT +2
Time Frame: 4 Hours (H4)


Fundamental Analysis:

Bitcoin Cash (BCH) is a cryptocurrency that resulted from a hard fork of Bitcoin, aiming to provide faster transactions by increasing the block size. Fundamental factors impacting BCH include its adoption rate, regulatory news regarding cryptocurrency, technological advancements, and the overall sentiment in the cryptocurrency market. Additionally, competition from other cryptocurrencies and potential forks can influence investor confidence and price. With the ongoing debate over scalability and transaction fees in the crypto space, developments within the Bitcoin Cash community and its perceived advantages over Bitcoin can also play a crucial role.


Price Action:
The H4 chart of BCHUSD shows that after a substantial uptrend, the price action has entered a period of consolidation. The recent price movements indicate a slight bearish bias as the market made lower highs and lower lows, suggesting a potential trend reversal. However, the last candlestick is touching the lower Bollinger Band, hinting at a possible oversold condition and a short-term bounce or price correction.


Key Technical Indicators:
Bollinger Bands:
The price is touching the lower Bollinger Band, indicating a possible oversold condition that could lead to a bounce back towards the mean.
MACD (Moving Average Convergence Divergence): The MACD line is below the signal line and the histogram bars are decreasing in height, suggesting bearish momentum is waning.
RSI (Relative Strength Index): The RSI is slightly below the midline at 46.53, indicating neither overbought nor oversold conditions, but leaning towards a bearish sentiment.


Support and Resistance:
Support:
The first level of support is found near the 61.8% Fibonacci retracement level at approximately $253.51. If this level is breached, the next support could be around the 78.6% retracement level.
Resistance: The immediate resistance is at the 50% Fibonacci level, with further resistance possible at the 38.2% retracement and the middle Bollinger Band.


Conclusion and Consideration:

The BCHUSD pair on the H4 chart indicates a short-term bearish momentum with the potential for a bounce back due to the proximity to the lower Bollinger Band. Traders should consider the bearish MACD crossover but also be wary of a potential relief rally if the RSI indicates an oversold condition. Monitoring fundamental news in the crypto space, particularly regarding Bitcoin Cash, will be crucial. As the price approaches key Fibonacci levels, traders should employ risk management strategies and be prepared for possible volatility. It's important to watch for a solid break below current support or a rebound to confirm the next directional move.


Disclaimer: The provided analysis is for informational purposes only and does not constitute investment advice. Traders should conduct their own research and analysis before making any trading decisions.


FXGlory
22.02.2024

Re: Daily Analysis By FXGlory


GOLD analysis for 23.02.2024


Time Zone: GMT +2
Time Frame: 4 Hours (H4)

The H4 GOLD/USD chart is currently exhibiting signs of a bullish trend, with the price consistently above the Ichimoku Cloud, indicating an optimistic short-term outlook. The Bollinger Bands suggest that volatility is within a normal range, and the RSI's position points to a trend that is growing but not overreaching. The MACD's positive values further affirm the bullish direction. With the market showing clear support and resistance levels, investors should proceed with caution, considering the RSI's neutral indication and the potential for fundamental economic factors to sway the gold market.


Disclaimer: This analysis is intended for informational purposes only and should not be taken as investment advice. Trading decisions should be based on individual risk tolerance, market knowledge, and thorough analysis.


To read more about the GOLD's technical and fundamental prospects, please click on this link.


FxGlory
23.02.2024

85 (edited by FXGLORY 2024-02-26 04:19:09)

Re: Daily Analysis By FXGlory


Palladium analysis for 26.02.2024


Time Zone: GMT +2
Time Frame: 4 Hours (H4)


Palladium’s price action on the H4 chart is currently in a holding pattern, indicated by the flat Ichimoku Cloud and a balanced RSI indicator. The MACD's lack of clear divergence points to a wait-and-see approach for traders. A breakout beyond the current support or resistance boundaries could signal a new price direction. Keeping tabs on economic news and palladium production is crucial, and risk management remains a top priority due to possible sharp price movements.


Disclaimer: This analysis is intended for informational purposes only and should not be taken as investment advice. Trading decisions should be based on individual risk tolerance, market knowledge, and thorough analysis.


To read more about the Palladium’s technical and fundamental prospects, please check Palladium analysis on FXGlroy.com


FxGlory
26.02.2024

Post's attachments

Palladium-analysis---H4---02.26.jpg 163.52 kb, file has never been downloaded. 

You don't have the permssions to download the attachments of this post.

86 (edited by FXGLORY 2024-02-27 07:42:51)

Re: Daily Analysis By FXGlory

BTCUSD analysis for 27.02.2024


Time Zone: GMT +2
Time Frame: 4 Hours (H4)

In the current analysis of BTCUSD, the 4-hour chart exhibits a bullish pattern, propelled by fundamental influences like regulatory changes and investor sentiment, alongside technical momentum. Bitcoin's decentralized nature and reaction to geopolitical and macroeconomic factors enhance its appeal and influence its market value. The chart's depiction of higher lows and highs points to an ongoing bullish momentum, with previous resistance levels now acting as support, potentially paving the way for further increases.


Technical indicators such as the MACD and RSI align with a bullish perspective, while the positioning of the price above moving averages suggests sustained positive momentum. Nonetheless, traders are reminded of the cryptocurrency's inherent volatility and the importance of staying informed on relevant news. A disciplined approach to risk management and not solely depending on technical analysis is recommended.


Disclaimer: This analysis is intended for informational purposes only and should not be taken as investment advice. Trading decisions should be based on individual risk tolerance, market knowledge, and thorough analysis.


To read more about the BTCUSD's technical and fundamental prospects, please click on this link


FXGlory
27.02.2024

Post's attachments

BTCUSD technical analysis for 27.02.2024- H4 .jpg 159.72 kb, file has never been downloaded. 

You don't have the permssions to download the attachments of this post.

Re: Daily Analysis By FXGlory

NZDCAD analysis for 28.02.2024


Time Zone: GMT +2
Time Frame: 4 Hours (H4)


Fundamental Analysis:
The NZD/CAD currency pair reflects the exchange rate between the New Zealand Dollar and the Canadian Dollar, two commodity-dependent economies. The NZD is often influenced by dairy prices and New Zealand's economic indicators, while the CAD is closely tied to oil prices and economic developments in Canada. Trade relationships with global partners, especially China and the United States, can significantly impact these currencies. Additionally, monetary policy announcements from the Reserve Bank of New Zealand and the Bank of Canada, as well as changes in global risk sentiment, are important to monitor for their potential influence on the NZD/CAD exchange rate.


Price Action:
The H4 chart for NZDCAD displays a zigzag pattern, indicating a period of consolidation with clear swings between support and resistance levels. The price appears to be within a downtrend channel but recently showing signs of recovery, with the latest candles suggesting a potential reversal or pullback.


Key Technical Indicators:
MACD: The MACD line is close to the signal line, with the histogram showing minimal bars, indicating a lack of strong momentum in either direction. This could suggest a market in balance or indecision among traders.

RSI (Relative Strength Index): The RSI indicator is around the midpoint of 50, which does not indicate an overbought or oversold market. This suggests a neutral momentum currently in the market.

Ichimoku: The price is navigating around the Ichimoku cloud, which could be indicative of a potential trend change if the price breaks through the cloud.


Support and Resistance:
Support: The current support level can be identified by the lower boundary of the recent price channel and the consolidation area.

Resistance: Resistance is likely at the upper boundary of the price channel and the previous high points within the consolidation range.


Conclusion and Consideration:
The H4 chart for NZDCAD shows a market experiencing consolidation, with potential for a breakout in either direction. While recent price action suggests a slight bullish recovery, the key technical indicators do not present a clear direction, indicating a wait-and-see approach may be prudent. Traders should keep abreast of economic indicators from both New Zealand and Canada, as well as global commodity prices, to anticipate potential shifts in the currency pair's movement.


Disclaimer: This analysis is intended for informational purposes only and should not be taken as investment advice. Trading decisions should be based on individual risk tolerance, market knowledge, and thorough analysis.


FXGlory
28.02.2024

Post's attachments

FX---NZDCADH4.jpg 176.59 kb, file has never been downloaded. 

You don't have the permssions to download the attachments of this post.

Re: Daily Analysis By FXGlory

BTCUSD analysis for 29.02.2024


Time Zone: GMT +2
Time Frame: 4 Hours (H4)


Fundamental Analysis:
Bitcoin, unlike traditional currencies or commodities, is influenced by factors such as regulatory news, technological developments, and its adoption by businesses and consumers. Market sentiment can also be significantly affected by global economic factors, security of the exchanges, and broader financial market trends. Bitcoin's decentralized nature makes it sensitive to perceived risk in blockchain technology and changes in sentiment towards cryptocurrency as an asset class.


Price Action:
The BTCUSD H4 chart exhibits a strong uptrend, with the price moving sharply higher. This rally signifies a bullish market sentiment with increasing buyer dominance. Recently, the price has reached new highs, indicating a continued bullish outlook in the short term.


Key Technical Indicators:
Bollinger Bands: The price has been consistently riding the upper Bollinger Band, indicating a strong uptrend. This could suggest that the market is potentially overbought, but in a strong trend, the price can remain overbought for an extended period.

RSI (Relative Strength Index): The RSI is above 70, suggesting that the market may be overbought. However, in strong trending markets, the RSI can remain in overbought or oversold territories for prolonged periods.

MACD (Moving Average Convergence Divergence): The MACD line is above the signal line and has been expanding, which indicates strong bullish momentum. This could suggest that the uptrend is likely to continue.

Parabolic SAR: The last 14 dots of the Parabolic SAR are below the candles, which confirms the bullish trend. This indicator suggests that the uptrend is strong and has been consistent over the last several periods.


Support and Resistance:
Support: The nearest support level can be identified by the recent lows before the latest upward price movement.

Resistance: Given the recent price surge, the resistance would be at the all-time highs or yet to be established as the price is in discovery mode.


Conclusion and Consideration:
In the H4 chart for BTCUSD, the market is exhibiting a strong bullish trend, as indicated by the Bollinger Bands and the Parabolic SAR, with the MACD supporting the view of sustained bullish momentum. The RSI suggests that the market is overbought, which in the context of a strong trend, does not necessarily imply an immediate reversal. Traders should consider the possibility of continued bullish momentum, but also be cautious of potential retracements, as nothing moves up in a straight line. It's advisable for traders to monitor the market for signs of trend exhaustion and to employ proper risk management strategies, given the volatility of Bitcoin. Keeping an eye on crypto-related news and market sentiment is also crucial for anticipating potential price movements.


Disclaimer: This analysis is intended for informational purposes only and should not be taken as investment advice. Trading decisions should be based on individual risk tolerance, market knowledge, and thorough analysis.


FxGlory
29.02.2024

Post's attachments

FX---Feb-29th---BTCUSDH4.jpg 134.35 kb, 3 downloads since 2024-02-29 

You don't have the permssions to download the attachments of this post.

89 (edited by FXGLORY 2024-03-04 04:19:04)

Re: Daily Analysis By FXGlory

EURGBP analysis for 04.03.2024

Time Zone: GMT +2
Time Frame: 4 Hours (H4)

The H4 chart reveals a gradual uptrend in EUR/GBP, with fundamentals pointing to economic indicators and Brexit as key drivers. Technically, the price nears the upper Bollinger Band with a bullish Parabolic SAR, though RSI and MACD suggest a cautious approach before resistance. Identified support and resistance are at the middle Bollinger Band and the upper band, respectively.

Disclaimer: This analysis is for informational purposes only and should not be taken as investment advice. It's crucial for traders to conduct their own research and consider their risk tolerance before trading.

Unlock exclusive insights and elevate your trading strategy by clicking here.


FXGlory
04.03.2024

Post's attachments

EURGBPH4.jpg 147.62 kb, 3 downloads since 2024-03-04 

You don't have the permssions to download the attachments of this post.

90 (edited by FXGLORY 2024-03-05 08:49:58)

Re: Daily Analysis By FXGlory

AUDJPY analysis for 05.03.2024


Time Zone: GMT +2
Time Frame: 4 Hours (H4)


The AUD/JPY currency pair is currently showing a positive trend reversal, transitioning from a decline to an upward trajectory, evidenced by the formation of higher highs and higher lows. The recent recovery from the lower Bollinger Band is a strong indicator of a possible continuation of this upward trend. Additionally, the Parabolic SAR points to a bullish outlook in the near term, complemented by the MACD, which is leaning towards an increase in bullish momentum, despite the RSI hovering around a moderate level of 46. Support is primarily found at the lower Bollinger Band and the recent low points, whereas resistance is likely encountered at the middle Bollinger Band and the heights reached previously. The direction of this pair will be significantly influenced by fluctuations in commodity prices, shifts in global risk appetite, and policy decisions from the Reserve Bank of Australia and the Bank of Japan. Traders are encouraged to keep a close watch on these determinants and prioritize risk management practices in their decision-making.


Disclaimer: This analysis is for informational purposes only and should not be taken as investment advice. It's crucial for traders to conduct their own research and consider their risk tolerance before trading.


Explore in-depth market insights and strategic trading tips by clicking here.


FXGlory
05.03.2024

Post's attachments

AUDJPYH4.jpg-FX.jpg 146.91 kb, 4 downloads since 2024-03-05 

You don't have the permssions to download the attachments of this post.

Re: Daily Analysis By FXGlory

EURUSD analysis for 06.03.2024


Time Zone: GMT +2
Time Frame: 4 Hours (H4)

On the H4 chart, EUR/USD is showing a bullish trend, staying consistently above the middle Bollinger Band, with higher highs and lows suggesting upward momentum. Approaching the upper Bollinger Band indicates potential resistance or continued uptrend. Technicals support growth with Parabolic SAR below price and RSI at a moderate 52.87, hinting at bullish momentum but not overbought. However, the MACD suggests a decrease in momentum, signaling caution. Watch for a breakout or resistance at the upper Bollinger Band and stay updated with fundamental news that may impact market volatility. Maintain caution and practice strict risk management.
Disclaimer: This analysis is for informational purposes only and should not be taken as investment advice. It's crucial for traders to conduct their own research and consider their risk tolerance before trading.

Explore in-depth market insights and strategic trading tips by visiting fxglory.com.


FXGlory
06.03.2024

Re: Daily Analysis By FXGlory


GOLD analysis for 07.03.2024


Time Zone: GMT +2
Time Frame: 4 Hours (H4)

On the H4 chart, the GOLD/USD pairing exhibits a pronounced upward momentum. Fundamentally, the precious metal's value often climbs in response to certain economic signals, like central bank decisions or periods of uncertainty, solidifying its role as a refuge for investors. From a technical vantage point, gold prices are trending well above the Ichimoku cloud, hinting at strong bullish sentiment but facing imminent resistance, underscored by the market's volatility near the upper Bollinger Band. The RSI suggests an overbought market, potentially foreshadowing a downturn, yet the bullish MACD aligns with the uptrend's persistence. Notable support resides at the lower boundary of the Ichimoku cloud, with pivotal resistance appearing near the recent highs and round number markers. Vigilance regarding global economic and political news, combined with sound risk management, is recommended in navigating gold's dynamic pricing landscape.

Disclaimer: This overview is provided for information only, without constituting financial advice. It's imperative for market participants to perform independent research and tailor their strategies to their risk profile before engaging in trades.

For further detailed market insights and expert trading strategies, click here.


FXGlory
07.03.2024

93 (edited by FXGLORY 2024-03-08 03:39:42)

Re: Daily Analysis By FXGlory

USDJPY analysis for 08.03.2024


Time Zone: GMT +2
Time Frame: 4 Hours (H4)


The USD/JPY pair has been exhibiting a marked downtrend on the H4 chart, as indicated by consistent lower highs and lower lows, hinting at continued bearish sentiment. The fundamental outlook hinges on U.S. economic indicators and the Bank of Japan's monetary policy, with the yen's safe-haven status also playing a role amid global financial volatility. Technical indicators support the downtrend: the price below the Ichimoku cloud suggests bearishness, the Bollinger Bands indicate a sustained downward push into oversold territory, and the MACD's divergence below the signal line reveals increasing selling momentum. The RSI's dip below 30 could signal an oversold market, potentially leading to a retracement. Resistance and support are identified at 148.180 and 147.530, respectively. Traders are advised to watch for economic updates and maintain risk management practices.


Disclaimer: This analysis is for informational purposes only and should not be taken as investment advice. It's crucial for traders to conduct their own research and consider their risk tolerance before trading.


Explore in-depth market insights and strategic trading tips by clicking here.


FXGlory
08.03.2024

94 (edited by FXGLORY 2024-03-12 08:28:38)

Re: Daily Analysis By FXGlory

EURUSD analysis for 12.03.2024


Time Zone: GMT +2
Time Frame: 4 Hours (H4)

The EURUSD pairing is experiencing a period of equilibrium above the Ichimoku cloud after its ascent, indicating a bullish backdrop with emerging caution. Economic metrics and policy shifts from the Eurozone and the US are pivotal to its course. Technically speaking, the bullish stance is suggested by the Ichimoku, yet the RSI around 59 and a narrowing MACD hint at a decelerating climb. Support is established at the lower span of the Ichimoku cloud and further at 1.0895, while resistance is faced near the recent top at 1.0935 and then at 1.0954. Vigilance is advised concerning the forthcoming financial disclosures from both economies, and traders should remain vigilant, employing risk management in anticipation of potential market changes.


Disclaimer: This analysis is for informational purposes only and should not be taken as investment advice. It's crucial for traders to conduct their own research and consider their risk tolerance before trading.


Explore in-depth market insights and strategic trading tips by clicking here.


FXGlory
12.03.2024

Post's attachments

EURUSDH4-Daily-Analysis-12.03.jpg 129.29 kb, 3 downloads since 2024-03-12 

You don't have the permssions to download the attachments of this post.

95 (edited by FXGLORY 2024-03-14 02:23:40)

Re: Daily Analysis By FXGlory

March 14, 2024 GBPAUD Market Outlook


Time Zone: GMT +2
Time Frame: H4

Current analysis of the GBPAUD on the 4-hour chart points to a downward trend, as the price action stays suppressed beneath the Ichimoku cloud, charting lower highs and lows consistently. The RSI's position under 40 reinforces the current downtrend, a sentiment further verified by the MACD. Key technical levels include a support at 1.93285, while resistance is pegged near 1.94715. The currency pair's direction will be heavily influenced by the UK's and Australia's economic reports and the prevailing sentiment in global risk appetite. The potential for market fluctuations necessitates vigilant risk management.


Disclaimer: The information in this analysis is provided for informational purposes only and is not investment advice. Traders should perform their own due diligence and consider their appetite for risk before entering the market.


For detailed market insights and strategic trading guidance, click here.


FXGlory
14.03.2024

Post's attachments

Daily-Market-Analysis-for--GBPAUDH4.14.03.jpg 139.01 kb, file has never been downloaded. 

You don't have the permssions to download the attachments of this post.

96 (edited by FXGLORY 2024-03-15 02:18:43)

Re: Daily Analysis By FXGlory

EURUSD analysis for 15.03.2024


Time Zone: GMT +2
Time Frame: 4 Hours (H4)


The EUR/USD currency pair reflects the dynamic economic data and policy shifts from the Eurozone and the United States. On the H4 chart, bearish trends prevail, with prices dropping beneath the Ichimoku cloud and persistently forming lower peaks and troughs. The MACD indicator corroborates the downtrend, as does the RSI, which remains below the midline but not oversold—suggesting potential for further declines. Immediate support is found near 1.0885, with resistance around 1.0930. Investors should stay updated on economic developments influencing both currencies and employ measured risk management practices.


Disclaimer: This analysis is for informational purposes only and should not be taken as investment advice. It's crucial for traders to conduct their own research and consider their risk tolerance before trading.


Explore in-depth market insights and strategic trading tips by clicking here.


FXGlory
15.03.2024

Post's attachments

Daily-Analysis-EURUSDH4.15.03.jpg 132.04 kb, 5 downloads since 2024-03-15 

You don't have the permssions to download the attachments of this post.

Re: Daily Analysis By FXGlory

EURUSD analysis for 18.03.2024


Time Zone: GMT +2
Time Frame: 4 Hours (H4)


Facing headwinds from economic data and policy decisions on both sides of the Atlantic, the EUR/USD shows bearish tendencies on the H4 timeframe. Technicals indicate a firm downtrend, with the RSI dipping below 40 hinting at a market that could be due for a correction. Conversely, bearish sentiment is echoed by the MACD's stay in negative territory. Looking at support and resistance levels, the currency pair finds its immediate floor at the recent low, while initial resistance lies at the downtrend start and the Ichimoku cloud’s edge. As traders consider entry points, a recovering RSI or a positive turn in MACD could signal shifts worth noting. Vigilance on part of traders is advisable, given the pair’s sensitivity to the evolving economic landscape.


Disclaimer: This analysis is for informational purposes only and should not be taken as investment advice. It's crucial for traders to conduct their own research and consider their risk tolerance before trading.


Explore in-depth market insights and strategic trading tips by clicking here.

FXGlory
18.03.2024

Post's attachments

EURUSD- analysis-on-18-03-2024.jpg 133.95 kb, 5 downloads since 2024-03-18 

You don't have the permssions to download the attachments of this post.

98 (edited by FXGLORY 2024-03-19 09:03:14)

Re: Daily Analysis By FXGlory

CADJPY analysis for 19.03.2024


https://fxglory.com/wp-content/uploads/2024/03/FX-CADJPY-1024x524.webp


Time Zone: GMT +2
Time Frame: 4 Hours (H4)


On the H4 chart, CAD/JPY trades above the Ichimoku Cloud with a bullish outlook. RSI is strong but not overbought, and MACD lines suggest bullish continuation. Traders should note the recent higher low as support and the recent high as resistance, keeping in mind fundamental factors like oil prices and market risk sentiment.


Disclaimer: This analysis is for informational purposes only and should not be taken as investment advice. It's crucial for traders to conduct their own research and consider their risk tolerance before trading.


Discover detailed market insights and strategic trading advice by clicking here.


FXGlory
19.03.2024

Post's attachments

CADJPY 4H Daily MArket Analysis - 19.03.2024 .jpg 143.61 kb, file has never been downloaded. 

You don't have the permssions to download the attachments of this post.

99 (edited by FXGLORY 2024-03-20 06:01:10)

Re: Daily Analysis By FXGlory

GBPCAD analysis for 20.03.2024


Time Zone: GMT +2
Time Frame: 4 Hours (H4)


Trading near the pivotal Ichimoku Cloud, the GBPCAD pair’s current chart signifies a period of indecision, with the RSI resting at a tepid 53.45 and the MACD hinting at bearish undertones as it resides beneath the signal line. Observing the Cloud’s contour for immediate support and resistance gives a technical edge, while fundamental drivers such as the volatility of oil prices and evolving UK economic narratives warrant continuous surveillance for traders looking to gauge potential market swings.


Disclaimer: This analysis is for informational purposes only and should not be taken as investment advice. It's crucial for traders to conduct their own research and consider their risk tolerance before trading.

Discover detailed market insights and strategic trading advice by clicking here.


FXGlory
20.03.2024

Post's attachments

GBPCADH4.jpg 366.43 kb, file has never been downloaded. 

You don't have the permssions to download the attachments of this post.

100 (edited by FXGLORY 2024-03-21 05:04:46)

Re: Daily Analysis By FXGlory

BTCUSD analysis for 21.03.2024


https://fxglory.com/wp-content/uploads/2024/03/BTCUSD_FX_Daili-Analysis-H4-21.03-1024x524.webp


Time Zone: GMT +2
Time Frame: 4 Hours (H4)


The BTC/USD pair demonstrates signs of a turnaround, with the market structure on the 4-hour chart forming a pattern of increasing lows and highs, hinting at a potential shift in trend from bearish to bullish. The driving factors for Bitcoin's market value against the US Dollar are a mixture of Bitcoin’s adoption curve, global regulatory shifts, technological breakthroughs, and key US economic indicators. The MACD's position above the signal line and a positive RVI suggest bullish market conditions. The RSI, positioned just above the midpoint, indicates there's room for upward price movement. Price is approaching the upper Bollinger Band, signaling potential upcoming resistance, while the price also approaches the 50% Fibonacci retracement level, an area known for resistance. Support lies at the latest low, in line with the lower Bollinger Band, and the pivotal 0% Fibonacci level.


Disclaimer: This analysis is for informational purposes only and should not be considered as investment advice. Traders are advised to do their own research and consider their risk tolerance prior to trading.


For detailed market analysis and strategic trading insights, visit here.


FXGlory
21.03.2024

Posts: 76 to 100 of 119

Pages Previous 1 2 3 4 5 Next

You must login or register to post a reply

Forex Software → Market Analysis → Daily Analysis By FXGlory

Similar topics in this forum