Re: Forex Technical Analysis & Forecast by RoboForex
Fibonacci Retracements Analysis 20.04.2020 (GOLD, USDCHF)
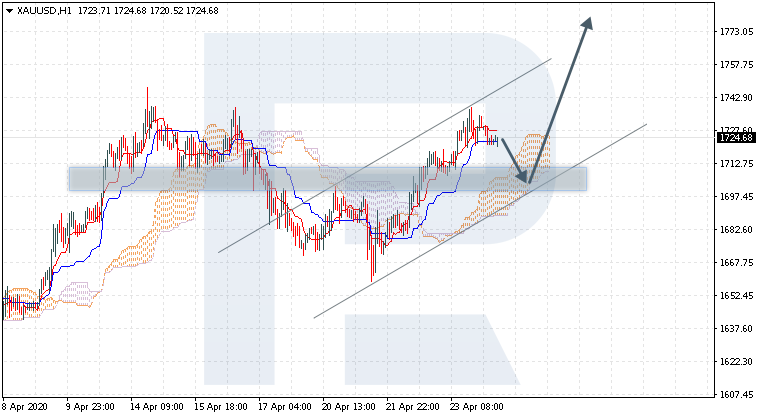
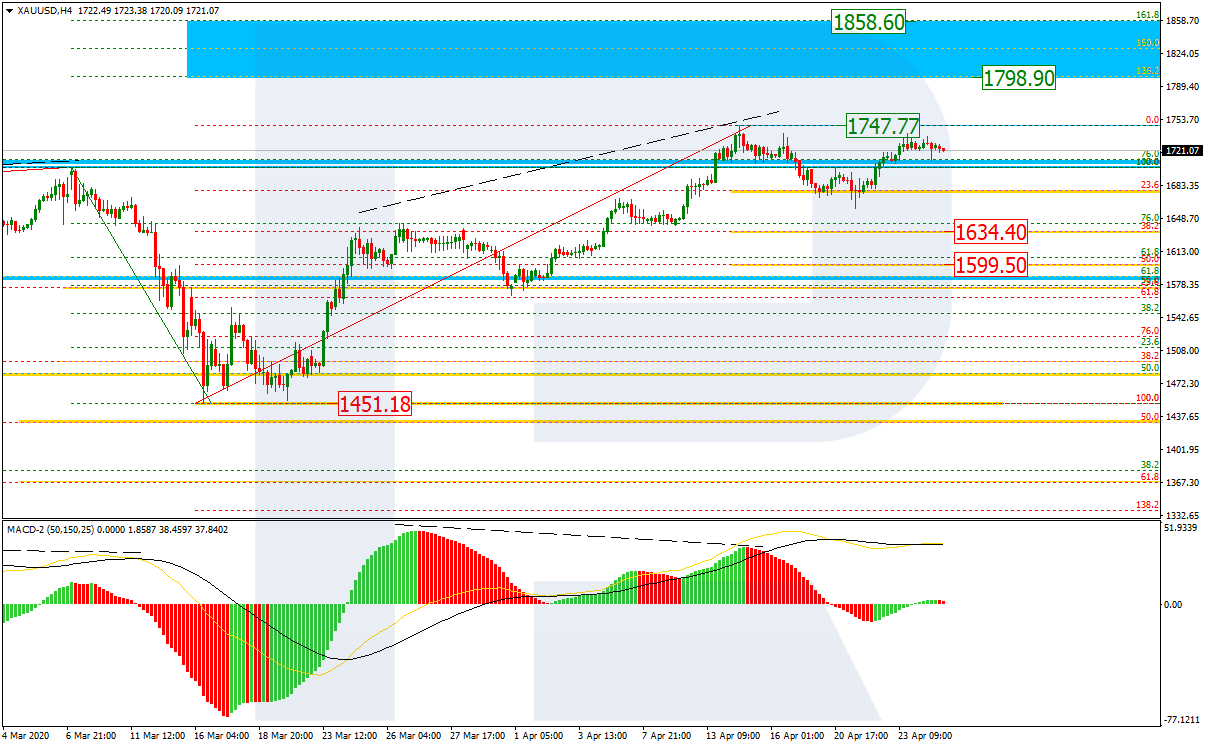
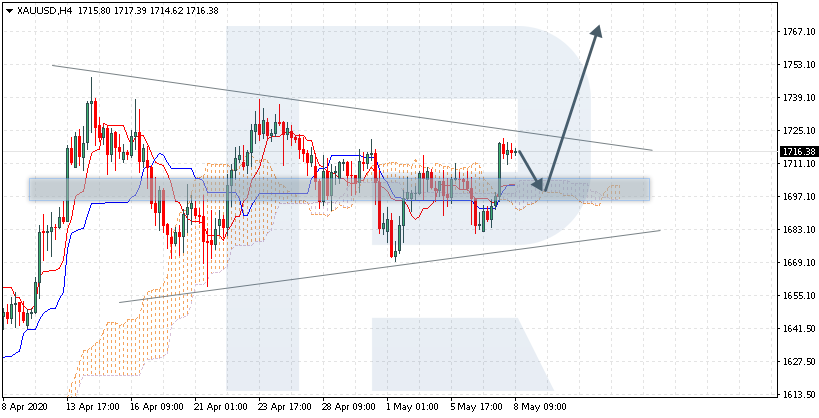
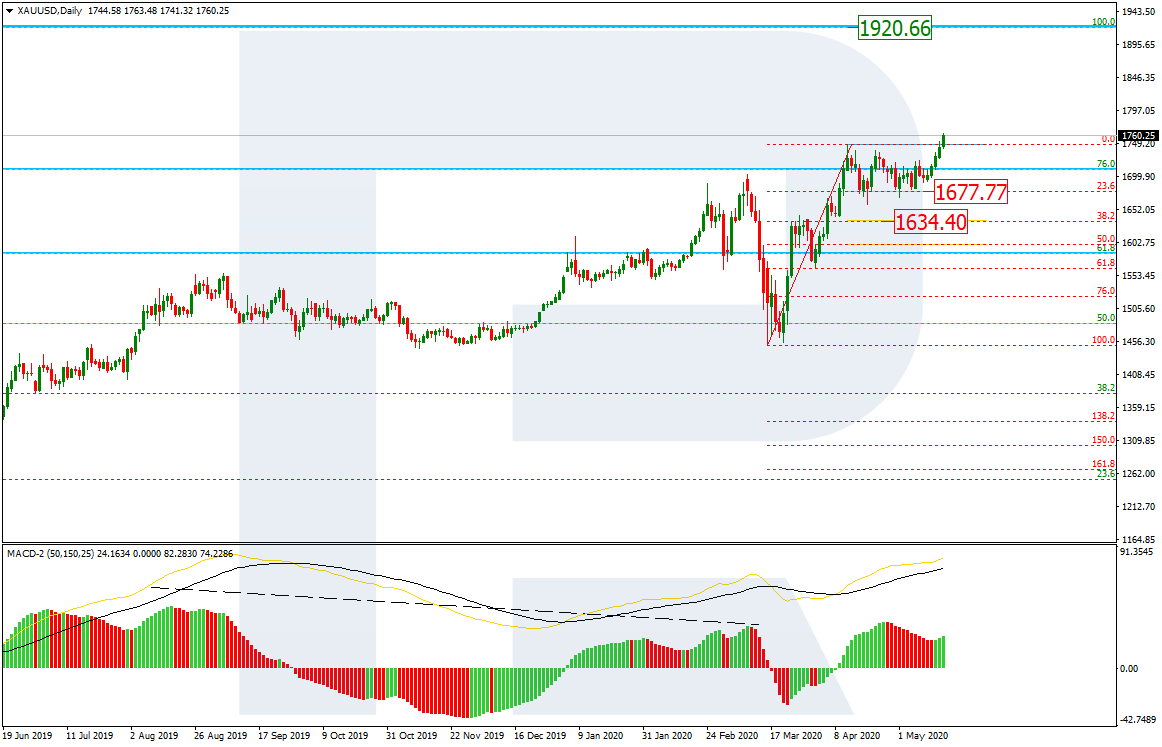
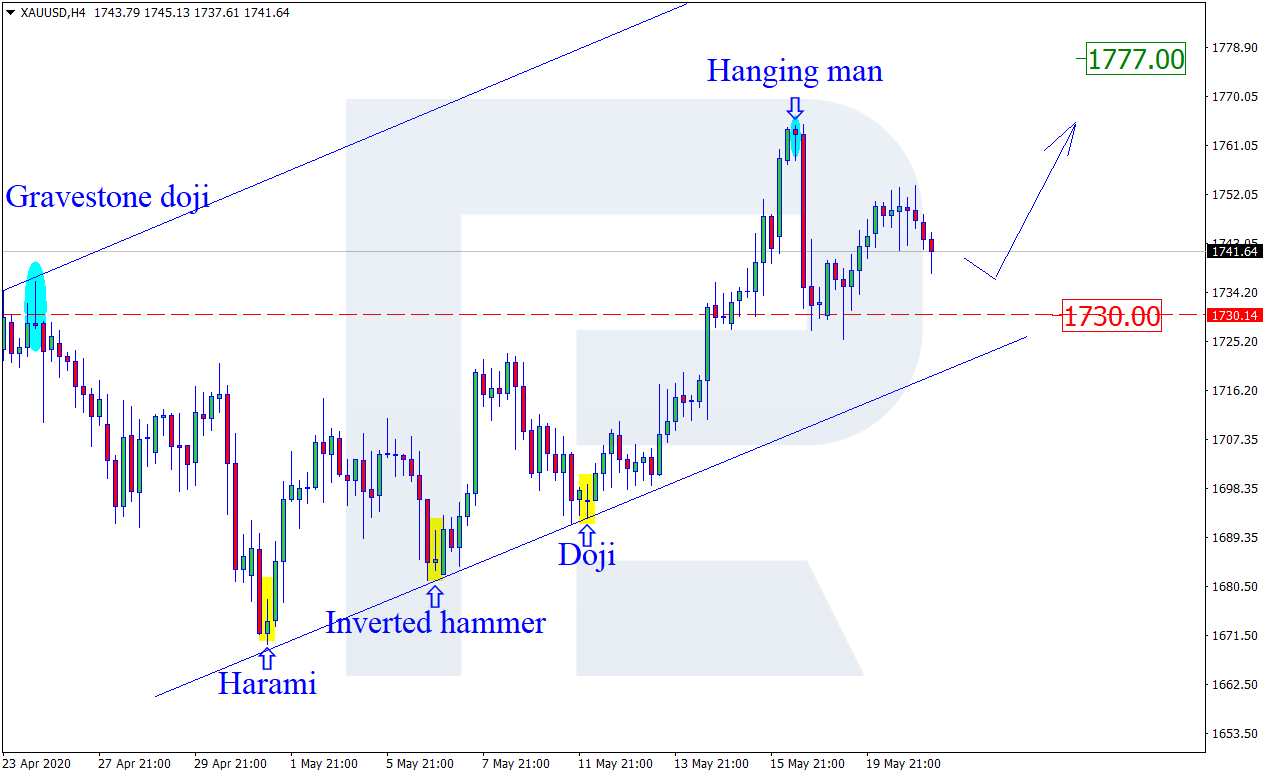
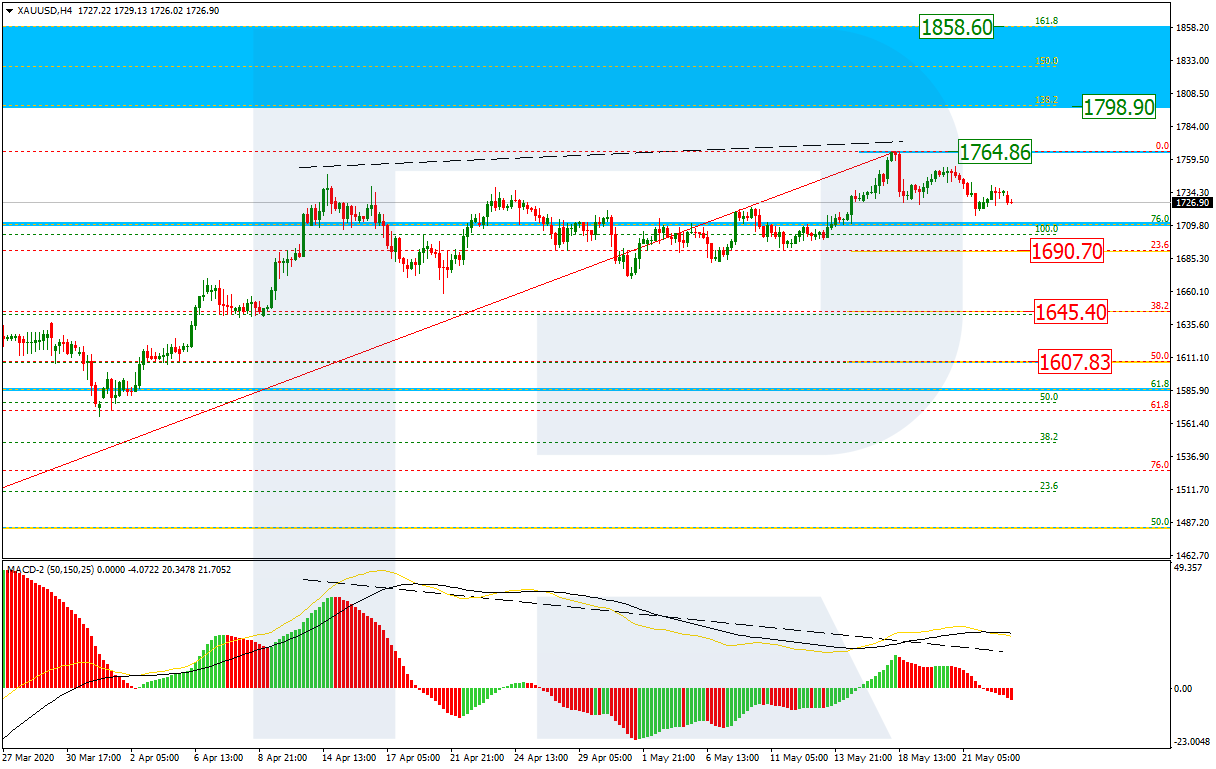
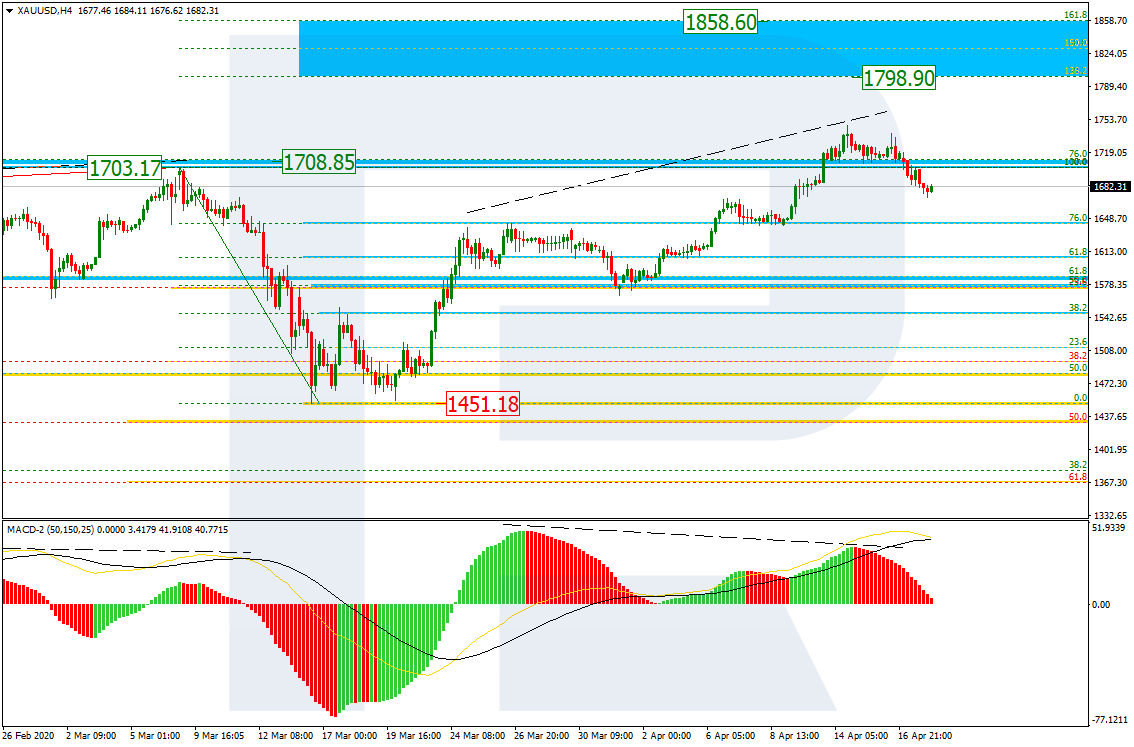
XAUUSD, “Gold vs US Dollar”
As we can see in the H4 chart, after updating its previous high, the ascending wave has reached 76.0% fibo. XAUUSD might have continued its growth to reach the post-correctional extension area between 138.2% and 161.8% fibo at 1798.90 and 1858.60 respectively, but there was a divergence on MACD to indicate a тку pullback to the downside. The support remains at the low at 1451.18.
Read more - Fibonacci Retracements Analysis GOLD, USDCHF