Re: Forex Technical Analysis & Forecast by RoboForex
Ichimoku Cloud Analysis 07.08.2020 (XAUUSD, USDZAR, GBPUSD)
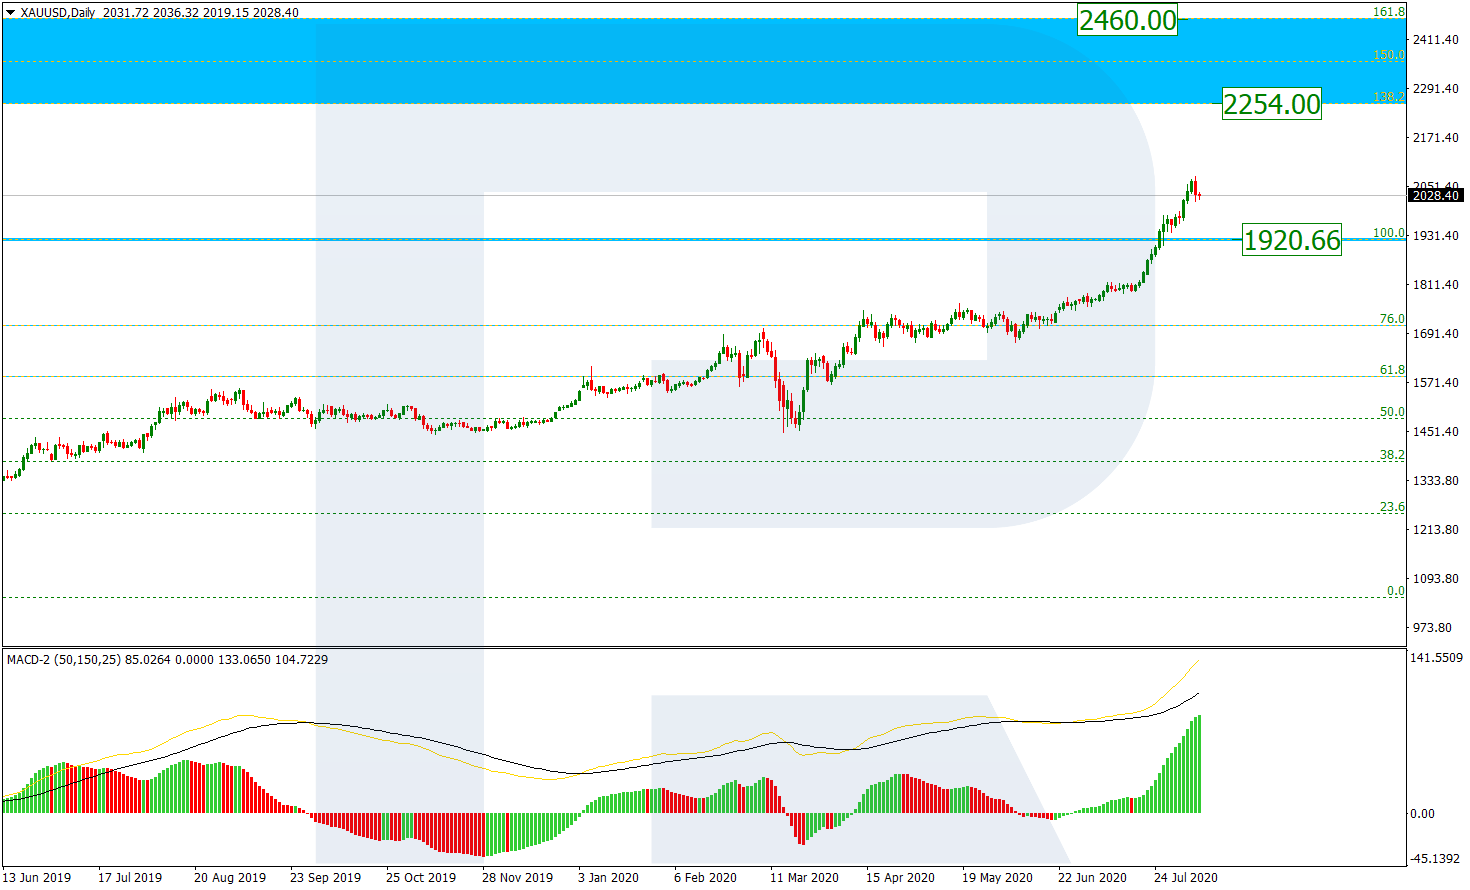
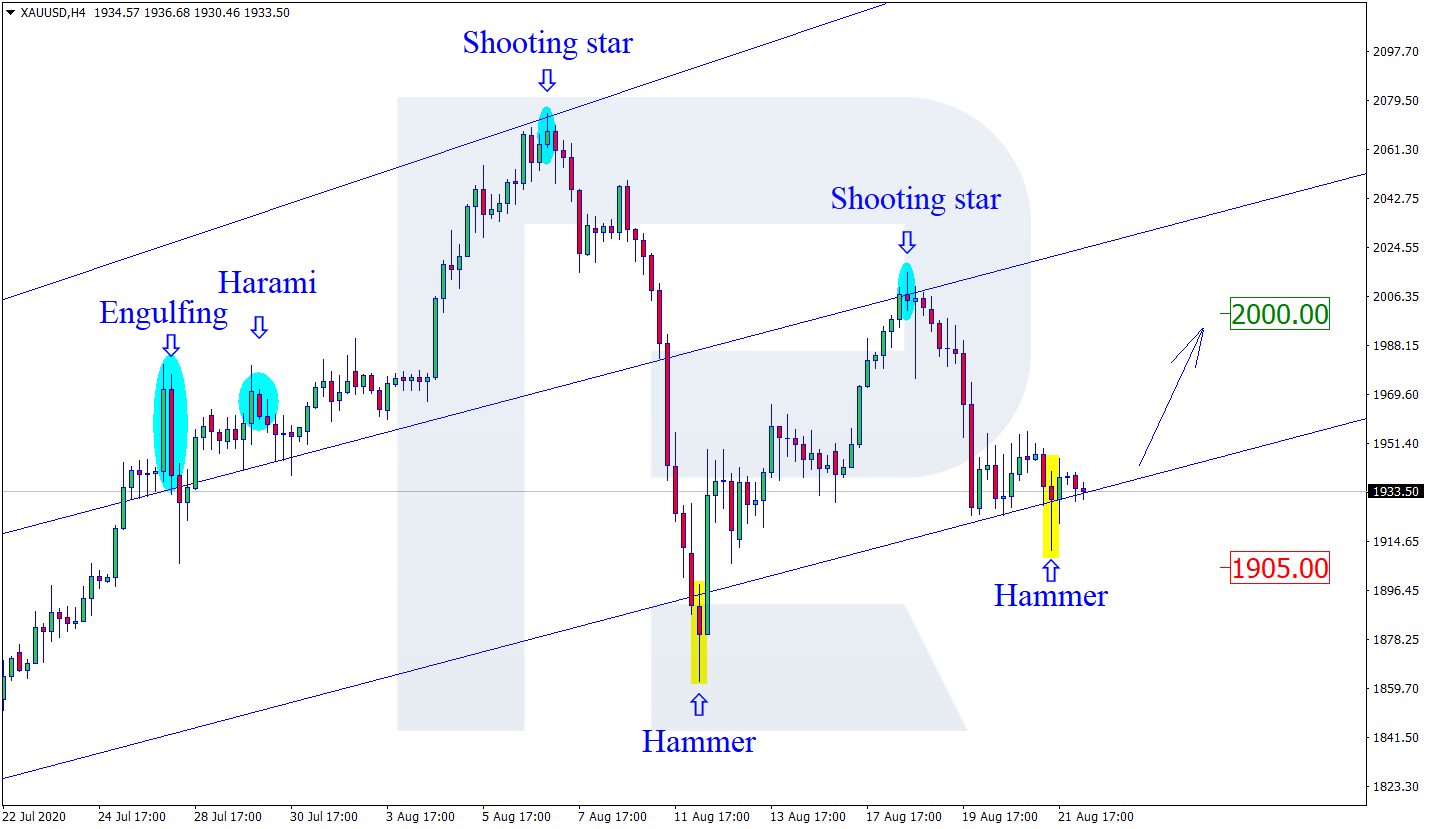
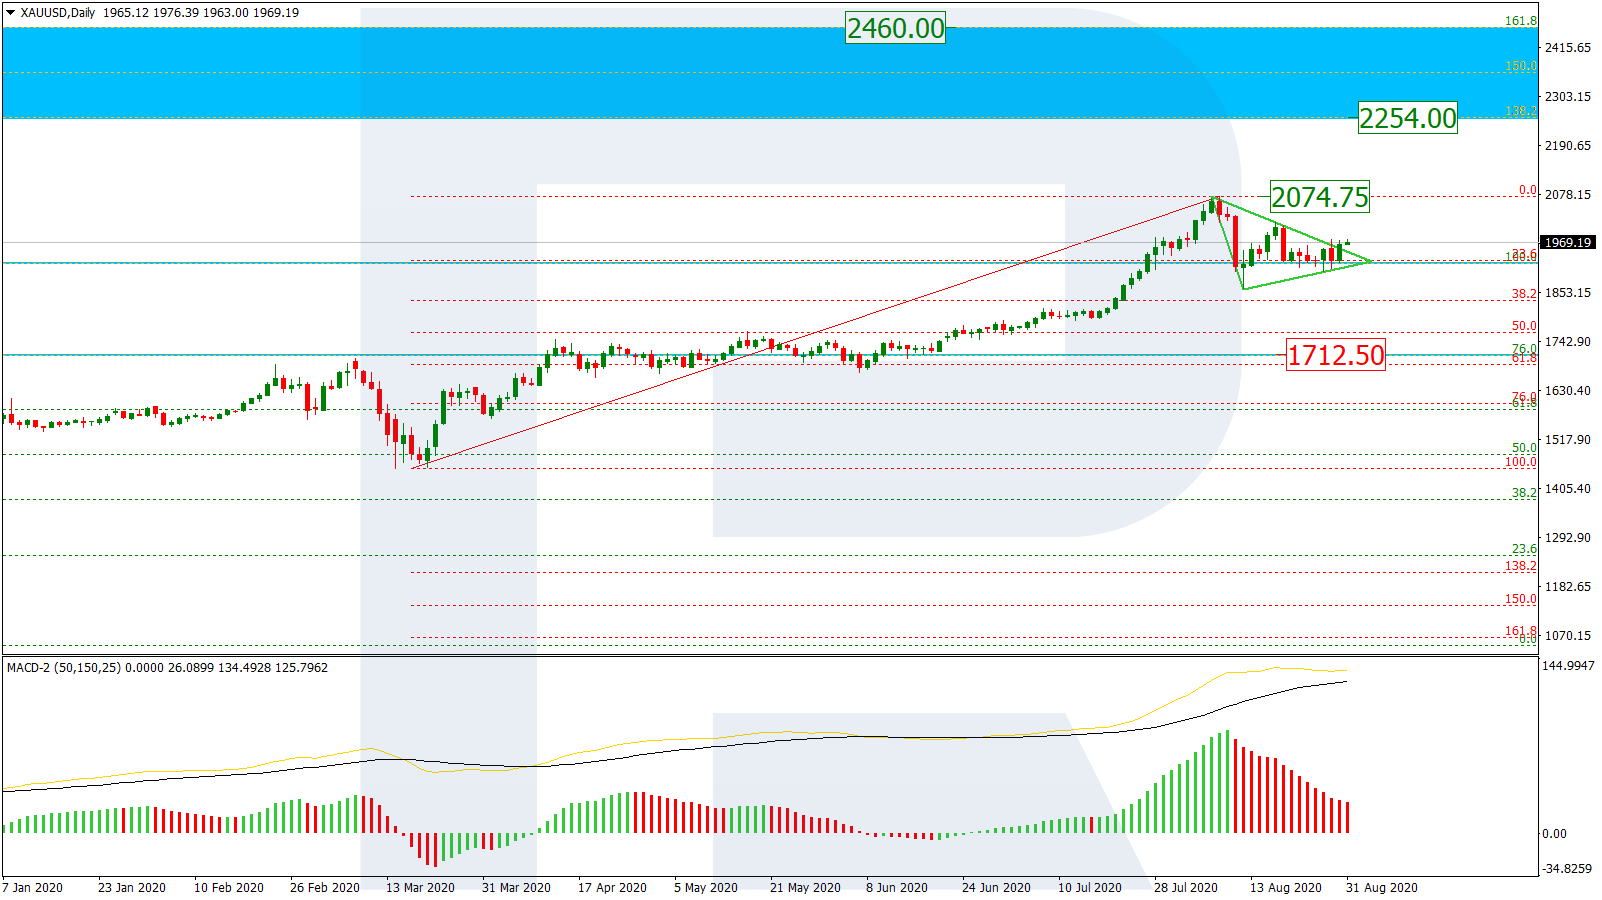
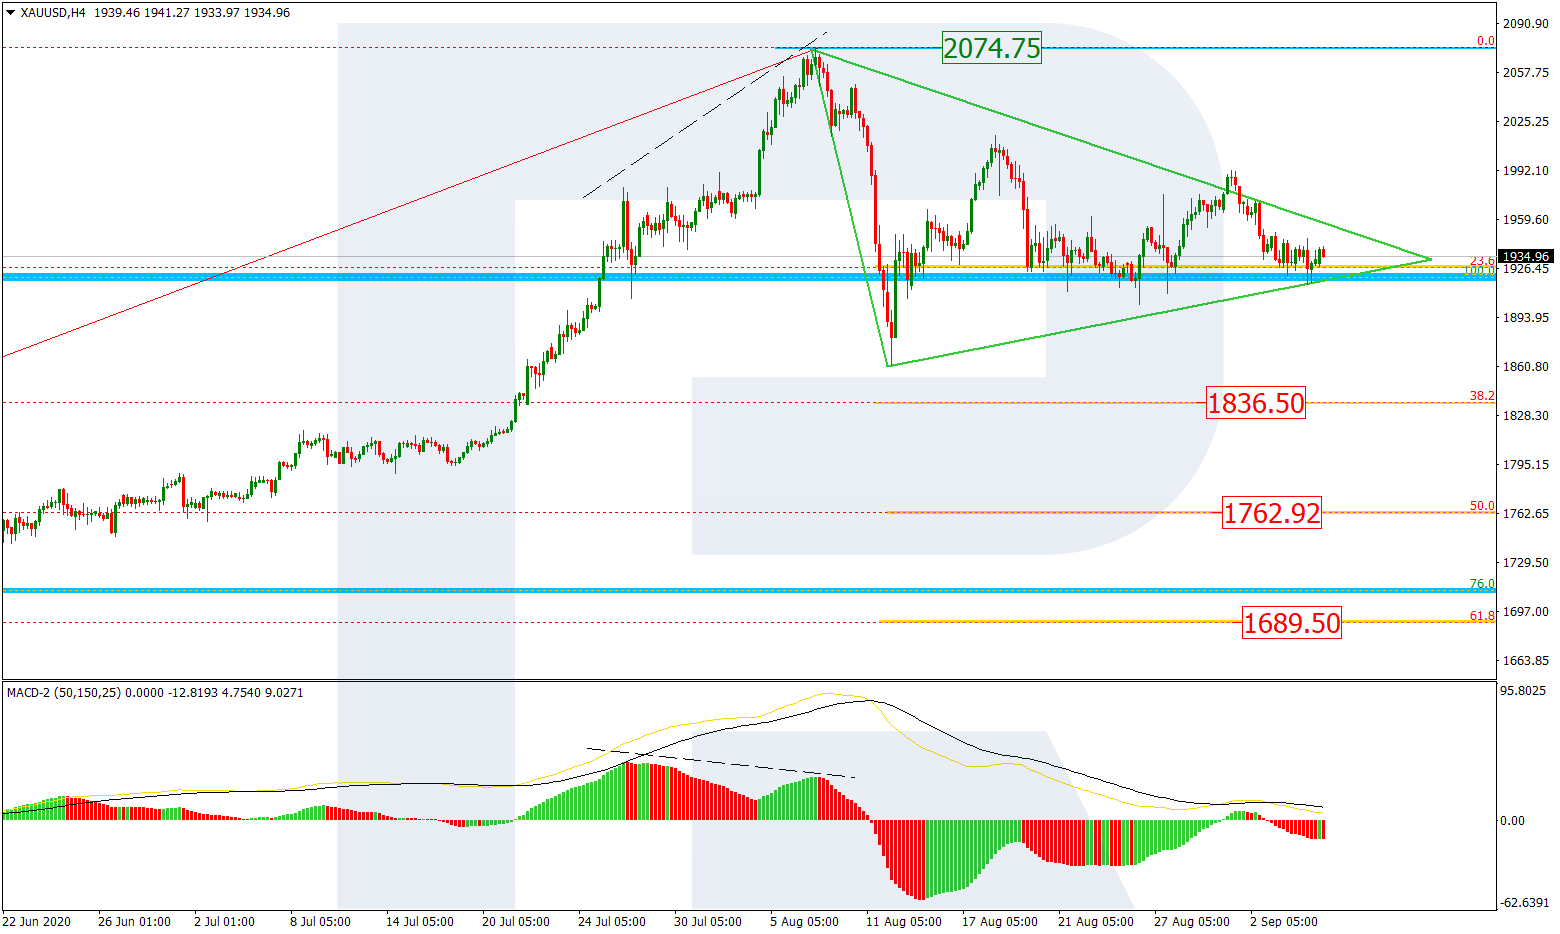
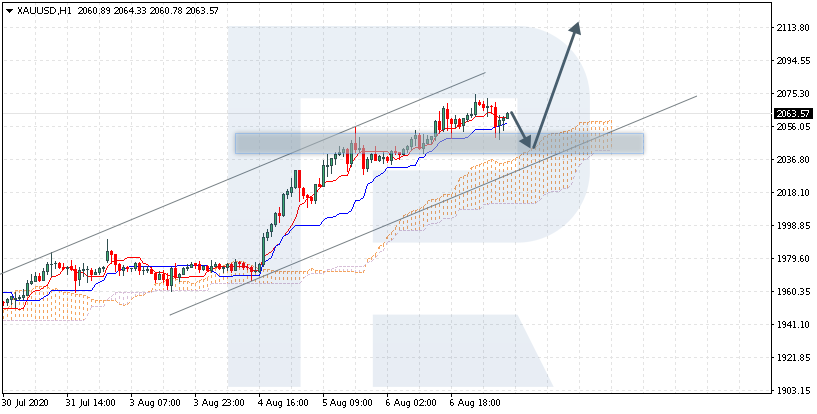
XAUUSD, “Gold vs US Dollar”
XAUUSD is trading at 2063.00; the instrument is moving above Ichimoku Cloud, thus indicating an ascending tendency. The markets could indicate that the price may test the cloud’s upside border at 2050.00 and then resume moving upwards to reach 2115.00. Another signal in favor of further uptrend will be a rebound from the support level. However, the bullish scenario may no longer be valid if the price breaks the cloud’s downside border and fixes below 1995.00. In this case, the pair may continue falling towards 1945.00.
Read more - Ichimoku Cloud Analysis XAUUSD, USDZAR, GBPUSD