forex software

Create and Test Forex Strategies

forex software

Skip to forum content

Forex Software

Create and Test Forex Strategies

You are not logged in. Please login or register.


(Page 38 of 65)

Forex Software → Market Analysis → Technical Analysis by FXOpen

Pages Previous 1 36 37 38 39 40 65 Next

You must login or register to post a reply

RSS topic feed

Posts: 926 to 950 of 1,624

Re: Technical Analysis by FXOpen

EUR/USD Gains Bullish Momentum While USD/CHF Eyes Recovery
https://i.postimg.cc/g0pPdbjX/eur.png

EUR/USD started a major increase above the 1.0800 resistance. USD/CHF is rising and might aim more gains above the 0.9220 resistance.

Important Takeaways for EUR/USD and USD/CHF

  • The Euro started a fresh increase from the 1.0720 support against the US Dollar.

  • There is a key rising channel forming with support near 1.0830 on the hourly chart of EUR/USD.

  • USD/CHF started a fresh increase above the 0.9150 resistance zone.

  • There was a break above a major bearish trend line with resistance near 0.9175 on the hourly chart.

EUR/USD Technical Analysis

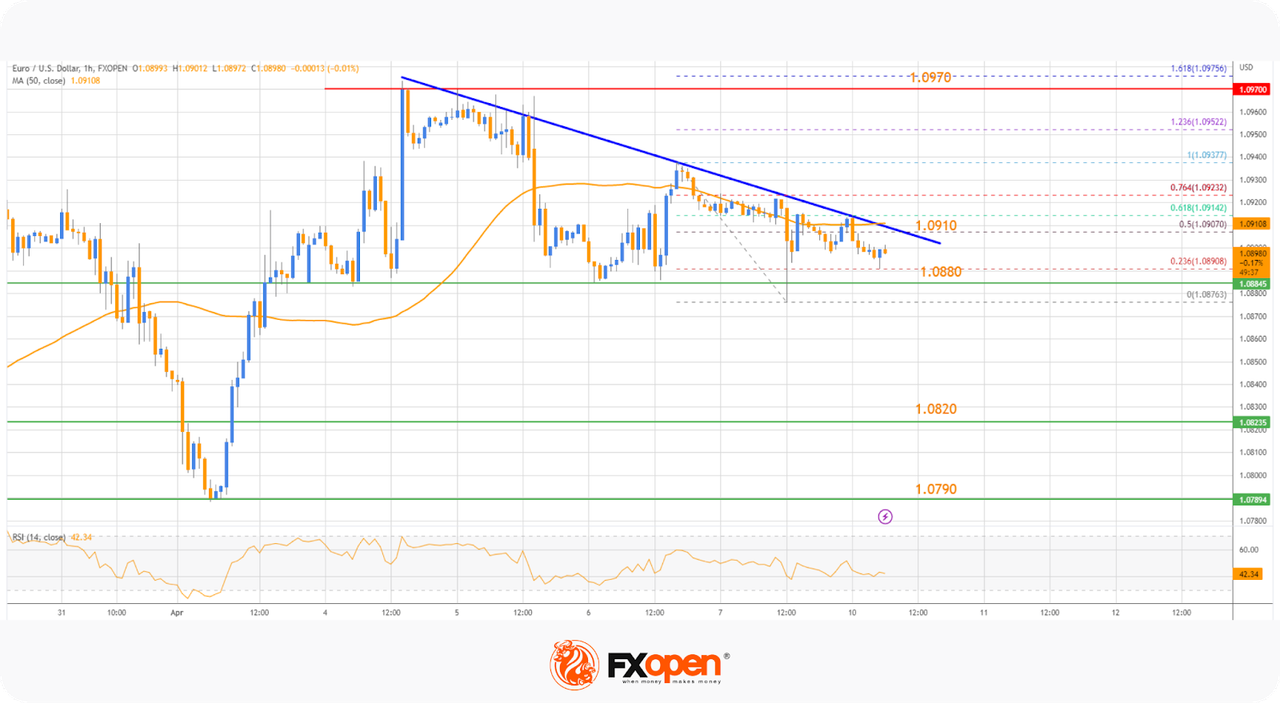
After a steady decline, the Euro found support near the 1.0720 zone against the US Dollar. The EUR/USD pair formed a base above the 1.0720 level and started a fresh increase.

There was a clear move above the 1.0750 and 1.0760 resistance levels. The pair was able to clear the 50% Fib retracement level of the downward move from the 1.0929 swing high to 1.0713 low (formed on FXOpen). It is now trading above the 1.0800 level and the 50 hourly simple moving average.

EUR/USD Hourly Chart
https://i.postimg.cc/2ShfPSkN/eurx.jpg

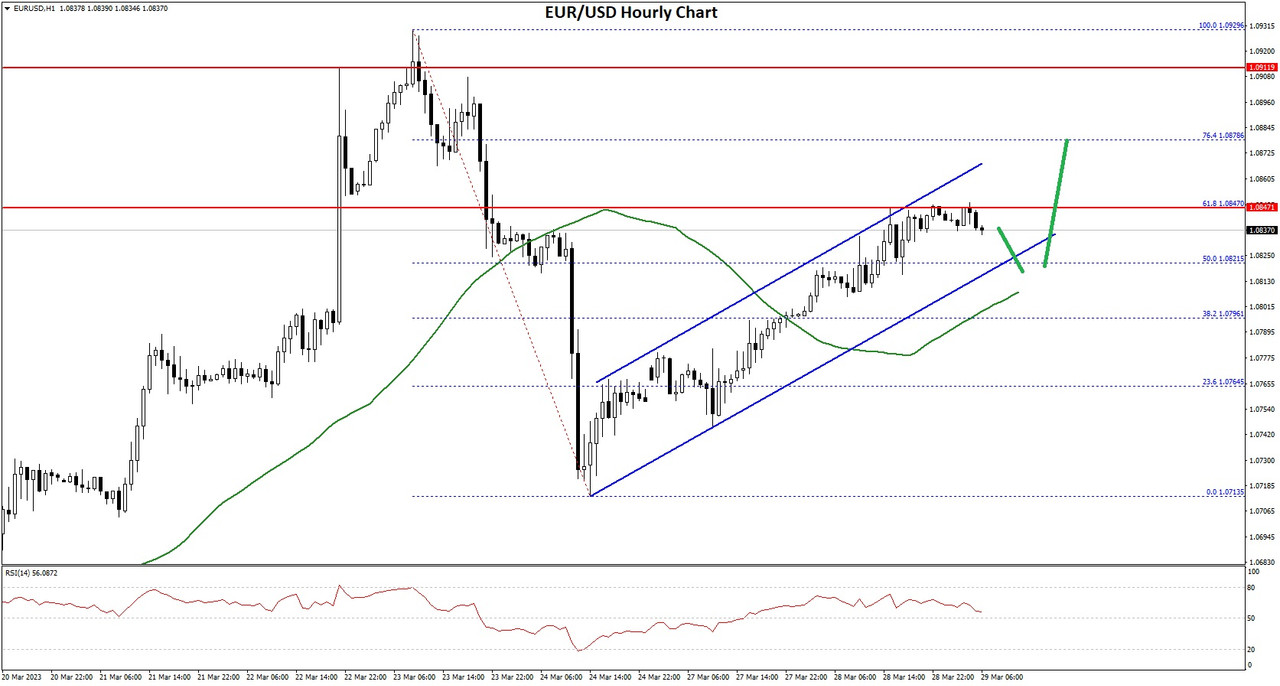
An immediate resistance is near the 1.0850 level. It is near the 61.8% Fib retracement level of the downward move from the 1.0929 swing high to 1.0713 low.

The next major resistance is near the 1.0880 level. A clear move above the 1.0880 resistance zone could send the pair further higher towards 1.0920. Any more gains might open the doors for a move towards the 1.1000 level.

If there is no move above 1.0850 recovery, the pair might start a fresh decline. On the downside, an immediate support is near the 1.0830 level. There is also a key rising channel forming with support near 1.0830 on the hourly chart of EUR/USD.

The next major support is near the 1.0800 level. A downside break below the 1.0800 support could start steady decline towards the 1.0750 level.

VIEW FULL ANALYSIS VISIT - FXOpen Blog...

Disclaimer: This Forecast represents FXOpen Companies opinion only, it should not be construed as an offer, invitation or recommendation in respect to FXOpen Companies products and services or as Financial Advice.

Re: Technical Analysis by FXOpen

ETHUSD and LTCUSD Technical Analysis – 30th MAR, 2023
https://i.postimg.cc/P52NrJjP/eth.png

ETHUSD: Bullish HARAMI Pattern Above $1687

Ethereum was unable to sustain its bearish momentum, and after touching a low of $1687 on 27th Mar, the prices started to correct upwards against the US dollar touching a high of $1829 today in the Asian trading session.

We have seen a bullish opening of the markets this week.

The price of Ethereum is ranging near a new record high of 1 month.

We can clearly see a bullish Harami pattern above the $1687 handle which is a bullish pattern and signifies the end of a bearish phase and the start of a bullish phase in the markets.

ETH is now trading just above its pivot level of 1798 and is moving into a mildly bullish channel. The price of ETHUSD is now testing its classic resistance level of 1803 and Fibonacci resistance level of 1806 after which the path towards 1850 will get cleared.

We can see the formation of both bullish Harami and bullish Harami cross patterns in the 2-hour time frame.

The relative strength index is at 53.40 indicating a strong demand for Ether and the continuation of the buying pressure in the markets.

Both the STOCH and STOCHRSI are giving a neutral signal, which means that the prices are expected to enter into a consolidation phase in the short-term range.

Some of the technical indicators are giving a buy market signal.

Most of the moving averages are giving a buy signal at the current market levels of $1800.

ETH is now trading above both the 200 hourly simple and 200 hourly exponential moving averages.

  • Ether: bullish reversal seen above the $1687 mark.

  • The short-term range appears to be mildly bullish.

  • ETH continues to remain above the $1750 level.

  • The average true range is indicating high market volatility.

Ether: Bullish Reversal Seen Above $1687
https://i.postimg.cc/mrkkc4LV/etx.png

ETHUSD is now testing to cross the $1900 levels and the current momentum suggests that we are now moving towards the $1850 level.

We can see the formation of bullish engulfing lines in the weekly time frame.

The price is back over the pivot point in the weekly time frame indicating bullish trends.

We can see the formation of moving average bullish crossover patterns MA20 and MA50 in the 4-hourly time frame.

We have also seen an upside gap in the 15-minute timeframe which indicates the bullish nature of the markets.

ETHUSD touched an intraday high of 1829 and an intraday low of 1774 in the Asian trading session today.

The key support levels to watch are $1744, at which the price crosses the 9-day moving average stalls, and $1769 at which the price crosses the 9-day moving average.

ETH has decreased by 0.92% with a price change of 16.80$ in the past 24hrs and has a trading volume of 9.457 billion USD.

We can see a decrease of 6.37% in the total trading volume in the last 24 hrs which appears to be normal.

The Week Ahead

ETH is facing stiff resistance at crossing the $1850 handle after which the next visible targets are located at $1900 and $1950.

We can see the formation of a major bullish trend line with the support located at $1679 at which the price crosses the 18-day moving average.

We can see the formation of a bullish ascending channel from $1687 towards the $1852 level.

The immediate short-term outlook for Ether has turned mildly bullish, the medium-term outlook has turned bullish, and the long-term outlook for Ether is neutral under present market conditions.

The resistance zone is located at $1830 which is a pivot point 1st resistance point and at $1913 which is a 38.2% retracement from a 52-week low.

The weekly outlook is projected at $1950 with a consolidation zone of $1900.

VIEW FULL ANALYSIS VISIT - FXOpen Blog...

Disclaimer: This Forecast represents FXOpen Companies opinion only, it should not be construed as an offer, invitation or recommendation in respect to FXOpen Companies products and services or as Financial Advice.

Re: Technical Analysis by FXOpen

AUD/USD and NZD/USD Could Gain Bullish Momentum
https://i.postimg.cc/8PHcbdBG/aud.png

AUD/USD started a fresh increase above the 0.6700 resistance zone. NZD/USD is rising and might aim a move above the 0.6300 resistance.

Important Takeaways for AUD/USD and NZD/USD

  • The Aussie Dollar started a fresh increase above the 0.6700 resistance against the US Dollar.

  • There was a break above a major bearish trend line with resistance near 0.6692 on the hourly chart of AUD/USD.

  • NZD/USD started a decent increase above the 0.6250 resistance zone.

  • There was a clear move above a key bearish trend line with resistance near 0.6265 on the hourly chart of NZD/USD.

AUD/USD Technical Analysis

The Aussie Dollar found support near 0.6620 and started a decent increase against the US Dollar. The AUD/USD pair gained pace for a move above the 0.6650 resistance.

The pair even moved above the 0.6685 level and the 50 hourly simple moving average. There was a break above a major bearish trend line with resistance near 0.6692 on the hourly chart of AUD/USD. The bulls were able to pump the pair above 0.6720 and the 50 hourly simple moving average.

AUD/USD Hourly Chart
https://i.postimg.cc/4NZnt2cw/audx.jpg

A high is formed near 0.6737 on FXOpen and the pair is now consolidating gains. On the downside, an initial support is near the 0.6720 level. It is near the 23.6% Fib retracement level of the recent increase from the 0.6661 swing low to 0.6737 high.

The next support could be the 0.6700 level or the 50 hourly simple moving average or the 50% Fib retracement level of the recent increase from the 0.6661 swing low to 0.6737 high.

If there is a downside break below the 0.6700 support, the pair could extend its decline towards the 0.6650 level. On the upside, the AUD/USD pair is facing resistance near the 0.6740 level. The next major resistance is near the 0.6780 level.

A close above the 0.6780 level could start another steady increase in the near term. The next major resistance could be 0.6850.

VIEW FULL ANALYSIS VISIT - FXOpen Blog...

Disclaimer: This Forecast represents FXOpen Companies opinion only, it should not be construed as an offer, invitation or recommendation in respect to FXOpen Companies products and services or as Financial Advice.

Re: Technical Analysis by FXOpen

Watch FXOpen's March 27 - 31 Weekly Market Wrap Video

In this video, FXOpen UK COO Gary Thomson sums up the week’s happenings and discusses the most significant news reports.

  • UK inflation: Is the end in sight?

  • Nasdaq storms psychological level near highs of the year

  • Rapid oil recovery

  • How Bitcoin reacted to the CFTC lawsuit against Binance

Watch our short and informative video, and stay updated with FXOpen.

https://i.postimg.cc/W3HZbsyz/img-009.jpg


FXOpen YouTube


Disclaimer: This forecast represents FXOpen Companies opinion only, it should not be construed as an offer, invitation or recommendation in respect to FXOpen Companies products and services or as financial advice.

#fxopen #fxopenyoutube #fxopenuk #weeklyvideo

Re: Technical Analysis by FXOpen

GBP/USD And GBP/JPY Aims More Upsides
https://i.postimg.cc/cHJG9mjL/gbp.png

GBP/USD climbed higher above the 1.2200 resistance zone. GBP/JPY could rise further if there is a clear move above the 165.70 resistance.

Important Takeaways for GBP/USD and GBP/JPY

  • The British Pound is moving higher above 1.2300 against the US Dollar.

  • There was a break above a major bearish trend line with resistance near 1.2180 on the daily chart of GBP/USD.

  • GBP/JPY is showing a lot of bullish signs above the 162.50 support.

  • There was a break above a key contracting triangle with resistance near 162.65 on the daily chart.

GBP/USD Technical Analysis

This past week, the British Pound formed a base above the 1.1800 zone against the US Dollar. The GBP/USD pair started a steady increase above the 1.2000 resistance zone.

There was a clear move above the 1.2120 resistance zone and the 50-day simple moving average. The pair even climbed above the 1.2200 resistance. There was a was a break above a major bearish trend line with resistance near 1.2180 on the daily chart of GBP/USD.

GBP/USD Daily Chart
https://i.postimg.cc/8CNSWDmW/gbpx.jpg

The pair even broke the 1.2350 level. A high is formed near 1.2420 on FXOpen and the pair is now consolidating gains.

An immediate support is near the 1.2180. It is near the 38.2% Fib retracement level of the upward move from the 1.1802 swing low to 1.2418 high.  The next major support is near the 1.2120 and 1.2100 levels.

The 50% Fib retracement level of the upward move from the 1.1802 swing low to 1.2418 high is also near the 1.2100 zone. If there is a break below the 1.2100 support, the pair could test the 1.2000 support.

Any more losses might send GBP/USD towards 1.1920. An immediate resistance on the upside is near the 1.2440 level. The next major resistance is near the 1.2500 level, above which the pair could start a steady increase towards 1.2750.

An upside break above 1.2750 might start a fresh increase towards 1.2800. Any more gains might call for a move towards 1.2880 or even 1.2950.

VIEW FULL ANALYSIS VISIT - FXOpen Blog...

Disclaimer: This Forecast represents FXOpen Companies opinion only, it should not be construed as an offer, invitation or recommendation in respect to FXOpen Companies products and services or as Financial Advice.

Re: Technical Analysis by FXOpen

ANZ Bank does away with cash; Australian Dollar responds with volatility
https://i.postimg.cc/Gmz5H0pM/aud.png

There are those who look forward to the day when the entire society in which they live goes completely cashless, and there are those who regard such a possibility with absolute dread.

Many nations with developed and advanced financial markets ecosystems are now heading toward the next stage in the implementation of a fully digital ecosystem, and in a lot of cases, their respective governments and central issuers of fiat currency are talking about the implementation of what is known as CDBCs, an acronym that stands for Central Bank Digital Currencies.

Central Bank Digital Currencies are effectively digital versions of existing sovereign currency, and many nations in Europe, North America, and South East Asia are looking at developing them and rolling them out. Australia is one such nation.

Whilst the rollout of such CDBCs has not taken place yet, there is more than a degree of speculation regarding the possibility of such a move being made by the Australian central bank, the Reserve Bank of Australia.

This speculation is being fueled by a recent move by ANZ Bank, one of Australia’s largest Tier 1 financial institutions and the country’s largest institutional and corporate bank.

At the end of last week, ANZ Bank announced that it would cease facilitating withdrawals and deposits from a number of its Australian branches on a permanent basis.

The bank advised that those wishing to access cash rather than use electronic transfers, debit/credit cards, or contactless systems should look toward using ATMs (automated cash machines), which are operated by ANZ Bank as well as independent operators and other banks across Australia, as ANZ’s customers will no longer be able to withdraw cash from their accounts inside branches.

Whilst this move means that ANZ Bank customers will still be able to withdraw and deposit cash via the ATM machines, the number of machines operated by banks across Australia, including ANZ, has been decreasing as they become decommissioned over recent years.

Whilst ANZ Bank’s move may well appear to be sensible and look toward a more efficient future in which most transactions are either carried out online, via a card payment, or contactless payment device rather than using physical cash, there is a seed of concern that has been sewn that this is a step toward the implementation of CDBCs and their perceived potentially authoritarian nature.

Groups which disapprove of the development by governments and central banks with regard to CDBC development believe that privacy could be diminished if all transactions are done digitally and that governments could use the digital nature of fiat currencies to ensure compliance with government agendas and doctrines by being able to ‘turn the money off’ if someone does not do as they are told.

Indeed, one of ANZ’s reasons for ceasing to offer cash in many of its branches is that the lockdowns enforced by the government throughout 2020 and 2021 in Australia, which was subject to one of the most strict lockdowns in the world, caused people to use much less physical cash and that ANZ is just moving with the times.

VIEW FULL ANALYSIS VISIT - FXOpen Blog...

Disclaimer: This Forecast represents FXOpen Companies opinion only, it should not be construed as an offer, invitation or recommendation in respect to FXOpen Companies products and services or as Financial Advice.

Re: Technical Analysis by FXOpen

BTCUSD and XRPUSD Technical Analysis – 04th APR 2023
https://i.postimg.cc/nrLp77GP/btc.png

BTCUSD – Hammer Pattern Is Above $26,529

Last week, the bearish momentum in Bitcoin price didn't sustain, and after touching the low of $26,529 on 27th March, the prices started to correct upwards against the US Dollar and touched the high of $29,171 on 30th March.

At the beginning of the week, Bitcoin is ranging near a NEW record 1-month high. We can clearly see a hammer pattern above $26,529, which signals a downtrend reversal.

Bitcoin touched an intraday low of $27,244 in the Asian trading session and an intraday high of $28,144 in the European trading session today.

The Williams percent range indicator is back over -50 in the daily timeframe, indicating a bullish trend.

Both the STOCH and STOCHRSI are reflecting overbought conditions, which means that in the immediate short term, a decline in the prices is expected.

The price is back over the pivot point in the daily timeframe, which stands for the bullish nature of the markets.

The relative strength index is near 53, which is a sign of a NEUTRAL demand for Bitcoin and a shift towards the consolidation phase in the markets.

Bitcoin is above a 200-hour simple moving average and above a 200-hour exponential moving average.

The average true range is indicating lower market volatility with a bullish momentum.

  • Bitcoin bullish reversal is seen above $26,529.

  • The RSI remains above 50, indicating a bullish market.

  • The price is now trading above its pivot level of $28,028.

  • Short-term range is moderate BULLISH.

  • Some major technical indicators signal that the price may move to $28,500 and $29,000 soon.

Bitcoin Bullish Reversal Seen Above $26,529
https://i.postimg.cc/4yFZ1d8N/btcx.png

The prices of Bitcoin have been successful in crossing the $29,000 resistance, and now we are looking for fresh upsides in the range of $30,000 and $32,000.

With the continued support seen at lower levels, we can see the formation of an ascending channel which may push the prices of Bitcoin above $30,000.

There is also a bullish crossover pattern with the 20-period and 50-period adaptive moving averages in the 4-hour timeframe.

A support zone is located at $26,547, where the price crosses the 18-day moving average, and at $27,144, which is the first support of the pivot point indicator.

BTCUSD is now facing its classic resistance level of $28,188 and Fibonacci resistance level of $28,286, breaking which the price will be able to move to $29,000.

There is an increase of 31.90% in the daily trading volume, which is normal. The short-term outlook for Bitcoin is bullish, the medium-term outlook has turned bullish, and the long-term outlook remains neutral under present market conditions.

The Week Ahead

We can see that Bitcoin has now resumed its long-term uptrend with the current support at $16,538 formed on 1st January 2023, which marked the end of the crypto winter.

Now the price of Bitcoin is ranging near the triangle's support in the 1-hour chart, reflecting bullish sentiment.

The immediate expected target is $30,000, after which we may see some consolidation in the zone of the $29,500 level.

Daily RSI is at 59.72, which indicates a NEUTRAL demand for Bitcoin and the shift towards the consolidation phase in the medium-term range.

We can see the formation of a bullish trendline from $26,529 to $28,771.

The BTCUSD is now facing resistance at $29,147, which is a 13-week high, and at $30,471, which corresponds to a 14-day RSI at 70.

VIEW FULL ANALYSIS VISIT - FXOpen Blog...

Disclaimer: This Forecast represents FXOpen Companies opinion only, it should not be construed as an offer, invitation or recommendation in respect to FXOpen Companies products and services or as Financial Advice.

Re: Technical Analysis by FXOpen

GBP soars against the Japanese Yen despite low rates remaining in place
https://i.postimg.cc/mZQLH8Tq/gbp.png

Japan's economy has been regarded ever since the 1960s as an absolute lesson in socio-economic advancement to the extent that the entire world views Japanese products, cuisine, intellect and culture among the most enviable globally.

One particular Japanese motor manufacturer has used the slogan "The relentless pursuit of perfection" in its marketing to Western customers, and Japan's contribution to science, technology and consumer lifestyle trappings has been enormous for over six decades now.

Japan is in the top 3 economies by nominal GDP, after the United States and China, and the fourth-largest economy by PPP (purchasing power parity). In 2020, Japan was ranked eighth among the countries with the largest labour force, having 66.5 million workers.

The Yen, Japan's sovereign currency, may have experienced a lot of volatility over recent times, and there is no doubt that it has faced competition from even larger nations such as China and India, which are rapidly becoming huge tours de force in their own right, China's economy being by very far the largest in the world, and neighbouring nations in the Asia Pacific region such as Thailand and South Korea being homes to some very high volume manufacturing of everything from televisions and kitchen appliances to motor vehicles.

Japan remains utterly focused on its core industries, and its export market is as buoyant as ever; however, there have been a lot of metrics that show lower capacity and a country that has struggled with high costs compared to that of its neighbours.

On April 5th, the central bank of Japan published data reflecting that the country's economic output was below full capacity for the 11th consecutive quarter from October to December 2022, so the BOJ will unlikely end its ultra-low interest rates policy.

The British Pound rose considerably against the Yen late last week in the advent of such figures, showing that investors and traders expected such an outcome.

This morning, the depreciation of the Yen against western majors, including the Pound, has slowed, and the Pound is trading at 164.10 to the Yen.

VIEW FULL ANALYSIS VISIT - FXOpen Blog...

Disclaimer: This Forecast represents FXOpen Companies opinion only, it should not be construed as an offer, invitation or recommendation in respect to FXOpen Companies products and services or as Financial Advice.

Re: Technical Analysis by FXOpen

ETHUSD Technical Analysis – 06th APR, 2023
https://i.postimg.cc/RZxYKMP7/eth.png

ETHUSD – Hammer Pattern Is Above $1,763
https://i.postimg.cc/jjsk3MYC/etx.png

Bears couldn’t keep control of the market, and after touching a low of $1,763 on 03rd April, the ETH/USD pair started to correct upwards, touching a high of $1,939 on 05th April.

ETHUSD is now moving under bearish pressure after touching a high of $1,939 on 05th April. The immediate bearish pressure suggests we will enter a consolidation phase above the $1,850 level.

A hammer pattern is above the $1,763 handle. It’s a bullish pattern, which signifies the end of a bearish phase. Also, we can see the formation of the morning star pattern.

The price is above the Ichimoku cloud, indicating a bullish nature of the market. Moreover, Ethereum is near the support of the channel.

The relative strength index is at 56.91, indicating a strong demand for Ether and a continuation of the buying pressure in the markets.

The average directional index and commodity channel index give a neutral signal, meaning that the price is expected to enter into a consolidation phase in the short-term range.

Some of the technical indicators are giving a bullish market signal. Most moving averages are giving a bullish signal at the current market level of $1,866.

ETH is now trading above the 200-hour simple and 200-hour exponential moving averages.

  • Ether bullish reversal is seen above the $1,763 mark.

  • The short-term range is expected to be mildly bullish.

  • The average true range indicates high market volatility.

VIEW FULL ANALYSIS VISIT - FXOpen Blog...

Disclaimer: This Forecast represents FXOpen Companies opinion only, it should not be construed as an offer, invitation or recommendation in respect to FXOpen Companies products and services or as Financial Advice.

Re: Technical Analysis by FXOpen

LTCUSD Technical Analysis – 06th APR, 2023
https://i.postimg.cc/brWw3GGN/ltc.png

LTCUSD – Bullish Harami Pattern Is Above $86.64
https://i.postimg.cc/CMQ5F2vT/ltx.png

Bears couldn't pull the market further down last week, and after touching a low of $86.64 on 30th March, the prices started to correct upwards against the US Dollar, touching a high of $94.91 on 03rd April.

We have seen a bullish opening of the markets this week.

We can see a bullish harami pattern above the $86.64 handle. It signifies the end of a bearish phase and the start of a bullish phase in the market.

The price of Litecoin is near the channel's support, indicating upcoming bullish movement. Also, Litecoin is trading above its 100-hour simple moving average and 100-hour exponential moving average, and it's above the pivot level of $92.93.

The relative strength index is at $52.50, indicating a neutral demand for Litecoin and a shift towards the market consolidation phase.

The prices of Litecoin continue to remain above some of the moving averages, which are giving a bullish signal at current market levels of $90.65

Both the Williams percent range and commodity channel index are signalling neutral market conditions, which means that the price is expected to remain in a consolidation phase in the short-term range.

The short-term outlook for Litecoin has turned mildly bullish.

  • Some of the technical indicators are giving a bullish signal.

  • Litecoin bullish reversal is seen above the $86.64 level.

  • The RSI gives a neutral signal.

  • The average true range indicates low market volatility.

VIEW FULL ANALYSIS VISIT - FXOpen Blog...

Disclaimer: This Forecast represents FXOpen Companies opinion only, it should not be construed as an offer, invitation or recommendation in respect to FXOpen Companies products and services or as Financial Advice.

Re: Technical Analysis by FXOpen

GBP/USD And GBP/JPY Could Aim for Another Increase
https://i.postimg.cc/mrg3jYkM/gbp.png

GBP/USD started a downside correction from the 1.2520 resistance zone. GBP/JPY is rising and might aim for more upsides above the 164.00 resistance.

Important Takeaways for GBP/USD and GBP/JPY

  • The British Pound failed to break above the 1.2520 resistance and corrected lower against the US Dollar.

  • There is a key bearish trend line forming with resistance near 1.2460 on the hourly chart of GBP/USD.

  • GBP/JPY is slowly moving higher from the 163.00 zone.

  • There is a key rising channel forming with support near 163.75 on the hourly chart.

GBP/USD Technical Analysis
https://i.postimg.cc/sx75xKHF/gbpx.png

This past week, the British Pound formed a base above the 1.2400 line against the US Dollar. The GBP/USD pair started a steady increase above the 1.2425 resistance.

There was a move above the 50-hour simple moving average at 1.2460. It resulted in a break above the 1.2500 level. However, the bears were active near the 1.2520 resistance zone. A high was formed near 1.2525, and the pair started a downside correction.

There was a break below the 23.6% Fib retracement level of the upward move from the 1.2274 swing low to the 1.2525 high. GBP/USD even settled below the 50-hour simple moving average.

The previous resistance at 1.2425 is now acting as a support. The next major support is near the 1.2400 level, which coincides with the 50% Fib retracement level of the upward move from the 1.2274 swing low to the 1.2525 high.

If there is a break below the 1.2400 support, the pair will substantially decline. In the stated case, there is a risk of a drop toward the 1.2330 level or the 1.2274 low in the coming days.

Conversely, the pair might attempt a fresh increase from the 1.2425 support. Resistance on the upside is near the 50-hour simple moving average at 1.2455. There is also a key bearish trend line forming with resistance near 1.2460 on the hourly chart of GBP/USD.

A close above the trend line resistance could stage a fresh increase. The hourly RSI is also moving higher and approaching 50, above which it might signal a decent increase. The next major resistance is near the 1.2500 level, above which the pair could revisit the 1.2520 resistance region. Any more gains might call for a move toward 1.2600.

VIEW FULL ANALYSIS VISIT - FXOpen Blog...

Disclaimer: This Forecast represents FXOpen Companies opinion only, it should not be construed as an offer, invitation or recommendation in respect to FXOpen Companies products and services or as Financial Advice.

Re: Technical Analysis by FXOpen

EUR/USD Aims Fresh Increase While EUR/JPY Eyes More Upsides
https://i.postimg.cc/Kjw5M1nw/eur.png

EUR/USD is consolidating above the key 1.0880 support zone. EUR/JPY is rising and might rally further if it clears the 145.40 resistance zone.

Important Takeaways for EUR/USD and EUR/JPY

  • The Euro started a downside correction from the 1.0970 zone.

  • There is a key bearish trend line forming with resistance near 1.0910 on the hourly chart at FXOpen.

  • EUR/JPY started a steady increase after it found support near 142.50.

  • There is a major bullish trend line forming with support near 144.20 on the hourly chart.

EUR/USD Technical Analysis
https://i.postimg.cc/L6gDMVSp/eurx.png

On the hourly chart of EUR/USD, the Euro remained well-bid above the 1.0880 zone and started a fresh increase against the US Dollar. EUR/USD was able to break above the 1.0920 resistance level.

The pair tested the 1.0970 zone before it started a correction. There was a break below the 1.0920 level, but the bulls were active near the key 1.0880 support. A low is formed at 1.0876, and the pair is now consolidating.

Immediate resistance is near the 1.0910 level. Besides, there is a key bearish trendline forming with resistance near 1.0910. The trendline is close to the 50% Fib retracement level of the downward move from the 1.0937 swing high to the 1.0876 low.

The next major resistance is near the 76.4% Fib retracement level at 1.0925. A clear move above the 1.0925 level might send the pair toward the 1.0970 level. Any more gains could set the pace for a test of 1.1000.

On the downside, the pair might find support near the 1.0880 level. The next major support sits near the 1.0820 level, below which the pair could even test the 1.0790 support zone.

If there is a downside break below the 1.0790 support, the pair might accelerate lower in the coming days. In the stated case, it could even test 1.0720.

VIEW FULL ANALYSIS VISIT - FXOpen Blog...

Disclaimer: This Forecast represents FXOpen Companies opinion only, it should not be construed as an offer, invitation or recommendation in respect to FXOpen Companies products and services or as Financial Advice.

Re: Technical Analysis by FXOpen

Tech stocks are back in vogue as a sudden rally grabs the attention
https://i.postimg.cc/SsmWj6FK/001.png

For almost two years, there has been tremendous volatility within stocks of technology companies – mostly those with headquarters in Silicon Valley – which are listed on the NASDAQ exchange in New York and included in the S&P 500 index, which tracks the performance of America’s best performing 500 publicly listed companies.

Since 2021, technology stocks have been suffering, and during the course of last year, a consistent downturn in value was recorded, much to the surprise of many, who considered internet-based e-commerce giants and online firms to have been relatively resilient to the effects of the lockdowns which took place across many Western countries during 2020 and 2021 as the world went online.

Perhaps it would have been more likely that stocks in traditional companies which produce physical products or require quantities of raw materials delivered to factories in order to manufacture which was greatly restricted during those times, and workforces that were not allowed into workplaces in order to produce and deliver items to paying customers or outlets would have suffered more.

Yes, Amazon and Google rocketed in value during the early to the middle part of 2020 while airline and hospitality firms listed on more traditional European exchanges such as London Stock Exchange fell, but that was short-lived.

The tech stock downturn that took place last year was surprising and long-lasting.

Now, however, things are back on track, and there appears to have been something of a rally.

Over the past 30 days, the S&P 500 index has risen from 3,861 to 4,090, with NASDAQ-listed tech stocks contributing to that in droves.

VIEW FULL ANALYSIS VISIT - FXOpen Blog...

Disclaimer: This Forecast represents FXOpen Companies opinion only, it should not be construed as an offer, invitation or recommendation in respect to FXOpen Companies products and services or as Financial Advice.

Re: Technical Analysis by FXOpen

USDJPY: Are Bulls Trying to Revive the Long-Term Trend?
https://i.postimg.cc/wjrk0fyR/002.png

The USDJPY yesterday reached its highs of several weeks.

This was facilitated by:

→ a statement by the new head of the Bank of Japan, Kazuo Ueda, who made it clear that there is no need to rush to curtail the stimulus policy;

→ Friday's US employment report, which strengthened expectations of the Fed's interest rate hike in May. Unemployment fell to 3.5%, indicating the strength of the labour market. Trading on Tuesday, futures on the dollar index opened with a bullish gap;

→ US commercial bank deposits rose towards the end of March for the first time in about a month, a sign that the banking crisis is easing and the dollar is regaining confidence.

VIEW FULL ANALYSIS VISIT - FXOpen Blog...

Disclaimer: This Forecast represents FXOpen Companies opinion only, it should not be construed as an offer, invitation or recommendation in respect to FXOpen Companies products and services or as Financial Advice.

Re: Technical Analysis by FXOpen

BTCUSD Technical Analysis – 11th APR 2023
https://i.postimg.cc/Qx1BRfyW/003.png

Bitcoin continues its bullish momentum from last week, and after touching a low of $27,717 on April 6, we can see a bull run, which managed to push the prices of BTCUSD above the $30,000 handle today in the early European trading session.

The resistance of the channel is broken in the daily timeframe, indicating the strength of the bulls.

We can clearly see a hammer pattern above the $27,717 handle.

Bitcoin continues to move in a range-bound motion between the $29,800 and $30,200 levels, which is indicative of a consolidation phase in the markets.

Both the STOCH and Williams Percent Range indicate overbought levels, which means that in the immediate short term, a decline in the price is expected.

The relative strength index is at 74.02, indicating a strong demand for Bitcoin and the continuation of the buying pressure in the markets.

Bitcoin is now moving above its 100-hour simple moving average and above its 200-hour exponential moving average.

Most of the major technical indicators are giving a bullish signal, which means that in the immediate short term, we are expecting targets of $31,000 and $32,500.

The average true range indicates low market volatility with strong bullish momentum.

https://i.postimg.cc/kgCV9W0Y/004.png

  • Bitcoin bullish continuation is seen above $27,717.

  • The RSI remains above 50, indicating a bullish market.

  • The price is now trading above its pivot level of $30,088.

  • The short-term range is strongly bullish.

  • Some major technical indicators signal that the price may move to $30,500 and $31,000 soon.

VIEW FULL ANALYSIS VISIT - FXOpen Blog...

Disclaimer: This Forecast represents FXOpen Companies opinion only, it should not be construed as an offer, invitation or recommendation in respect to FXOpen Companies products and services or as Financial Advice.

Re: Technical Analysis by FXOpen

XRPUSD Technical Analysis – 11th APR 2023
https://i.postimg.cc/hPbDssny/005.png

Last week, the market sentiment turned bullish after Ripple touched a low of $0.4915 on April 6 and started to correct. The market opened bullish this week.

On the hourly chart:

    The relative strength index is at 60.40, which signifies a strong demand for Ripple at the current market prices and the continuation of the bullish phase in the market.
    Moving averages signal an upward price movement at the current market level of 0.5203.
    Both the STOCH and CCI are in the neutral zones, which means the price is now resting in the consolidation zone.
    Ripple is now trading just below its pivot level of 0.5209 and is now facing its classic resistance at 0.5221 and Fibonacci resistance at 0.5241, after which it will be able to move towards 0.6000.

https://i.postimg.cc/8zp10vP1/006.png

Some of the major technical indicators are bullish.

  • Ripple bullish reversal is seen above 0.4915.

  • The price is below its pivot level.

  • Average true range indicates HIGH volatility.

We have also detected a bullish price crossover with 20 and 50-period moving averages in the weekly timeframe.

VIEW FULL ANALYSIS VISIT - FXOpen Blog...

Disclaimer: This Forecast represents FXOpen Companies opinion only, it should not be construed as an offer, invitation or recommendation in respect to FXOpen Companies products and services or as Financial Advice.

Re: Technical Analysis by FXOpen

GBP/USD Starts Fresh Increase While EUR/GBP Eyes Upside Break
https://i.postimg.cc/dQpsnbFY/gbp.jpg

GBP/USD started a fresh increase above the 1.2400 resistance zone. EUR/GBP is struggling and facing resistance near 0.8790.

Important Takeaways for GBP/USD and EUR/GBP

  • The British Pound started a fresh increase above the 1.2400 barrier against the US Dollar.

  • There was a break above a key bearish trendline with resistance near 1.2410 on the hourly chart of GBP/USD.

  • EUR/GBP is struggling to break the 0.8790 resistance zone.

  • There is a major bullish trendline forming with support near 0.8770 on the EUR/GBP hourly chart.

GBP/USD Technical Analysis
https://i.postimg.cc/zvW9xPwz/gbpx.png

This past week, the British Pound saw a downside correction below the 1.2400 support against the US Dollar. The GBP/USD pair tested the 1.2345 zone before the bulls took a stand.

On the hourly chart at FXOpen, a low was formed near 1.2344, and the pair started a fresh increase. There was a clear move above the 1.2400 resistance zone. More importantly, there was a break above a key bearish trendline with resistance near 1.2410.

The pair traded at 1.2456 and settled above the 50-hour simple moving average. There was a minor downside correction below the 23.6% Fib retracement level of the upward move from the 1.2027 swing low to the 1.2205 high.

However, the pair remained well-bid above the 50% Fib retracement level at 1.2400.

If there is a downside break below the 1.2400 support, there is a risk of a sharp decline. In the stated case, GBP/USD may revisit the 1.2355 support. Any more losses could lead the pair toward 1.2300.

On the upside, resistance is near the 1.2355 level, above which the pair might resume its increase (considering the RSI is above 50). The next major resistance is near the 1.2520 level. A clear move above 1.2520 could trigger a rally toward 1.2600.

VIEW FULL ANALYSIS VISIT - FXOpen Blog...

Disclaimer: This Forecast represents FXOpen Companies opinion only, it should not be construed as an offer, invitation or recommendation in respect to FXOpen Companies products and services or as Financial Advice.

Re: Technical Analysis by FXOpen

British Pound remarkably remains the best performing G10 currency in 2023
https://i.postimg.cc/FFkc14YJ/gbp.png

The end of last year was a very depressing time for those whose everyday currency is the British Pound.

During the last few months of 2022, the world’s most valuable currency slid and slid in value, causing analysts and investors alike to begin to turn their back on the Pound as the economy in Britain continued to suffer from double-figure inflation and other holdbacks such as the effect of Brexit and the legacy of the lockdowns which took place in 2020 and 2021, whereas the American economy continued to recover from its high inflation, with the US Dollar performing well throughout last year and inflation down to just over 6% by December.

Nowadays, things are somewhat different.

Whilst the United States economy continues to remain steady, and inflation is now under control to the extent that the Federal Reserve has begun to discuss the possibility of not making any further increases to interest rates for the foreseeable future after a long period of rate hikes, the British economy remains dogged by Brexit-related trade issues, double-figure inflation and a now two-year-long cost of living crisis.

Despite these having been among the same factors which caused the Pound to depreciate so much over a long period last year, there is some interesting and perhaps surprising data surrounding the British Pound this week, in that it is the best performing G10 currency of 2023.

It’s almost as if absolutely nothing has changed with regard to the challenges faced by the British public and the national economy, yet the sovereign currency has experienced a turnaround in its directionб representing a total change in fortune.

Whilst more than a degree of caution is being exercised by analysts within the financial markets industry with regard to the Pound, it has risen by a healthy 3% against the US Dollar since the beginning of 2023.

VIEW FULL ANALYSIS VISIT - FXOpen Blog...

Disclaimer: This Forecast represents FXOpen Companies opinion only, it should not be construed as an offer, invitation or recommendation in respect to FXOpen Companies products and services or as Financial Advice.

Re: Technical Analysis by FXOpen

On the Nature Of Breakdown of the Psychological $30K Level
https://i.postimg.cc/bYx389PK/btc.png

On Tuesday, the price of Bitcoin exceeded $30,000 per coin for the first time since June 2022. The news has become a trend in the media and social networks, community members express opinions that in the future the price of BTC will reach $50,000 and 100,000. How optimistic is the $30,000 breakout?


Judging by its nature (1), buyers are unsure as the length of the candles decreases while the price rises above the psychological level – quite unlike the more aggressive nature of the bullish breakout (2) of the $25k level.

In this regard, the role of resistance levels increases:

3→ is built on the height of the range $26,800-29,000;

4→ is built as the border of the ascending channel.

By the ability to stay on the achieved heights against the backdrop of today's session full of important news, it will be possible to judge the true strength of the bulls.

VIEW FULL ANALYSIS VISIT - FXOpen Blog...

Disclaimer: This Forecast represents FXOpen Companies opinion only, it should not be construed as an offer, invitation or recommendation in respect to FXOpen Companies products and services or as Financial Advice.

Re: Technical Analysis by FXOpen

EURHUF: Central European currencies gaining interest
https://i.postimg.cc/VvJ7z3F1/huf.png

For those who have travelled to some of the former Eastern Bloc nations within Central and Eastern Europe, many will have noticed a key difference between these fully functioning free market economies and their neighbours within the European Union: Abstinence from adopting the Euro.

Whilst nations such as Poland, Hungary, Czech Republic and Bulgaria have been members of the European Union since the 2000s, none of them have adopted a single currency and have instead maintained their own national sovereign currencies.

In recent years, nations such as Hungary have been regarded as home to economies which are relatively small and in which the national currency is of low value compared to majors such as the Euro, which dominates in business across the continent and when transacting with other continental trading partners such as North America or Japan.

For sure, Hungarian export and import data within the European Parliament will be worked out in Euro, not in the local Forint, and the American and Japanese partners of European trade suppliers look at everything in Dollars and Euros, not Dollars, Euros and Forint.

However, the Forint has been making something of a headway recently.

Whilst the Euro and US Dollar have been relatively steady, and in the case of the Dollar, there has been a strong performance for a long time despite economic challenges and geopolitical woes across the Western world, the Hungarian Forint has been increasing in value quite dramatically.

Ever since October last year, the Forint has been gaining ground on the Euro. In October 2022, the Forint was valued at around 432 to the Euro, whereas today, it is trading at 375 to the Euro.

That is a remarkable movement, and one which is very rarely seen among majors unless there is a massive global disaster, which is even rarer, thankfully.

Looking at the Forint’s performance against the Euro over the past 5 days denotes another interesting pattern which is punctuated by volatility. Such levels of volatility are the lifeblood of the currency markets and have been lacking among majors for a long time.

VIEW FULL ANALYSIS VISIT - FXOpen Blog...

Disclaimer: This Forecast represents FXOpen Companies opinion only, it should not be construed as an offer, invitation or recommendation in respect to FXOpen Companies products and services or as Financial Advice.

Re: Technical Analysis by FXOpen

USDCAD Is Approaching an Important Support Level
https://i.postimg.cc/G3N87HH9/usdcad.png

A short digest of the fresh and saturated news background:

→ Inflation in the US coincided with analysts' expectations. Core CPI was 5.6% in annual terms. The main problem for suppressing inflation is the rise in prices for energy resources (oil has updated the maximum of the year). According to Bloomberg, the union of Russia and Saudi Arabia in the oil market can create problems in this regard.

→ Minutes of the Fed meeting showed that officials expect a mild recession.

→ The ECB believes that inflation has become more extensive in Europe, but the lion's share of increases is already behind.

→ The Bank of Canada left the rate unchanged at 4.5%, expecting a fall in inflation, but is ready for further increases if necessary.

Reacting to the above and other important news, the US dollar index fell to the lows of the year on the foreign exchange market. Accordingly, the euro, pound and Canadian dollar strengthened. The latter forms a pattern that attracts attention.

On the USDCAD chart, we can observe a narrowing triangle (1-2), indicating the balance of supply and demand. The breakdown of the (3) triangle in March turned out to be false. By its behaviour, the market suggests that the true exit from the triangle will take place in a bearish direction. And this could be the beginning of a long-term downtrend.

VIEW FULL ANALYSIS VISIT - FXOpen Blog...

Disclaimer: This Forecast represents FXOpen Companies opinion only, it should not be construed as an offer, invitation or recommendation in respect to FXOpen Companies products and services or as Financial Advice.

Re: Technical Analysis by FXOpen

ETHUSD Technical Analysis on April 13, 2023

The Morning Star Pattern Is Above $1,824
https://i.postimg.cc/htPhtCbY/eth.png

Bears couldn’t keep control of the market, and ETH/USD started to correct upwards after touching a low of $1,763 on 9 April.

ETHUSD is now moving under a strong bullish momentum after crossing the $2,000 resistance and may touch $2,100 and $2,200 levels.

The morning star pattern is above the $1,824 handle on the H1 timeframe. It’s a bullish pattern, which signifies the end of a bearish phase.

The relative strength index is at 78.57, indicating a strong demand for Ether and a continuation of the buying pressure in the markets.

The STOCHRSI and Williams’s percent range give an overbought signal, meaning that the price is expected to decline in the short-term range.

Most of the technical indicators are bullish. Most moving averages are bullish.

ETH is now trading above the 100-hour simple and 200-hour exponential moving averages.

  • Ether bullish reversal is seen above the $1,824 mark.

  • The short-term range is expected to be strongly bullish.

  • The average true range indicates low market volatility.

https://i.postimg.cc/vZqTgW0Z/etx.png

VIEW FULL ANALYSIS VISIT - FXOpen Blog...

Disclaimer: This Forecast represents FXOpen Companies opinion only, it should not be construed as an offer, invitation or recommendation in respect to FXOpen Companies products and services or as Financial Advice.

Re: Technical Analysis by FXOpen

LTCUSD Technical Analysis on April 13, 2023
https://i.postimg.cc/BZ138sgv/ltc.png

Tweezer Bottom Pattern Is Above $89.15

Bears couldn't pull the market further down last week, and after touching a low of $89.15 on 9 April, LTC started to correct upwards against the US Dollar, touching a high of $96.85 on 11 April.

There is a tweezer bottom pattern above the $89.15 handle on the H1 timeframe. It signifies the end of a bearish phase and the start of a bullish phase in the market.

The price of Litecoin is near the channel's support, indicating upcoming bullish movement. Also, Litecoin is trading above its 100-hour simple moving average and 200-hour exponential moving average, and it's above the pivot level of $93.76.

The relative strength index is at 67.54, reflecting a very strong demand for Litecoin and the continuation of the buying pressure in the markets.

Litecoin remains above all moving averages, so the market is still bullish at the current market level of $94.23.

Both Williams’s percent range and STOCHRSI are signalling overbought market conditions, which means that the price is expected to decline in the short-term range.

The short-term outlook for Litecoin has turned as strongly bullish.

  • Technical indicators are bullish.

  • Litecoin bullish reversal is seen above the $89.15 level.

  • The average true range indicates low market volatility.

https://i.postimg.cc/8PQSM3Km/ltx.png

VIEW FULL ANALYSIS VISIT - FXOpen Blog...

Disclaimer: This Forecast represents FXOpen Companies opinion only, it should not be construed as an offer, invitation or recommendation in respect to FXOpen Companies products and services or as Financial Advice.

Re: Technical Analysis by FXOpen

ETHUSD Rose by 10% in a Day on the Background of Shanghai Upgrade
https://i.postimg.cc/V6gmfvpg/eth.png

Shanghai, an important upgrade to the Ethereum blockchain, has been a success. Against the backdrop of the news, the ETHUSD rate rose by 10% per day, breaking the psychological level of $2,000. As of Friday morning, ETH is trading above $2,100, something that has not happened since May 2022. Since the beginning of the year, ETHUSD has risen in price by about 77% (for comparison, Bitcoin, by about 86%).

https://i.postimg.cc/zvPNhMJR/etx.png

In the long run, the Shanghai (also known as Shapella) upgrade has the advantage of providing more freedom to invest. But in the short term, a collapse in the value of ETH could occur, as investors got the opportunity to withdraw funds from staking. According to on-chain metrics, after the update, more than 1 million ETH tokens were requested for withdrawal. “[This] is much lower than what was previously expected,” Matt Maximo, an analyst with Grayscale, told CNBC.

The growth of the ETHUSD rate was also facilitated by the lower US dollar index — it fell to the lows of the current year after the release of March producer price index on Thursday, which showed signs of weakening inflation.

On the daily chart of ETHUSD, there was a bullish breakout (1) of the upper boundary of the rising channel that was active in 2023 – which suggests that the market is overbought, and a technical pullback with a breakout test of the $2k psychological level will be a likely scenario.

VIEW FULL ANALYSIS VISIT - FXOpen Blog...

Disclaimer: This Forecast represents FXOpen Companies opinion only, it should not be construed as an offer, invitation or recommendation in respect to FXOpen Companies products and services or as Financial Advice.

Re: Technical Analysis by FXOpen

Gold Price Inches Higher While WTI Crude Oil Aims Fresh Increase
https://i.postimg.cc/bYTwxfDy/gold.png

Gold price is rising and trading above the $2,030 resistance. WTI is consolidating and might aim for a fresh increase above $83.25.

Important Takeaways for Gold and Oil

  • Gold price started a fresh increase above the $2,020 resistance against the US Dollar.

  • A key bullish trend line is forming with support near $2,030 on the hourly chart of gold at FXOpen.

  • Crude oil price also gained pace and was able to climb above the $82.00 resistance.

  • There is a key contracting triangle forming with support near $82.00 on the hourly chart of XTI/USD at FXOpen.

Gold Price Technical Analysis
https://i.postimg.cc/L686vQLz/goldx.png

On the hourly chart of gold at FXOpen, the price formed a base above the $1,990 support zone against the US Dollar. The price started a decent increase and was able to clear the $2,000 resistance zone.

The upward move gained pace above the $2,020 and $2,030 resistance levels. Finally, the bears appeared near $2,050. A high is formed at $2,048, and the price is now consolidating gains.

Initial support on the downside is near the 23.6% Fib retracement level of the recent increase from the $2,001 swing low to the $2,048 high. The first major support is forming near a key bullish trend line at $2,030.

If there is a downside break below the trend line, the price might slide toward the 50-hour simple moving average at $2,025. The next major support is near the 61.8% Fib retracement level of the recent increase from the $2,001 swing low to the $2,048 high at $2,020.

On the upside, the bulls are facing resistance near $2,048. An upside break above the $2,048 resistance could send the price toward $2,060. Any more gains may perhaps set the pace for an increase toward the $2,080 level.

VIEW FULL ANALYSIS VISIT - FXOpen Blog...

Disclaimer: This Forecast represents FXOpen Companies opinion only, it should not be construed as an offer, invitation or recommendation in respect to FXOpen Companies products and services or as Financial Advice.

Posts: 926 to 950 of 1,624

Pages Previous 1 36 37 38 39 40 65 Next

You must login or register to post a reply

Forex Software → Market Analysis → Technical Analysis by FXOpen

Similar topics in this forum