forex software

Create and Test Forex Strategies

forex software

Skip to forum content

Forex Software

Create and Test Forex Strategies

You are not logged in. Please login or register.


(Page 37 of 65)

Forex Software → Market Analysis → Technical Analysis by FXOpen

Pages Previous 1 35 36 37 38 39 65 Next

You must login or register to post a reply

RSS topic feed

Posts: 901 to 925 of 1,624

901 (edited by Resolve 2023-03-09 16:59:18)

Re: Technical Analysis by FXOpen

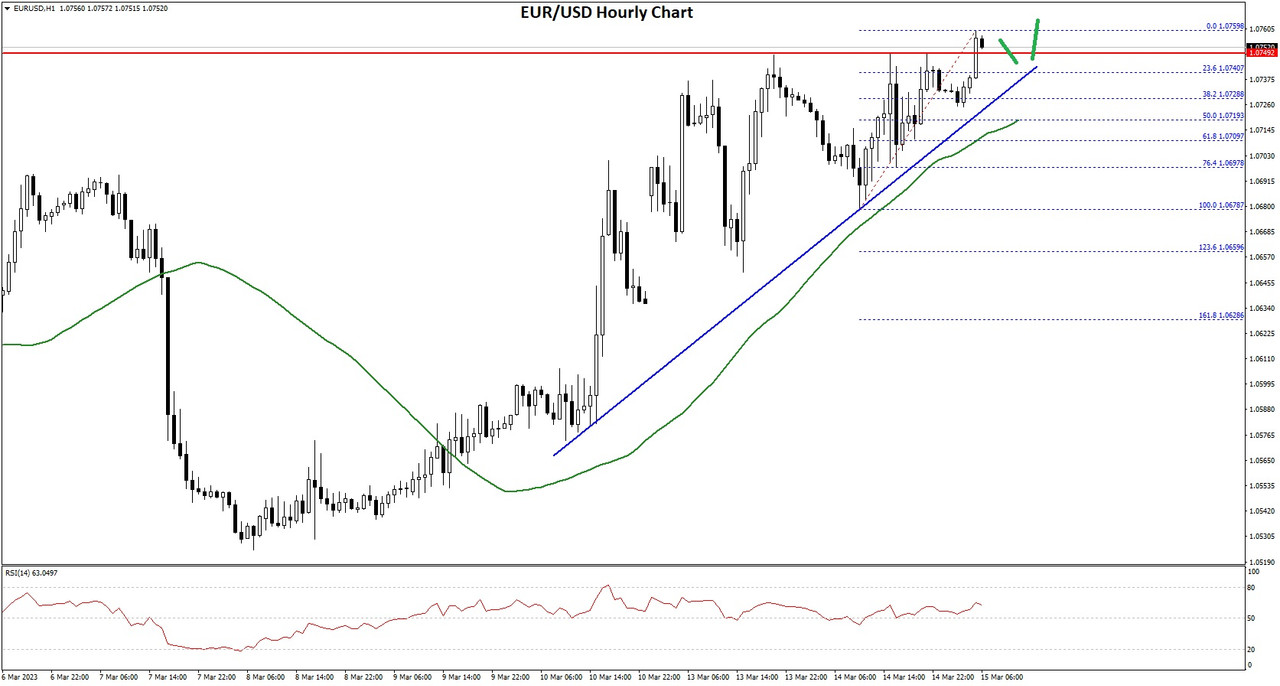
Euro hits one-month low against the US Dollar
https://i.postimg.cc/bvWbKmqt/img-09.png

It could be fair to say that the US Dollar, and the wider economy across the United States is an anomaly and has been for over a year.

Despite the same lockdowns in many major centers as other Western economies, the same supply chain difficulties disabling all sectors of industry to the same extent as that of Western Europe, and a similar approach toward involvement in geopolitical matters between the West and Russia, the American economy is not in anything like the bad condition experienced in other regions.

To compound this oddity further, the US Dollar has retained a very strong position against all other major currencies throughout the entirety of last year.

Yesterday, the US Dollar has shown its strength again, as the Euro has fallen to a one-month low against the greenback, with the rate now being at the low end of the 1.05 range during the early hours of the European trading session.

Some data released on Tuesday has put a dampener on the value of the Euro, one such metric being that retail sales within the Euro-denominated area, a good proxy for consumer demand, rebounded much less than expected in January, challenging other data, including PMI surveys, which pointed to a steady recovery.

Energy prices are continuing to soar across Europe, contributing massively to the overall increases in cost of living, which in some areas of Eastern Europe is compounded by inflation rates at over 25%, meaning that spending is outstripping earnings on a continual basis.

In Western Europe, the 10% average inflation is still a major barrier to economic stability and growth, whilst in the United States, the levels of inflation have been reducing over the past 6 months and are now at around 6%.

Manufacturing and productivity in the United States remained at least partially open during 2020 and 2021 with the states of Florida and Texas not conducting lockdowns. These are both heavily industrialised states and aside from their existing high technology, medical products, agricultural, energy production and scientific research sectors, attracted many other businesses from across the United States which relocated their offices to these states during 2021 and 2022.

This could be a contributor to the strength of the US dollar by comparison to the Euro, as the entire Eurozone limped in and out of lockdowns for almost 2 years and now the piper has to be paid.

Retail sales rose 0.3% on the month, below the 1% rise forecast by economists, and were down 2.3% year on year, demonstrating that this stagnation is continuing, and with more interest rate rises on the horizon, the belt is tight.

VIEW FULL ANALYSIS VISIT - FXOpen Blog...

Disclaimer: This Forecast represents FXOpen Companies opinion only, it should not be construed as an offer, invitation or recommendation in respect to FXOpen Companies products and services or as Financial Advice.

902 (edited by Resolve 2023-03-10 05:02:34)

Re: Technical Analysis by FXOpen

ETHUSD and LTCUSD Technical Analysis – 09th MAR, 2023
https://i.postimg.cc/zv4kfs2X/eth.png

ETHUSD: Bearish Engulfing Pattern Below $1677

Ethereum was unable to sustain its bullish momentum and after touching a high of $1677 on 02nd Mar, the price started to decline against the US dollar  trading below the $1550 handle today in the European trading session.

We have seen a bearish opening of the markets this week.

The price of ETHUSD is ranging near a new record low of 1 month.

We can clearly see a bearish engulfing pattern below the $1677 handle which is a bearish pattern and signifies the end of a bullish phase and the start of a bearish phase in the markets.

ETH is now trading just below its pivot levels of 1537 and moving in a mildly bearish channel. The price of ETHUSD is now testing its classic support level of 1530 and Fibonacci support level of 1536 after which the path towards 1500 will get cleared.

We can see the formation of a black hanging man in the 4-hour time frame indicating a neutral tone of the markets.

The relative strength index is at 40.95 indicating a weak demand for Ether and a shift towards the consolidation phase in the markets.

The commodity channel index, CCI, is giving an oversold signal, which means that the price is expected to correct upwards in the short-term range.

Most of the technical indicators are giving a sell market signal.

Most of the moving averages are giving a sell signal at the current market level of $1531.

ETH is now trading below both its 100 hourly simple and 100 hourly exponential moving averages.

  • Ether: bearish reversal seen below the $1677 mark.

  • The short-term range appears to be mildly bearish.

  • ETH continues to remain below the $1550 level.

  • The average true range is indicating less market volatility.

Ether: Bearish Reversal Seen Below $1677
https://i.postimg.cc/4xk5RThW/etx.png

ETHUSD continues to weaken and we can see a move towards the consolidation phase in the markets. Now the next visible targets are located at $1500 and $1450.

We can see the formation of the three black crows pattern in the 2-hour time frame indicating bearish trends.

The MACD crosses down its moving average in the 30-minute time frame indicating the bearish nature of the market.

ETHUSD touched an intraday high of 1552 in the Asian trading session and an intraday low of 1528 in the London trading session today.

The key support levels to watch are $1446 which is a 50% retracement from a 13 week high/low, and $1486 at which the price crosses 18-day moving average stalls.

ETH has decreased by 1.27% with a price change of 19.71$ in the past 24hrs and has a trading volume of 7.237 billion USD.

We can see a decrease of 0.87% in the total trading volume in the last 24 hrs which appears to be normal.

The Week Ahead

ETH was unable to cross the $1700 handle last week and now we are about to touch the $1500 level. If the demand for Ethereum increases we could witness a bounce in the levels next week.

We can see the formation of a bearish ascending channel from $1677 towards the $1522 level.

The immediate short-term outlook for Ether has turned mildly bearish, the medium-term outlook has turned bearish, and the long-term outlook for Ether is neutral in present market conditions.

The resistance zone is located at $1575 which is a 14-3 day raw stochastic at 20% and at $1586 which is a 14-day RSI at 50%.

The weekly outlook is projected at $1450 with a consolidation zone of $1500.

VIEW FULL ANALYSIS VISIT - FXOpen Blog...

Disclaimer: This Forecast represents FXOpen Companies opinion only, it should not be construed as an offer, invitation or recommendation in respect to FXOpen Companies products and services or as Financial Advice.

903 (edited by Resolve 2023-03-10 06:09:25)

Re: Technical Analysis by FXOpen

Gold Price Recovers While Crude Oil Price Declines Further
https://i.postimg.cc/1X12TJb8/gold.png

Gold price is attempting a recovery wave above the $1,820 resistance. Crude oil price is declining and remains at a risk of more losses below $75.

Important Takeaways for Gold and Oil

  • Gold price started a recovery wave above the $1,820 resistance against the US Dollar.

  • A key bearish trend line is forming with resistance near $1,832 on the hourly chart of gold.

  • Crude oil price started a fresh decline below the $80 support zone.

  • There is a major bearish trend line forming with resistance near $76.65 on the hourly chart of XTI/USD.

Gold Price Technical Analysis

Gold price formed a base above the $1,810 support zone against the US Dollar. The price started a decent increase and was able to clear the $1,820 resistance zone.

The bulls were able to push the price above the 38.2% Fib retracement level of the downward move from the $1,858 swing high to $1,809 low (formed on FXOpen). The price is now trading above the $1,820 level and the 50 hourly simple moving average.

Gold Price Hourly Chart
https://i.postimg.cc/9M7sJvg3/goldx.jpg

It is now facing resistance near the $1,835 zone. There is also a key bearish trend line is forming with resistance near $1,832 on the hourly chart of gold.

The trend line is near the 50% Fib retracement level of the downward move from the $1,858 swing high to $1,809 low. The next key hurdle is near the $1,840 level.

A clear upside break above the $1,840 resistance could send the price towards $1,850. If there is no upside break, the price might correct lower.

An immediate support on the downside is near the $1,820 level. The next major support is near the $1,810 level, below which there is a risk of a larger decline. In the stated case, the price could decline sharply towards the $1,800 support zone.

VIEW FULL ANALYSIS VISIT - FXOpen Blog...

Disclaimer: This Forecast represents FXOpen Companies opinion only, it should not be construed as an offer, invitation or recommendation in respect to FXOpen Companies products and services or as Financial Advice.

Re: Technical Analysis by FXOpen

Watch FXOpen's March 6 - 10 Weekly Market Wrap Video

In this video, FXOpen UK COO Gary Thomson sums up the week’s happenings and discusses the most significant news reports.

  • Swiss National Bank reports record losses

  • AAPL shares: Goldman Sachs puts Buy rating

  • Inflation top of the agenda as Euro slumps

  • Powell accelerates the bullish trend on the dollar index

Watch our short and informative video and stay updated with FXOpen.

https://i.postimg.cc/v898fRXs/week-009.jpg

FXOpen YouTube


Disclaimer: This forecast represents FXOpen Companies opinion only, it should not be construed as an offer, invitation or recommendation in respect to FXOpen Companies products and services or as financial advice.

#fxopen #fxopenyoutube #fxopenuk #weeklyvideo

905 (edited by Resolve 2023-03-13 12:00:34)

Re: Technical Analysis by FXOpen

GBP/USD Rallies While GBP/JPY Faces Key Resistance
https://i.postimg.cc/Gthy4ZZV/gbpx.png

GBP/USD climbed higher above the 1.1950 resistance zone. GBP/JPY could start a decent increase if there is a clear move above the 163.00 resistance.

Important Takeaways for GBP/USD and GBP/JPY

  • The British Pound is slowly moving higher above 1.2000 against the US Dollar.

  • There is a key bullish trend line forming with support near 1.2060 on the hourly chart of GBP/USD.

  • GBP/JPY is showing a lot of bullish signs above the 161.50 support.

  • There is a major trend line forming with resistance near 164.40 on the hourly chart.

GBP/USD Technical Analysis
https://i.postimg.cc/k4ySXnhW/gbp.png

This past week, the British Pound formed a base above the 1.1800 zone against the US Dollar. The GBP/USD pair started a steady increase above the 1.1880 resistance zone.

There was a clear move above the 1.1920 resistance zone and the 50 hourly simple moving average. The pair even climbed above the 1.2000 resistance. A high is formed near 1.2141 on FXOpen and the pair is now consolidating gains.

An immediate support is near the 1.2100. The next major support is near the 1.2060 level or the 23.6% Fib retracement level of the upward move from the 1.1802 swing low to 1.2141 high.

There is also a key bullish trend line forming with support near 1.2060 on the hourly chart of GBP/USD. If there is a break below the 1.2060 support, the pair could test the 1.1970 support. It is near the 50% Fib retracement level of the upward move from the 1.1802 swing low to 1.2141 high.

Any more losses might send GBP/USD towards 1.1900. An immediate resistance on the upside is near the 1.2140 level. The next major resistance is near the 1.2180 level, above which the pair could start a steady increase towards 1.2250.

An upside break above 1.2250 might start a fresh increase towards 1.2320. Any more gains might call for a move towards 1.2380 or even 1.2450.

VIEW FULL ANALYSIS VISIT - FXOpen Blog...

Disclaimer: This Forecast represents FXOpen Companies opinion only, it should not be construed as an offer, invitation or recommendation in respect to FXOpen Companies products and services or as Financial Advice.

906 (edited by Resolve 2023-03-13 13:01:53)

Re: Technical Analysis by FXOpen

AUD/USD: Where Will the Pair Be in 2023 and Beyond?
https://i.postimg.cc/cHQ6ZYcF/aud.png

The Australian dollar/US dollar pair is one of the major pairs traded worldwide. Since 2021, it has been moving in a downtrend. However, the reopening of China, the removal of China’s ban on Australian coal, and the potential weakness of the USD in 2023 allow analysts to make optimistic projections on the AUD/USD exchange rate. In this FXOpen guide, you will find forecasts on the AUD/USD rate and learn the reasons behind them.

AUD/USD: Price History 2021 - the Beginning of 2023

From March 2020 to February 2021, the AUD/USD pair was moving in an uptrend. However, the situation changed in May 2021 when a downtrend came into force as the US dollar was gaining momentum. The pair continues depreciating, and there are a few reasons for this.

The first reason is the problems with exports. It’s also vital to note that the strength of the Australian economy depends on exports. The country is a leader in producing and exporting various commodities, including iron ore, coal, lithium, gold, uranium, and bauxite. China is one of the major importers of Australian goods.

Due to the Covid-19 pandemic, China had to close the country, which affected its economic growth and curbed domestic steel production. A slowdown in its economic growth affected Australia’s economic development, too.

Another reason for the weakness of the Australian dollar was the strength of the US dollar. Despite the 2022 crisis, the US dollar was rising in value. Some analysts explain this by saying that the USD is a safe-haven asset that appreciates in periods of market turbulence. Others doubt the USD’s status as a refuge currency but agree that the Federal Reserve’s (the Fed) monetary policy is the primary driver of the USD rate.

The Fed's hawkish monetary policy encouraged the appreciation of the US dollar– in 2022, the central bank raised the interest rate seven times – from 0.25% to 4.50%. However, it’s vital to highlight that the Reserve Bank of Australia (RBA) also raised its interest rate even more often than the Fed. During 2022, there were eight rate hikes, so the rate reached 3.10%. Why was the AUD weaker than the US dollar? Despite the smaller number of hikes, the interest rate in the US is higher than in Australia.

Analysts say that the Australian dollar will appreciate only if the pace of the US dollar’s strengthening calms down. This may happen in the near future as the Fed is expected to soften its monetary policy, raising rates at a slower pace. Still, not all analysts agree with that. The Federal Reserve can’t beat the rising inflation rate. Therefore, it may maintain its aggressive approach, and the AUD/USD pair will continue moving in a downtrend.

VIEW FULL ANALYSIS VISIT - FXOpen Blog...

Disclaimer: This Forecast represents FXOpen Companies opinion only, it should not be construed as an offer, invitation or recommendation in respect to FXOpen Companies products and services or as Financial Advice.

907 (edited by Resolve 2023-03-13 20:04:20)

Re: Technical Analysis by FXOpen

NASDAQ feels the effect of Silicon Valley Bank collapse
https://i.postimg.cc/cHLGf4Ts/img-009.png

It was inevitable that a large, previously highly capitalised bank which is one of the preferred depositories of capital for venture capital-funded technology companies in the Silicon Valley and San Francisco Bay area, would create major waves within the wider financial markets economy if it collapsed.

Well, collapse it has, and the fallout is immense.

Silicon Valley Bank, which was founded 39 years ago at the height of the global technology revolution, has gone under, with losses estimated at over $15 billion, and now the fingers of blame are being pointed as the bank's collapse serves to echo the banking crisis of 2008/2009 after which many observers and government regulators cited lack of prudent governance, carefree risk management and lending to those who cannot afford repayments to have been factors.

So grave was it, that the US and European governments embarked on a whole new set of regulations in order to prevent financial institutions from engaging in gung-ho corporate policy and in favour of protecting the public and business community from being subjected to losses should banks fail.

However, here we are in 2023 and we are witnessing the second largest collapse of a bank in the history of the United States economy.

Once again, factors contributing to the collapse of Silicon Valley Bank include poor risk management and a bank run driven by tech industry investors.

The failure of SVB was the largest of any bank since the 2007–2008 financial crisis by assets, and the second largest in U.S. history behind that of Washington Mutual which went bankrupt in 2008.

Many high tech firms which had raised venture capital to fund their growth had deposited the venture capital in large sums into accounts at Silicon Valley Bank, and the bank had experienced such an influx of funds in the first part of this decade that it was unable to lend responsibly so took on government bonds, which were long term in their investment structure, and had done so during a period of low interest rates.

Now the piper has to be paid, and the liabilities were too high.

As a result, shareholder confidence in publicly listed stocks on the tech-friendly NASDAQ exchange have taken a downturn.

At close of business on Friday, the NASDAQ Composite index had declined by over 5% during the course of last week, with losses gaining ground after the announcement of the collapse of Silicon Valley Bank.

This high profile and scandalous collapse of a major financial institution which has many Silicon Valley tech firms as customers has added a new dent to the performance of US tech stocks, which have been volatile for some time now.

Over the course of 2022, US tech stocks were very low compared to the previous year, and older style, traditional companies were doing well, and still are – such as those listed on London’s FTSE 100 index.

Overall, the venture-capital funded tech scene is seen as avantgarde but risky compared to the old money which exists on traditional exchanges.

It is just that now, we are seeing the market treat it as such.

VIEW FULL ANALYSIS VISIT - FXOpen Blog...

Disclaimer: This Forecast represents FXOpen Companies opinion only, it should not be construed as an offer, invitation or recommendation in respect to FXOpen Companies products and services or as Financial Advice.

Re: Technical Analysis by FXOpen

Turkish Lira crisis lingers with sustained record low against USD
https://i.postimg.cc/76V3CKnV/lira.png

The Turkish economy is a highly diversified one.

Its industry base is by far the most developed in the  Middle East, almost resembling European nations with its highly advanced telecommunications, tourism, vehicle manufacturing, computer science, fintech, clothing and consumer white goods sectors.

It’s an industrious society and has been improving tremendously over the years in its modernity.

The main obstacle faced by Turkish businesses and households in recent times has been directly connected to the country’s clearly diversified but somehow troubled economy.

Over the past two days, the Turkish Lira has plummeted even further to the extent that it is now at an all-time low against the US Dollar and other major currencies.

Today, the Turkish Lira is trading at 18.97 against the US Dollar, a value far lower than any time in history.

Presidential and parliamentary elections scheduled for May 14 are adding to uncertainty, although they are still some two months away. Overall, there is a concern over the possible continuation of current President Tayyip Erdogan's controversial policies which have led to a rapidly depreciating currency and an eye-watering 70% inflation figure, or if monetary policy could perhaps revert to orthodoxy as promised by the opposition should the opposition become elected.

Added to the long-existing fiscal malaise in Turkey, global economists are now looking at the economic impact of the disastrous earthquakes that hit Turkey last month.

The depreciation to new record lows has occurred despite the recent deposit of $5 billion into the Turkish central bank by the Saudi Fund for Development, which was cited at the time to be "a demonstration of the Kingdom of Saudi Arabia’s commitment to supporting Turkey’s efforts to strengthen its economy’.

Rather astonishingly, The Turkish Lira has depreciated over the past five years against the British Pound by a staggering 300%, demonstrating that its instability has dented the Turkish economy, but has encouraged British tourists to visit the country even more than they already do - and Turkey is one of the most popular vacation destinations for British tourists.

Also, on the subject of tourism, Turkey has welcomed tens of thousands of tourists from Russia over the past year, as its neutrality has been a boon for business.

Whilst it is good that the tourist industry is booming, the depreciation of revenues from tourist business remains a hard metric to swallow in that 70% inflation has done a lot to wipe out a large proportion of revenue.

Turkey's workforce continues to be industrious and is not showing signs of giving up, so it is an economic region to watch closely.

VIEW FULL ANALYSIS VISIT - FXOpen Blog...

Disclaimer: This Forecast represents FXOpen Companies opinion only, it should not be construed as an offer, invitation or recommendation in respect to FXOpen Companies products and services or as Financial Advice.

Re: Technical Analysis by FXOpen

BTCUSD and XRPUSD Technical Analysis – 14th MAR 2023
https://i.postimg.cc/j5wZJwBp/btc.png

BTCUSD: Bullish Engulfing Pattern Above $19552

Bitcoin was unable to sustain its bearish momentum last week and after touching a low of $19552 on 10th March, the prices started to correct upwards against the US dollar, touching a high of $24800 today in the European trading session.

We have seen a bullish opening of the markets this week.

We can clearly see a bullish engulfing pattern above the $19552 handle which is a bullish reversal pattern because it signifies the end of a downtrend and a shift towards an uptrend.

Bitcoin touched an intraday high of 24800 in the European trading session, and an intraday low of 24005 in the Asian trading session today.

We can see the formation of bullish engulfing lines in the weekly time frame.

The price of bitcoin is ranging near a new record high of 1 month.

Both the STOCH and Williams percent range are indicating overbought levels which means that in the immediate short term, a decline in the prices is expected.

The MACD indicator is giving a bullish divergence signal in the weekly time frame.

The relative strength index is at 68.46 indicating a STRONG demand for bitcoin, and the continuation of the buying pressure in the markets.

Bitcoin is now moving above its 100 hourly simple moving average and above its 100 hourly exponential moving averages.

Most of the major technical indicators are giving a buy signal, which means that in the immediate short term we are expecting targets of 24500 and 25000.

The average true range is indicating less market volatility with a bullish momentum.

  • Bitcoin: bullish reversal seen above $19552.

  • The STOCHRSI is indicating an oversold market.

  • The price is now trading just below its pivot level of $24298.

  • The short-term range is strongly BULLISH.

Bitcoin: Bullish Reversal Seen Above $19552
https://i.postimg.cc/Zn6Hwkbj/btcx.png

The price of bitcoin is now moving in a strongly bullish momentum above the $24000 handle. After some market consolidation, we can see fresh upsides in the ranges of $24500 to $25500.

The MACD indicator is back over zero in the weekly time frame indicating a bullish trend.

We can see the formation of a bullish price crossover pattern with the adaptive moving average AMA 50 in the weekly time frame.

The MACD crosses up its moving average in the daily time frame indicating a bullish scenario.

The immediate short-term outlook for bitcoin is strongly bullish, the medium-term outlook has turned bullish, and the long-term outlook remains neutral under present market conditions.

Bitcoin’s support zone is located at $22460 which is a 14 day RSI at 50%, and at $23557 at which the price crosses the 9 day moving average stalls.

The price of BTCUSD is now facing its classic resistance level of 24381 and Fibonacci resistance level of 24426 after which the path towards 25000 will get cleared.

In the last 24hrs, BTCUSD has increased by 11.21% by 2462.33$ and has a 24hr trading volume of USD 46.508 billion. We can see an increase of 21.06% in the trading volume compared to yesterday, which is due to the buying seen at lower levels.

The Week Ahead

We have seen a Bullish correction in the prices of bitcoin and the resumption of a bullish trend which is expected to continue towards the $25000 levels.

With an increase in the global investor confidence, we can see an increase in the buying pressure and the trading volumes of bitcoin during the last 24hrs.

We can see the formation of a bullish doji star pattern in the 4-hour time frame.

The daily RSI is printing at 62.03 which indicates a strong demand for bitcoin and the continuation of the bullish phase present in the markets in the short-term range.

We can see the formation of a bullish trend line from $19552 towards the $24780 level.

The price of BTCUSD is now facing its resistance zone located at $25238 which is a 13-week high and $25814 which is a pivot point 1st resistance point.

The weekly outlook is projected at $25500 with a consolidation zone of $25000.

VIEW FULL ANALYSIS VISIT - FXOpen Blog...

Disclaimer: This Forecast represents FXOpen Companies opinion only, it should not be construed as an offer, invitation or recommendation in respect to FXOpen Companies products and services or as Financial Advice.

Re: Technical Analysis by FXOpen

EUR/USD and EUR/JPY Aim More Upsides
https://i.postimg.cc/q78RT12Z/eur.png

EUR/USD is eyeing a steady increase above the 1.0750 resistance. EUR/JPY is rising and might rally further if it clears the 144.50 resistance zone.

Important Takeaways for EUR/USD and EUR/JPY

  • The Euro started a fresh increase above the 1.0700 support zone.

  • There is a key bullish trend line forming with support near 1.0740 on the hourly chart.

  • EUR/JPY started a steady increase after it found support near the 141.40.

  • There was a break above a major bearish trend line with resistance near 143.65 on the hourly chart.

EUR/USD Technical Analysis
https://i.postimg.cc/pL5r0Wrv/eurx.jpg

The Euro remained well bid above the 1.0550 zone and started a fresh increase against the US Dollar. The EUR/USD pair was able to clear the 1.0620 resistance.

There was a clear move above the 1.0700 level and the 50 hourly simple moving average. The pair even climbed above the 1.0720 level and the 50 hourly simple moving average. The pair traded as high as 1.0759 on FXOpen and is currently showing positive signs.

On the upside, an immediate resistance is near the 1.0760 level. The next major resistance is near the 1.0780 level. The main resistance is near 1.0800.

A clear move above the 1.0800 resistance might send the price towards 1.0880. If the bulls remain in action, the pair could visit the 1.0950 resistance zone in the near term.

On the downside, the pair might find support near the 1.0740 level. There is also a key bullish trend line forming with support near 1.0740 on the hourly chart. The trend line is near the 23.6% Fib retracement level of the upward move from the 1.0678 swing low to 1.0759 high.

The next major support sits near the 1.0720 level or the 50% Fib retracement level of the upward move from the 1.0678 swing low to 1.0759 high, below which the pair could even test the 1.0680 support zone.

If there is a downside break below the 1.0680 support, the pair might accelerate lower in the coming sessions.  In the stated case, it could even test 1.0620.

VIEW FULL ANALYSIS VISIT - FXOpen Blog...

Disclaimer: This Forecast represents FXOpen Companies opinion only, it should not be construed as an offer, invitation or recommendation in respect to FXOpen Companies products and services or as Financial Advice.

911 (edited by Resolve 2023-03-16 16:03:16)

Re: Technical Analysis by FXOpen

ETHUSD and LTCUSD Technical Analysis – 16th MAR, 2023
https://i.postimg.cc/XNkDq0SV/eth.png

ETHUSD: Bullish Harami Pattern Above $1369

Ethereum was unable to sustain its bearish momentum and after touching a low of $1369 on 10th Mar, the price started to correct upwards against the US dollar touching a high of $1775 on 14th Mar.

We have seen a bullish opening of the markets this week.

The MACD indicator is giving a bullish divergence signal in the weekly time frame.

We can clearly see a bullish harami pattern above the $1369 handle which is a bullish pattern and signifies the end of a bearish phase and the start of a bullish phase in the markets.

ETH is now trading just below its pivot level of 1660 and moving into a mildly bullish channel. The price of ETHUSD is now testing its classic resistance level of 1705 and Fibonacci resistance level of 1761 after which the path towards 1800 will get cleared.

We can see the formation of bullish engulfing lines in the weekly time frame.

The relative strength index is at 55.18 indicating a strong demand for Ether and a shift towards the buying phase in the markets.

The STOCHRSI is giving an overbought signal, which means that the price is expected to decline in the short-term range.

Most of the technical indicators are giving a buy market signal.

Most of the moving averages are giving a buy signal at the current market level of $1650.

ETH is now trading above both its 100 hourly simple and 100 hourly exponential moving averages.

  • Ether: bullish reversal seen above the $1369 mark.

  • The short-term range appears to be mildly bullish.

  • ETH continues to remain above the $1600 level.

  • The average true range is indicating high market volatility.

Ether: Bullish Reversal Seen Above $1369
https://i.postimg.cc/CLvPCHxX/etx.png

ETHUSD continues to build upwards momentum and we are now looking to cross the $1700 handle after which the next visible targets are located at the $1800 level.

The parabolic SAR indicator is giving a bullish reversal signal in the weekly time frame.

The MACD indicator is back over zero in the weekly time frame indicating a bullish scenario present in the markets.

We can see the formation of a bullish trend reversal pattern with the adaptive moving average AMA20 in the 4-hour time frame.

ETHUSD touched an intraday high of 1664 and an intraday low of 1634 in the Asian trading session today.

The key support levels to watch are $1559 at which the price crosses 9-day moving average stalls, and at $1587 which is a 14-day RSI at 50%.

ETH has decreased by 2.21% with a price change of 37.60$ in the past 24hrs and has a trading volume of 12.639 billion USD.

We can see a decrease of 18.80% in the total trading volume in the last 24 hrs. which appears to be normal.

The Week Ahead

ETH was successful in crossing the $1700 handle and touched a high of $1775 after which we can see some downwards correction. After the price stabilizes, we are looking for fresh upsides in the range of $1700 to $1800 levels.

We can see the formation of a bullish ascending channel from $1369 towards the $1687 level.

The immediate short-term outlook for Ether has turned mildly bullish, the medium-term outlook has turned bullish, and the long-term outlook for Ether neutral under present market conditions.

The resistance zone is located at $1710 which is a pivot point 1st resistance point and at $1781 which is a 1-month high.

The weekly outlook is projected at $1850 with a consolidation zone of $1800.

VIEW FULL ANALYSIS VISIT - FXOpen Blog...

Disclaimer: This Forecast represents FXOpen Companies opinion only, it should not be construed as an offer, invitation or recommendation in respect to FXOpen Companies products and services or as Financial Advice.

Re: Technical Analysis by FXOpen

AUD/USD and NZD/USD Eyes Sustained Move Higher
https://i.postimg.cc/8PbsDDjr/aud.png

AUD/USD started a fresh increase above the 0.6680 resistance zone. NZD/USD is rising and might aim a move above the 0.6250 resistance.

Important Takeaways for AUD/USD and NZD/USD

  • The Aussie Dollar started a fresh increase above the 0.6650 resistance against the US Dollar.

  • There is a key bullish trend line forming with support near 0.6680 on the hourly chart of AUD/USD.

  • NZD/USD started a decent increase above the 0.6200 resistance zone.

  • There is a major bullish trend line forming with support near 0.6180 on the hourly chart of NZD/USD.

AUD/USD Technical Analysis
https://i.postimg.cc/vmT43j8x/audx.jpg

The Aussie Dollar found support near 0.6590 and started a decent increase against the US Dollar. The AUD/USD pair gained pace for a move above the 0.6620 resistance.

The pair even moved above the 0.6650 level and the 50 hourly simple moving average. There was a clear move above the 61.8% Fib retracement level of the downward move from the 0.6711 swing high to 0.6589 low.

It is now trading above the 0.6700 level, plus above the 76.4% Fib retracement level of the downward move from the 0.6711 swing high to 0.6589 low.

On the upside, the AUD/USD pair is facing resistance near the 0.6710 level. The next major resistance is near the 0.6740 level. A close above the 0.6740 level could start another steady increase in the near term. The next major resistance could be 0.6800.

On the downside, an initial support is near the 0.6685 level. There is also a key bullish trend line forming with support near 0.6680 on the hourly chart of AUD/USD.

The next support could be the 0.6650 level and the 50 hourly simple moving average. If there is a downside break below the 0.6650 support, the pair could extend its decline towards the 0.6600 level.

VIEW FULL ANALYSIS VISIT - FXOpen Blog...

Disclaimer: This Forecast represents FXOpen Companies opinion only, it should not be construed as an offer, invitation or recommendation in respect to FXOpen Companies products and services or as Financial Advice.

Re: Technical Analysis by FXOpen

Watch FXOpen's March 13 -17 Weekly Market Wrap Video

*In this video, FXOpen UK COO Gary Thomson sums up the week’s happenings and discusses the most significant news reports.

  • There will be more bank failures

  • Inflation data was not surprising. What will happen next?

  • Turkish Lira crisis lingers with sustained record low against USD

  • Oil updates the minimums of the year

Watch our short and informative video, and stay updated with FXOpen.

https://i.postimg.cc/QtCpX87x/week-09.png


FXOpen YouTube


Disclaimer: This forecast represents FXOpen Companies opinion only, it should not be construed as an offer, invitation or recommendation in respect to FXOpen Companies products and services or as financial advice.

#fxopen #fxopenyoutube #fxopenuk #weeklyvideo

Re: Technical Analysis by FXOpen

GBP/USD Regains Strength While EUR/GBP Faces Many Hurdles
https://i.postimg.cc/Y0nvKcZ3/gbp.png

GBP/USD started a fresh increase above the 1.2000 resistance zone. EUR/GBP is struggling and facing resistance near the 0.8780 level.

Important Takeaways for GBP/USD and EUR/GBP

  • The British Pound started a fresh increase above the 1.2000 barrier against the US Dollar.

  • There was a break above a key bearish trend line with resistance near 1.2120 on the hourly chart of GBP/USD.

  • EUR/GBP found support near 0.8715 and is currently recovering higher.

  • There is a major bearish trend line forming with resistance near 0.8780 on the hourly chart.

GBP/USD Technical Analysis

The British Pound steady increase after it settled above the 1.2000 resistance zone against the US Dollar. The GBP/USD pair gained pace for a move above the 1.2080 resistance zone.

During the increase, there was a break above a key bearish trend line with resistance near 1.2120 on the hourly chart of GBP/USD. The pair even broke the 1.2150 resistance zone and settled above the 50 hourly simple moving average.

GBP/USD Hourly Chart
https://i.postimg.cc/tgWn1Mnq/gbpx.jpg

A high is formed near 1.2205 and the pair is now consolidating gains. On the downside, an initial support is near the 1.2160 level. It is near the 23.6% Fib retracement level of the upward move from the 1.2027 swing low to 1.2205 high.

The next major support is near the 1.2120 level and the 50 hourly simple moving average. It is near the 50% Fib retracement level of the upward move from the 1.2027 swing low to 1.2205 high.

Any more losses could lead the pair towards the 1.2050 support zone. On the upside, an initial resistance is near the 1.2200 level. The first major resistance is near the 1.2220 level. A clear move above the 1.2220 level could spark a decent increase.

The next major resistance sits near the 1.2320 level. Any more gains might send the pair towards the 1.2400 resistance zone.

VIEW FULL ANALYSIS VISIT - FXOpen Blog...

Disclaimer: This Forecast represents FXOpen Companies opinion only, it should not be construed as an offer, invitation or recommendation in respect to FXOpen Companies products and services or as Financial Advice.

Re: Technical Analysis by FXOpen

Swiss tsunami rips through global markets: FTSE 100 wipeout noticeable
https://i.postimg.cc/sDjGfqBc/ftse100.png

Last week’s revelations that Credit Suisse, the second largest bank in Switzerland which is also a global market-maker at Tier 1 interbank level, has got into financial dire straits has had more than an effect on the local banking sector.

As is to be expected, the demise of such as key financial institution has had a major impact on many other markets internationally, one of which is the FTSE 100 index in London.

By Thursday last week, just days after the possibility of a total demise of Credit Suisse had become a real concern, £76 billion was wiped off the value of the index which contains London’s top 100 stock in blue-chip companies.

Over the past five days, the FTSE 100 index has lost 5.8% in value, and is now at its lowest point in over a month, down some 9.8% over the past 30 days.

This morning, as the markets open in London for the first time this week, it was clear that the collapse of Credit Suisse has taken its toll across a whole range of asset classes and company stocks.

One of the reasons for a further tumble in value this morning is that a possible deal between UBS, another Swiss banking giant, and Credit Suisse has not been successful, meaning that even for $1, Credit Suisse was unsaleable.

Bank stocks across the world have depreciated due to the collapse of yet another Tier 1 bank, which has gone the same way as many banks over the past 15 years despite all of the regulatory overhauls and possible lessons learned from the 2008/2009 financial crisis in which a whole host of large commercial banks in Europe and North America collapsed, with some disappearing forever after hundreds of years in business, and some being nationalised at the expense of the taxpayer.

Confidence, therefore is low and added to that are fall-out factors such as the total write-off of US$17 billion worth of Credit Suisse bonds as part of the proposed UBS deal sparked concern about similar debt and sent banking shares down further.

Lloyds Banking Group PLC, HSBC, Standard Chartered and NatWest shares dropped in value by 3.3%. 2.8%, 7.2% and 3.3% respectively and the FTSE 100 is now languishing at 7.335.

It certainly appears that the 8,000 points that analysts were looking at a few weeks ago is now an unfulfilled and distant memory.

VIEW FULL ANALYSIS VISIT - FXOpen Blog...

Disclaimer: This Forecast represents FXOpen Companies opinion only, it should not be construed as an offer, invitation or recommendation in respect to FXOpen Companies products and services or as Financial Advice.

Re: Technical Analysis by FXOpen

British Pound reaches one-month high against US Dollar despite banking crisis
https://i.postimg.cc/KznvS12n/img-009.png

There has been so much focus on the shock waves that have been sent through the global markets this week as a result of what has now become viewed as a ‘banking crisis’ that only a downward direction in value for stocks and currencies has been considered.

Credit Suisse, the second largest Swiss bank, and one of the world’s largest Tier 1 interbank Forex dealers has collapsed after a few years of serious financial problems and ill-judged decisions such as the 2021 revelation that the bank had helped Bill Hwang, a trader whose activities got him banned in Hong Kong, move his activities to New York and rebrand his high risk hedge fund as Archegos before beginning down the same path that got him banned in New York, costing Credit Suisse $5.5 billion.

There have been other such disasters too, and some loss-making years over the course of the past decade but it is clear that now we are witnessing the end of Credit Suisse in its current form, and even UBS pulled out of a deal to buy it for $1.

The havoc that this has wreaked, including a lack of trust in banks once again – memories are not so short as to forget the credit crunch and banking collapses of the late 2000s, where many banks were either bankrupt after hundreds of years in business, or bailed out by the taxpayers and nationalised – is now noticeable on European stock exchanges as bank stocks have dived, and in currency prices.

However, it is important to note that it is not just the European side of the Atlantic that has been subjected to high value, high profile banking collapses over the past week.

Silicon Valley Bank in the United States collapsed last week, causing a ripple effect which meant that regional banks, of which there are a lot in the United States, lost a lot of value. One particular bank, First Republic, had lost 61% of its stock value by March 13.

Therefore, if malaise is on both sides of the pond, what can traders and investors do, other than pick up the pieces and try to continue their business.

As a result, the British market is resuming its pace, with the British Pound this morning trading at the high 1.22 range against the US Dollar, representing the highest point in over a month.

This is an interesting situation given that the FTSE 100 index lost over £76 billion in value due to the Credit Suisse debacle causing fear among investors and impacting bank stocks, many of which are listed on the London Stock Exchange and included in the FTSE 100 index.

It appears that the overall sentiment is to pick up the pieces and carry on, with an understanding that the banking trepidation is no better on the North American side of the Altantic, and as a result, it’s a good day for the British Pound.

VIEW FULL ANALYSIS VISIT - FXOpen Blog...

Disclaimer: This Forecast represents FXOpen Companies opinion only, it should not be construed as an offer, invitation or recommendation in respect to FXOpen Companies products and services or as Financial Advice.

Re: Technical Analysis by FXOpen

BTCUSD and XRPUSD Technical Analysis – 21st MAR 2023
https://i.postimg.cc/ZnpfLh6Y/btc.png

BTCUSD: Morning Star Pattern Above $23935

Bitcoin continues its bullish momentum from last week and after touching a low of $23935 on 15th March, the price started to correct upwards against the US dollar, touching a high of $28439 on 20th Mar.

We have seen a bullish opening of the markets this week.

We can clearly see a morning star pattern above the $23935 handle which is a bullish reversal pattern because it signifies the end of a downtrend and a shift towards an uptrend.

Bitcoin touched an intraday high of 28180 in the Asian trading session, and an intraday low of 27378 in the European trading session today.

The price of bitcoin is ranging near a new record high of 1 year.

Both the STOCH and Williams percent range are indicating overbought levels which means that in the immediate short term, a decline in the prices is expected.

The RSI indicator is back over 50 in the 2-hourly time frame indicating bullish trends.

The relative strength index is at 63.77 indicating a strong demand for bitcoin, and the continuation of the buying pressure in the markets.

Bitcoin is now moving above its 100 hourly simple moving average and above its 100 hourly exponential moving averages.

Most of the major technical indicators are giving a BUY signal, which means that in the immediate short term, we are expecting targets of 28000 and 28500.

The average true range is indicating less market volatility with a bullish momentum.

  • Bitcoin: bullish continuation seen above $23935.

  • The STOCHRSI is indicating an oversold market.

  • The price is now trading above its pivot level of $27744

  • The short-term range is strongly bullish.

Bitcoin: Bullish Continuation Seen Above $23935
https://i.postimg.cc/05wHv7hg/btcx.png

The price of Bitcoin is now moving in a strongly bullish momentum above the $27000 handle. After some retraction we can see fresh upsides in the ranges of $28000 to $28500.

We can see the formation of a bullish price crossover pattern with the adaptive moving average AMA 100 in the 2-hourly time frame.

The price of bitcoin is ranging near the support of the triangle in the 1-hour time frame indicating a bullish scenario.

We have also detected the formation of a three white soldiers pattern in the 30-minute time frame indicating a bullish outlook.

The immediate short-term outlook for bitcoin is strongly bullish, the medium-term outlook has turned bullish, and the long-term outlook remains neutral under present market conditions.

Bitcoin’s support zone is located at $24152 at which the price crosses the 9-day moving average, and at $25825 which is a 14-3 day raw stochastic at 70%.

The price of BTCUSD is now facing its classic resistance level of 27861 and Fibonacci resistance level of 28072 after which the path towards 28500 will get cleared.

In the last 24hrs, BTCUSD has decreased by 0.88% by 246.91$ and has a 24hr trading volume of USD 38.608 billion. We can see a decrease of 18.76% in the trading volume compared to yesterday, which appears to be normal.

The Week Ahead

We can see that bitcoin continues its bullish momentum and the prices continue to remain above the $27000 handle. We are now looking for fresh upsides in the range of $28000 and $29000.

The demand for bitcoin continues and we can say that now crypto winter has ended with the resumption of the long-term bullish trend in the BTCUSD.

The daily RSI is printing at 70.68 which indicates a strong demand for bitcoin and the continuation of the bullish phase present in the markets in the short-term range.

We can see the formation of a bullish trend line from $23935 towards the $28667 Levels.

The price of BTCUSD is now facing its resistance zone located at $28496 which is a 1-month high and at $28796 which is a pivot point 1st resistance point.

The weekly outlook is projected at $29000 with a consolidation zone of $28500.

VIEW FULL ANALYSIS VISIT - FXOpen Blog...

Disclaimer: This Forecast represents FXOpen Companies opinion only, it should not be construed as an offer, invitation or recommendation in respect to FXOpen Companies products and services or as Financial Advice.

Re: Technical Analysis by FXOpen

To hike or not to hike? That is the Fed’s question
https://i.postimg.cc/PqVY35hq/fed.png

Today, futures contracts which are related to North American stocks have taken a bit of a downturn in projected value as today is another day in which the United States Federal Reserve Bank – known as The Fed – is set to announce its position on interest rate adjustments.

In advance of the opening session in New York today, futures contracts which related to stocks listed on the Dow Jones Industrial Average fell 29 points which equates to a 0.1% drop, S&P 500 futures were down 0.1%, while Nasdaq-100 futures dipped 0.2%.

The Federal Reserve Bank has been holding a policy meeting which has taken place over the past two days, with the final day being today and investors and traders are awaiting the outcome, which may reveal a further increase in the base rate of interest across the United States.

Speculators and analysts have been looking at the possibility of the Federal Reserve implementing a 25 base point increase in the base rate of interest, as well as a possibility of tightening of monetary policy especially given the recent contagion across the United States banking sector in the aftermath of the collapse of Silicon Valley Bank.

During the past few days, smaller regional banks have been affected and now First Republic is teetering on the brink of collapse resulting in a 61% drop in share price last week and a bank run which meant that many investors withdrew their money, subsequently depositing it with larger Tier 1 banks.

Rather incredibly, a batch of larger banks this week took their customers funds to the tune of $30 billion and deposited it in First Republic to prop it up.

As a result of this turn of events, confidence in the US banking sector is very low once again, and futures contracts on major indices are showing the bearish approach many investors are taking at a time when banks are struggling, and interest rates may rise again.

Fascinatingly, these stocks, usually traded by conservative investors due to their relative stability and long-standing presence on major exchanges are down, and the overall sentiment within the banking and US monetary situation is cautious to say the least, yet a meme stock that was responsible for the infamous market short in January 2021 is soaring.

GameStop, the entertainment firm which appeared in high profile news reports two years ago because of the reddit group WallStreetBets effectively ‘market making’ on social media and shorting the stock, causing a black swan event, is on the up.

The company, listed on the NASDAQ exchange, reported a 22.4% growth in margins and as a result, its stock soared by 43%.

It is an interesting day, when the banks, some of which are hundreds of years old, are causing more fear than a meme stock!

VIEW FULL ANALYSIS VISIT - FXOpen Blog...

Disclaimer: This Forecast represents FXOpen Companies opinion only, it should not be construed as an offer, invitation or recommendation in respect to FXOpen Companies products and services or as Financial Advice.

Re: Technical Analysis by FXOpen

ETHUSD and LTCUSD Technical Analysis – 23rd MAR, 2023
https://i.postimg.cc/kgbqmyPt/eth.png

ETHUSD: Double Bottom Pattern Above $1612

Ethereum was unable to sustain its bearish momentum and after touching a low of $1612 on 15th Mar, the price started to correct upwards against the US dollar touching a high of $1835 on 19th Mar.

We have seen a bullish opening of the markets this week.

The prices of Ethereum are ranging near a new record high of 1 month.

We can clearly see a double bottom pattern above the $1612 handle which is a bullish pattern and signifies the end of a bearish phase and the start of a bullish phase in the markets.

ETH is now trading just above its pivot level of 1749 and is moving in a mildly bullish channel. The price of ETHUSD is now testing its classic resistance level of 1752 and Fibonacci resistance level of 1754 after which the path towards 1800 will get cleared.

We can see the formation of both bullish harami and bullish harami cross patterns in the daily time frame.

The relative strength index is at 46.05 indicating a neutral demand for Ether and a shift towards the consolidation phase in the markets.

The STOCHRSI is giving an overbought signal, which means that the price is expected to decline in the short-term range.

Most of the technical indicators are giving a buy market signal.

Most of the moving averages are giving a buy signal at the current market level of $1650.

ETH is now trading above both the 200 hourly simple and 200 hourly exponential moving averages.

  • Ether: bullish reversal seen above the $1612 mark.

  • The short-term range appears to be mildly bullish.

  • ETH continues to remain above the $1700 level.

  • The average true range is indicating less market volatility.

Ether: Bullish Reversal Seen Above $1612
https://i.postimg.cc/CKpYLfwr/etx.png

ETHUSD has been successful in crossing the $1800 barrier after which we have seen some pullback action in the markets due to the US Fed raising the interest rates, but this is temporary and we will again see ETHUSD touching the $1800 level soon.

We can see the formation of the bullish trend reversal pattern with the adaptive moving average AMA50 in the 4-hour time frame.

The Williams percent range is indicating a neutral level in both the 15- and 30-minute time frame.

ETHUSD touched an intraday low of 1715 in the Asian trading session and an intraday high of 1754 in the European trading session today.

The key support levels to watch are $1696 which is a 3-10-16 day MACD moving average stalls, and $1717 at which the price crosses the 9-day moving average.

ETH has decreased by 1.88% with a price change of 33.62$ in the past 24hrs and has a trading volume of 12.527 billion USD.

We can see an increase of 18.44% in the total trading volume in the last 24 hrs which appears to be normal.

The Week Ahead

ETH was successful in crossing the $1800 handle and touched a high of $1835 after which we can see some downwards correction. After the price stabilizes, we are looking for fresh upsides in the range of $1800 to $1900 levels.

We can see the formation of a bullish ascending channel from $1612 towards the $1843 level.

The immediate short-term outlook for Ether has turned mildly bullish, the medium-term outlook has turned bullish, and the long-term outlook for Ether is neutral under present market conditions.

The resistance zone is located at $1800 which is a pivot point 1st resistance point and at $1845 which is a 1-month high.

The weekly outlook is projected at $1900 with a consolidation zone of $1850.

VIEW FULL ANALYSIS VISIT - FXOpen Blog...

Disclaimer: This Forecast represents FXOpen Companies opinion only, it should not be construed as an offer, invitation or recommendation in respect to FXOpen Companies products and services or as Financial Advice.

Re: Technical Analysis by FXOpen

Gold Price Extends Rally While Crude Oil Price Might Correct Lower
https://i.postimg.cc/PJc6TTyH/gold.png

Gold price is rising and gaining pace above the $1,950 resistance. Crude oil price is declining and remains at a risk of more losses below $70.

Important Takeaways for Gold and Oil

  • Gold price started a fresh increase above the $1,950 resistance against the US Dollar.

  • It broke a key bearish trend line with resistance near $1,945 on the hourly chart of gold.

  • Crude oil price started a fresh decline below the $70.50 support zone.

  • There was a break below a rising channel with support near $70.40 on the hourly chart of XTI/USD.

Gold Price Technical Analysis

Gold price formed a base above the $1,940 support zone against the US Dollar. The price started a decent increase and was able to clear the $1,950 resistance zone.

The bulls were able to push the price above the 50% Fib retracement level of the downward move from the $2,009 swing high to $1,934 low (formed on FXOpen). There was also a break above a key bearish trend line with resistance near $1,945 on the hourly chart of gold.

Gold Price Hourly Chart
https://i.postimg.cc/63MjbdGy/goldx.jpg

The price is now trading above the $1,980 level and the 50 hourly simple moving average. It is also above the 76.4% Fib retracement level of the downward move from the $2,009 swing high to $1,934 low.

The bulls are now facing resistance near the $2,000 zone. The next key hurdle is near the $2,010 level. A clear upside break above the $2,010 resistance could send the price towards $2,040.

If there is no upside break, the price might correct lower. An immediate support on the downside is near the $1,980 level. The next major support is near the $1,970 level, below which there is a risk of a larger decline. In the stated case, the price could decline sharply towards the $1,950 support zone.

VIEW FULL ANALYSIS VISIT - FXOpen Blog...

Disclaimer: This Forecast represents FXOpen Companies opinion only, it should not be construed as an offer, invitation or recommendation in respect to FXOpen Companies products and services or as Financial Advice.

Re: Technical Analysis by FXOpen

Watch FXOpen's March 20 -24 Weekly Market Wrap Video

In this video, FXOpen UK COO Gary Thomson sums up the week’s happenings and discusses the most significant news reports.

  • Swiss tsunami rips through global markets: FTSE 100 wipeout noticeable

  • British Pound reaches one-month high against US Dollar despite banking crisis

  • EURUSD hits monthly highs ahead of Fed news

  • To hike or not to hike? That is the Fed’s question

Watch our short and informative video, and stay updated with FXOpen.

https://i.postimg.cc/76kSfVPc/week-009.png


FXOpen YouTube


Disclaimer: This forecast represents FXOpen Companies opinion only, it should not be construed as an offer, invitation or recommendation in respect to FXOpen Companies products and services or as financial advice.

#fxopen #fxopenyoutube #fxopenuk #weeklyvideo

Re: Technical Analysis by FXOpen

GBP/USD Eyes Fresh Increase While USD/CAD Visits Key Support
https://i.postimg.cc/25QMqrjn/gbp.png

GBP/USD is showing positive signs above the 1.2200 support. USD/CAD corrected gains and now trading near a key support at 1.3720.

Important Takeaways for GBP/USD and USD/CAD

  • The British Pound started a downside correction from the 1.2340 resistance zone.

  • There was a break below a key bullish trend lien with support near 1.2280 on the hourly chart of GBP/USD.

  • USD/CAD is correcting gains from the 1.3800 resistance zone.

  • There was a break above a major bearish trend line with resistance near 1.3730 on the hourly chart.

GBP/USD Technical Analysis

The British Pound started a fresh decline from well above 1.2320 against the US Dollar. The GBP/USD pair gained bearish momentum after there was a break below the 1.2280 support.

The pair even broke the 1.2250 support level and the 50 hourly simple moving average. Besides, there was a break below a key bullish trend lien with support near 1.2280 on the hourly chart of GBP/USD.

GBP/USD Hourly Chart
https://i.postimg.cc/FHJ2402W/gbpx.jpg

Finally, there was a spike below the 1.2200 level. A low is formed near 1.2190 on FXOpen and the pair is now correcting losses. There was a move above the 1.2220 level. The pair climbed above the 23.6% Fib retracement level of the downward move from the 1.2343 swing high to 1.2190 low.

An immediate resistance is near the 1.2250 level. The first major resistance is near the 1.2265 level and the 50 hourly simple moving average. It is near the 50% Fib retracement level of the downward move from the 1.2343 swing high to 1.2190 low.

The next major resistance is near the 1.2300 level. Any more gains could lead the pair towards the 1.2340 barrier in the near term. If not, the pair could move down and might break the 1.2200 support. The next major support is near 1.2180.

If there is a downside break, GBP/USD might test the 1.2120 support. The next major support sits at 1.2050, where the bulls might take a stand.

VIEW FULL ANALYSIS VISIT - FXOpen Blog...

Disclaimer: This Forecast represents FXOpen Companies opinion only, it should not be construed as an offer, invitation or recommendation in respect to FXOpen Companies products and services or as Financial Advice.

Re: Technical Analysis by FXOpen

British Pound hits 1-month high against US Dollar
https://i.postimg.cc/Bvc0fTc0/img-009.png

Volatility within the British Pound has been a considerable point of interest recently, especially since the Pound bounced back during the early part of this quarter from a sustained period of decline against the Euro and US Dollar which took place for several months, beginning late last year.

Today, the British Pound is trading at the higher end of the 1.23 range against the US Dollar, which is two whole pence higher than this time one month ago.

The sudden upward movement of the British Pound against the US Dollar and its sustained climb during the course of the past month has been largely down to a lower confidence in the overall United States economy following the collapse of the Silicon Valley Bank, and some regional banks such as First Republic, demonstrating the contagion of toxicity among the banking sector in the US.

Whilst Credit Suisse is not an American bank, one of the many contributing factors toward its demise is that in 2021, Archegos Capital Management, a family office that managed the personal assets of Bill Hwang, at one time managing over $36 billion in assets, was assisted by Credit Suisse to establish itself in the United States.

Mr Huang had been banned from trading in Hong Kong and regardless of this, Credit Suisse helped him rebrand his hedge fund as Archegos and move it to New York, subsequent to which he lost $20 billion and was arrested on charges of fraud and racketeering. Of this, Credit Suisse was exposed to approximately $5.5 billion.

Whilst that may have taken place two years ago, it was one of the US Dollar-denominated catastrophes that led to the downfall of Credit Suisse, hence memories are long, and the US financial markets economy came under the spotlight during the demise of Credit Suisse, which took place just a short time after the demise of Silicon Valley Bank.

Now, with confidence in banking at a new low across the United States, investment in that sector is being approached with trepidation, and bank stocks listed on US exchanges declined in value.

The bank run which resulted in many people and companies withdrawing their funds from First Republic then escalated in that larger Tier 1 banks then began sending their customers money to the tune of $30 billion to First Republic to try to prop it up.

This is the type of practice which does not instil confidence at all.

Interestingly, the contagion has not reached the United Kingdom and there is no banking crisis on the British side of the Atlantic.

This could be a simple explanation for the Pound’s sudden strong performance against the US Dollar, especially given that all other factors relating to high levels of inflation, and rising interest rates still continue to affect both the British and American monetary policy – neither is out of those woods, but the banking strength appears to be higher in the United Kingdom than it does across the pond.

VIEW FULL ANALYSIS VISIT - FXOpen Blog...

Disclaimer: This Forecast represents FXOpen Companies opinion only, it should not be construed as an offer, invitation or recommendation in respect to FXOpen Companies products and services or as Financial Advice.

Re: Technical Analysis by FXOpen

Unbelievably, UK banks lead FTSE 100 gains
https://i.postimg.cc/GtBqthzk/img-009.png

What a fickle world we live in. Last week, America’s sudden focus on the collapse of Silicon Valley Bank and the contagion that surrounded it in which a run on some smaller banks took place, claiming the existence of First Republic.

This caused some major North American indices to drop as investor confidence in bank stocks waned, and then just a matter of weeks later, when Swiss bank Credit Suisse collapsed, the investors on the European side of the Atlantic began to worry about the stability of the banking system and the FTSE 100 index in London experienced a £76 billion reduction in the value of the stocks listed on it.

This reduction flew in the face of predictions just one month ago which asserted that the FTSE 100 index, which is the basket of stocks of the United Kingdom’s most prestigious blue chip companies listed on the London Stock Exchange, may reach 8,000 points.

Instead, it dipped to around 7,300, largely due to lack of confidence in bank stocks.

Today, however, a sudden surge in value has taken place this morning as the FTSE 100 suddenly rose from 7,470 to 7,520, with this increase being led by, rather remarkably, bank stocks!

Traditional manufacturing stocks have remained strong on the FTSE 100, such as drinks manufacturer Irn Bru, as well as house building companies such as Bellway Homes which is set to make an earnings announcement imminently, however the banks in the United Kingdom have now demonstrated that they have not been subject to the toxicity that has taken place in some parts of the United States.

In fact, not only have British banks demonstrated their relative stability and have not been affected by any contagion, but the British divisions of struggling or insolvent American banks are on a road to being potentially saved.

Bank of England Governor Andrew Bailey is set to appear before MPs on the rescue of the UK arm of Silicon Valley Bank. The relief rally was also helped by the deal earlier this week for First Citizens bank to rescue Silicon Valley Bank.

Barclays. NatWest, Lloyds Banking Group and HSBC all made further gains, of between 1% and 2% each. Overall, the FTSE 100 added 52 points to 7523.60, a rise of 0.7%.

Since the rally that took place during the early hours, the upward direction has stabilized slightly, however this is a positive position and fears over banking have been quelled.

VIEW FULL ANALYSIS VISIT - FXOpen Blog...

Disclaimer: This Forecast represents FXOpen Companies opinion only, it should not be construed as an offer, invitation or recommendation in respect to FXOpen Companies products and services or as Financial Advice.

Re: Technical Analysis by FXOpen

BTCUSD and XRPUSD Technical Analysis – 28th MAR 2023
https://i.postimg.cc/FzQ8MShY/btc.png

BTCUSD: Bearish Engulfing Pattern Below $28781

Bitcoin was unable to sustain its bullish momentum last week and after touching a high of $28781 on 22nd March, the price started to correct declining against the US dollar, touching a low of $26531 on 27th Mar.

We have seen a bearish opening of the markets this week.

We can clearly see a bearish engulfing pattern below the $28781 handle which is a bearish reversal pattern because it signifies the end of an uptrend and a shift towards a downtrend.

Bitcoin touched an intraday high of 27238 in the Asian trading session, and an intraday low of 26837 in the European trading session today.

The commodity channel index is giving a bearish divergence signal in the weekly time frame.

Both the STOCH and Williams percent range are indicating overbought levels which means that in the immediate short term, a decline in the prices is expected.

The Ichimoku price is under the cloud in the weekly time frame indicating a bearish trend.

The relative strength index is at 38.03 indicating a weak demand for bitcoin, and the continuation of the selling pressure in the markets.

Bitcoin is now moving below its 100 hourly simple moving average and above its 100 hourly exponential moving average.

Most of the major technical indicators are giving a sell signal, which means that in the immediate short term, we are expecting targets of 26000 and 25500.

The average true range is indicating less market volatility with a bearish momentum.

  • Bitcoin: bearish reversal seen below $28781.

  • The RSI remains below 50 indicating a bearish market.

  • The price is now trading below its pivot levels of $26998.

  • The short-term range is strongly BEARISH.

Bitcoin: Bearish Reversal Seen Below $28781
https://i.postimg.cc/zDn9nxkK/btcx.png

The price of Bitcoin was unable to cross the $29000 handle and we can see a sharp drop in the price which is now ranging below the $27000 level.

We are expecting more downsides in the range of $26000 and $25500 after which some market consolidation can be seen.

We can see the formation of the moving average bearish crossover pattern with the adaptive moving averages AMA50 and AMA100 in the daily time frame.

We have also detected the formation of a bearish Harami pattern in the 1-hour time frame.

The immediate short-term outlook for bitcoin is strongly bearish, the medium-term outlook has turned bearish, and the long-term outlook remains neutral under present market conditions.

Bitcoin’s support zone is located at $25261 which is a 38.2% retracement from a 4-week high, and at $26013 which is a 14-3 day raw stochastic at 70%.

The price of BTCUSD is now facing its classic support level of 26880 and Fibonacci support level of 26966 after which the path towards 26000 will get cleared.

In the last 24hrs, BTCUSD has decreased by 3.75% by 1045.42$ and has a 24hr trading volume of USD 18.647 billion. We can see an increase of 28.44% in the trading volume compared to yesterday, which appears to be normal.

The Week Ahead

We can see that bitcoin has changed tracks and is now moving under a continuous bearish pressure below the $27000 level.

The immediate target expected is $26000 after which we can see some consolidation in the zone of $25500 level.

The daily RSI is printing at 57.25 which indicates a neutral demand for bitcoin and the shift towards the consolidation phase in the medium-term range.

We can see the formation of a bearish trend line from $28781 towards the $26647 level.

The price of BTCUSD is now facing its resistance zone located at $27966 which is a 38.2% retracement from its 52-week low, and at $28029 3-10 day MACD oscillator stalls.

The weekly outlook is projected at $26000 with a consolidation zone of $25500.

VIEW FULL ANALYSIS VISIT - FXOpen Blog...

Disclaimer: This Forecast represents FXOpen Companies opinion only, it should not be construed as an offer, invitation or recommendation in respect to FXOpen Companies products and services or as Financial Advice.

Posts: 901 to 925 of 1,624

Pages Previous 1 35 36 37 38 39 65 Next

You must login or register to post a reply

Forex Software → Market Analysis → Technical Analysis by FXOpen

Similar topics in this forum