Hi Steve
Thanks for the post.
I thought I would add my two bobs worth....but I am only a newbie to this forum.
This post is more a 'food for thought' and is based on a few underlying assumptions that members can take with or without a pinch of salt. :-)
I tend to view markets through a prism of 'markets being very efficient' with only occasional alpha being made available through sporadic and generally unpredictable inefficiencies. Under this assumption I tend to throw my ability to predict future performance out with the bath water.
I do not pay much attention to OOS testing as in my opinion this is an outdated form of testing from back in the days when alternative methods of testing for robustness were not available. I prefer to invest nearly all my time in testing strategies across as broad a range of market conditions as I can find and in the rigorous Monte-Carlo testing of strategy parameters to identify the more robust strategies that can weather the storms of market uncertainty and varying market condition.
The only OOS testing I do is left for my native MT4 broker platform and over a relatively short period to ensure that there are no execution errors or technical issues with the data mined EA that I have generated.
The intent of my search is to simply find those strategies that in unfavourable conditions, do not detrimentally affect the overall portfolio in terms of any undue bias that the singular return stream of the strategy will impose on the collection.
What this means is that all my decisions at the individual strategy level are based on three requirements:
a) That during extended unfavourable conditions, the strategy (return stream) will be limited in it's drawdown impact on the overall portfolio;
b) That the individual return stream has positive expectancy overall (this is more a statement that the strategy has a good chance of having a slight edge); and
c) That the individual strategy offers correlation benefits to the overall portfolio and assists in reducing overall portfolio volatility.
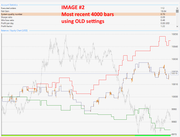
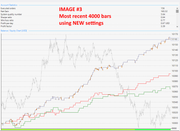
As far as the overall profitability of the strategy itself, I tend to pay little regard to this feature. That is where I would differ in opinion from your take that 'Too much historical data is harmful'.
There is good data and there is bad data. Data that is not relevant to your native broker platform is meaningless to me and is what I refer to as 'bad data'. What I mean by this is that available alpha is so light in an efficient market but there is so much variability in overall result from slight changes to data such as differences in bar open, variations in spread/swap, quality of historical data....etc etc etc...that the differences can be material to the overall result on the return stream (equity curve) of the strategy. Good data is therefore platform specific data history and as much as you can garner...but once again there will be significant material variations in the result if you are using constant assumptions in your results such as constant spread, swap, slippage etc.
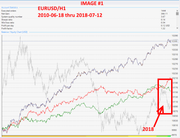
The reason for my preference for as much data history as I can get.... is less about data sample size (although this is generally a useful proxy for robustness)...... but more about ensuring that the strategy has been exposed to as many different market conditions as possible and of differing duration.
If the strategy still has positive expectancy overall (no matter how slight), but will assist in preserving capital, then you can keep this strategy 'turned on' all the time and be available for those unpredictable times when market conditions become favorable and you make hay while the sun shines.
The reason I diversify my portfolio is two fold:
1. Diversification of 'uncorrelated return streams is the major method used to make your portfolio robust and protect your finite capital from impacts of adverse volatility (namely drawdowns); and
2. Diversification of 'uncorrelated return streams' each with slight positive expectancy ensures that there is overall positive momentum in portfolio growth over time at most points in the time-series.
If you select your strategies from those that are performing well over recent times, there is a strong chance that you will be selecting from 'positively correlated' options. This is great when times are good....but exceptionally bad during unfavourable market conditions. Trading correlated return streams in your portfolio exacerbates portfolio volatility as each return stream amplifies positive growth and negative growth as there are all 'in phase'. By adopting this technique you will have to be right on the pulse with knowing when to 'turn on' or 'turn off' those strategies....which in my opinion is a predictive technique and always lagging in nature. There has been a lot of articles written on this topic of 'market timing' but very little success in this area. My preference is for strategies that are turned on all the time. To do this....you need an appreciation of what is 'acceptable limits' of volatility to your strategy so you are not tempted to interfere when entering drawdowns...as they are actually a necessity in the big picture. Benchmarks tend to be the way to go using your long term strategy metrics as the guidelines to assess strategy health during live trading periods.
Also there is a pretty well known 'mean reverting' phenomenon in fund management circles when selecting which funds to allocate your money to. When you have a selection of well established highly diversified long term funds to allocate your money towards, you actually select those funds that are recovering from a drawdown as opposed to those funds that are reaching new equity highs. This is counter to the idea that you should select the current best performing funds from the options available. The reason for this is that these funds have already passed the robustness challenge in that they are highly diversified AND they have stood the test of time over an array of market conditions. Once that challenge is achieved then the optimal times to re-balance your portfolio allocations dependent on when funds are recovering from a drawdown or when they are reaching new high water marks.
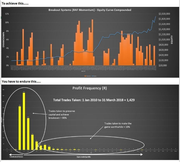
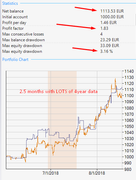
Anyway....here is the guide I use when looking at strategies generated by EA studio at the Monte Carlo phase of review.
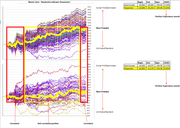
I tend to view the most likely scenario from the array of simulations generated by Monte Carlo testing as the median solution. This to me is a more probable result of return stream that would be generated by a particular class of strategy given the high sensitivity of the strategy to minor perturbations in market condition etc etc etc..
Your assumption about the nature of these markets will also influence this decision. For example I believe that the majority portion of any equity curve (which is a derivative signature of market condition) is attributed to market randomness. Under this viewpoint, a single 'best' equity curve is a misnomer and more a result of the way random results compile under optimisation to give you an optimal equity curve. My opinion is that there is only 'weak alpha' available in the markets which relates to the level of 'signals' in the noise and the degree of autocorrelation in the time series. The median choice of return stream from the alternative generations is the most 'probably' outcome of the series and gives a more realistic interpretation of the degree of 'signal in the noise'. The reason for the 'weak alpha statement' is that over long term horizons, the best fund managers in the world can only achieve a certain threshold performance that caps what is pipe dream and what is realistic. A long term CAGR of 15%-20% with commensurate drawdowns of 30-50% is about the best you can get over an extended performance period from the best of the best with heavy duty research teams. I just cannot find audited verifiable results that prove otherwise.
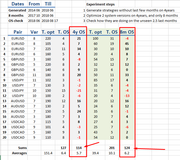
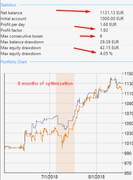
Anyway....back to the Monte Carlo array.......I then calculate an expected return from this median solution to ensure it still has slight positive expectancy and recognise that the optimised return stream is a very unlikely scenario going forward. What this does is two things:
1) It reduces future expectations to more realistic live trading conditions; and
2) It provides a broad idea of the likely volatility of that return stream and it's degree of 'edge' that you can then use for portfolio construction using correlation as your guide.
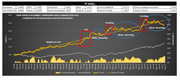
I then superimpose the expected return stream profile over other strategies in my potential collection to ensure they are either anti-correlated or non-correlated.
This is a critical step in the portfolio construction process as your portfolio composite must be balanced with different return stream signatures to ensure there is no undue bias that will contribute to exacerbated drawdowns.
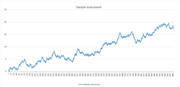
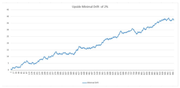
Through this method of portfolio construction the aim is to generate your linear upward sloping equity curve by inclusion of individual strategies that have different strengths and weaknesses but in composite mutually work together to create the ultimate blended solution that reduced overall volatility and improves the risk-weighted return.
Once this is achieved you can then go to step two and accelerate these results using position sizing methods that give far greater bang for buck than what could otherwise be achieved by a single strategy solution.
.....anyway...some food for thought.
Cheers
Rich