Re: NPBFX - making money with us since 1996!

NZD/USD: New Zealand dollar is in the correction 28.11.2018

Good afternoon, dear forum visitors!

NPBFX offers the latest release of analytics on NZD/USD for a better understanding of the current market situation and more efficient trading.

Current trend

Yesterday, NZD rose against USD, continuing the development of the corrective “bullish” impulse formed at the beginning of the week, due to quite strong data on New Zealand exports and a weak US macroeconomic background.

Thus, in October, exports from New Zealand increased from 4.25 billion dollars to 4.86 billion, which was slightly better than the average market forecasts. Imports increased even more: from 5.85 billion dollars to $6.15 billion, which led to a worsening of the trade deficit. The October figure reached –5.79 billion YoY against –5.33 billion YoY in September.

Today, the pair is strengthening, waiting for new drivers to appear. Investors are focused on the speech of the head of the RBNZ, Adrian Orr, and a block of US statistics, followed by the speech of the Fed Governor Jerome Powell.

Support and resistance

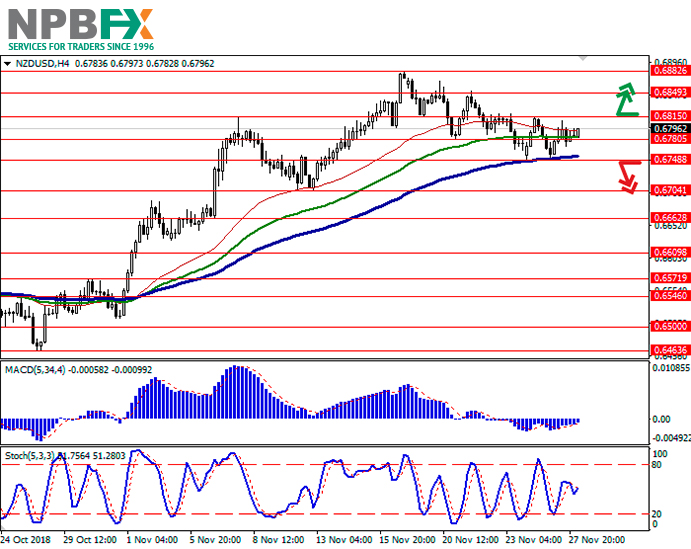
On the daily chart, Bollinger bands reverse horizontally. The price range narrows, reflecting the ambiguous trade nature of the recent days. MACD indicator is reversing upwards, keeping the sell signal (the histogram is below the signal line). The dynamics of Stochastic are similar, which indicates the potential for the development of corrective growth in the super-short term.

It is better to wait for the final formation of the "bullish" signal.

Resistance levels: 0.6815, 0.6849, 0.6882.

Support levels: 0.6760, 0.6748, 0.6704, 0.6662.
http://businesspr-finance.com/wp-content/uploads/2018/11/6-5.jpg

http://businesspr-finance.com/wp-content/uploads/2018/11/7-5.jpg

Trading tips

Long positions can be opened after the breakout of the level of 0.6815 with the target at 0.6882 or 0.6900. Stop loss is 0.6780.

Short positions can be opened after the breakdown of the level of 0.6748 with the targets at 0.6662–0.6650. Stop loss is 0.6780.

Implementation period: 2–3 days.

Use more opportunities of the NPBFX analytical portal:E-book.

If you just recently started to be interested in trading on FOREX and would like to deepen your knowledge, an electronic Beginner's Guide to FOREX Trading will be an excellent helper for you here. The book consists of 5 chapters and reflects fundamental concepts of the foreign exchange market to start successful trading. From the main chapters of the E-book you can learn about the concepts and history of FOREX, currencies and trend lines, technical indicators, types of orders, trading on news, psychology of trading, risk management and much more.

You can read a Beginner's guide to FOREX Trading online or download it free of charge from the NPBFX analytical portal in the "Education" section. In order to get unlimited access to the E-book and other useful instruments on the portal, you need to register on the NPBFX website.

If you have any questions about trading instruments, you can always ask an analyst in the online chat on the portal and get a free consultation of an experienced specialist.

Use the current recommendations of analysts on NZD/USD and trade efficiently with NPBFX.
Re: NPBFX - making money with us since 1996!

AUD/USD: wave analysis 30.11.2018

Good afternoon, dear forum visitors!

NPBFX offers the latest release of analytics on AUD/USD for a better understanding of the current market situation and more efficient trading.

The pair may grow.

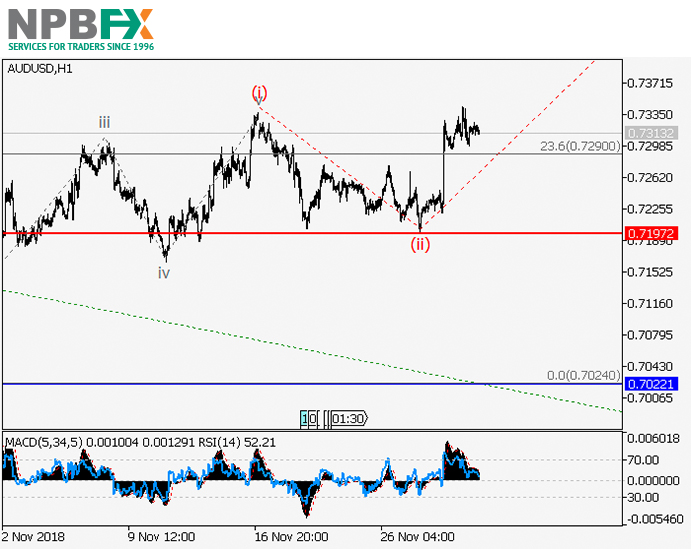
On the 4-hour chart, the upward correction develops as a wave 2 of (5). Now wave a of 2 is developing, within which the waves (i) and (ii) of a have formed. If the assumption is correct, the pair will grow to the levels of 0.7450–0.7587. In this scenario, critical stop loss level is 0.7197.

http://businesspr-finance.com/wp-content/uploads/2018/11/5-6.jpg

http://businesspr-finance.com/wp-content/uploads/2018/11/6-6.jpg

Main scenario

Long positions will become relevant during the correction, above the level of 0.7197 with the targets at 0.7450–0.7587. Implementation period: 7 days and more.

Alternative scenario

The breakdown and the consolidation of the price below the level of 0.7197 will let the pair go down to the levels of 0.7020–0.6950.

Use more opportunities of the NPBFX analytical portal: glossary.

Beginning traders certainly face a lot of specialized concepts and lexicon on FOREX, which are often not fully been understood. Swap, tick, hedge, margin calls are often unfamiliar to beginning traders. But the lack of knowledge of these fundamentals make a competent market vision impossible. So glossary on the NPBFX analytical portal could be an excellent helper in this case, which contains all the main definitions with explanations in a compact and accessible form. All concepts are arranged in alphabetical order, so that you can easily and quickly find and explore a new concept for yourself.

If you have any questions about trading instruments, you can always ask an analyst in the online chat on the portal and get a free consultation of an experienced specialist.

Use the current recommendations of analysts on AUD/USD and trade efficiently with NPBFX.

Re: NPBFX - making money with us since 1996!

GBP/USD: wave analysis 03.12.2018

Good afternoon, dear forum visitors!

NPBFX offers the latest release of analytics on GBP/USD for a better understanding of the current market situation and more efficient trading.

The pair may decrease.

On the 4-hour chart, the downward correction of the higher level develops as a wave 2. Now the wave C of 2 is developing, within which the fifth wave of the lower level v of C is forming. If the assumption is correct, the pair will fall to the level of 1.2600. In this scenario, critical stop loss level is 1.2850.

http://businesspr-finance.com/wp-content/uploads/2018/12/3.jpg

http://businesspr-finance.com/wp-content/uploads/2018/12/4.jpg

Short positions will become relevant during the correction, below the level of 1.2850 with the target at 1.2600. Implementation period: 5–7 days.

Alternative scenario

The breakout and the consolidation of the price above the level of 1.2850 will let the pair grow to the level of 1.3305.

Use more opportunities of the NPBFX analytical portal: economic indicators

Regular monitoring of global economic indicators plays an important role in trading, because of their strong influence on FOREX market and possibility to provoke significant price fluctuations. For the convenience of traders the "Education" section on the NPBFX portal contains the most popular and significant world economic indices with a detailed description, their possible impact on the economy and exchange rates (GDP, consumer price index, unemployment rate, Nonfarm Payrolls (NFP), etc.).

If you have any questions about trading instruments, you can always ask an analyst in the online chat on the portal and get a free consultation of an experienced specialist.

Use the current recommendations of analysts on GBP/USD and trade efficiently with NPBFX.

Re: NPBFX - making money with us since 1996!

EUR/USD: wave analysis 06.12.2018

Good afternoon, dear forum visitors!

NPBFX offers the latest release of analytics on EUR/USD for a better understanding of the current market situation and more efficient trading.

The pair may grow.

On the 4-hour chart, a downward correction of the higher level develops as a wave (2), within which the wave C of (2) forms. Now an upward correction is developing as a second wave ii of C, within which the wave (c) of iii is developing. If the assumption is correct, the pair will grow to the levels of 1.1511–1.1586. In this scenario, critical stop loss level is 1.1266.

http://businesspr-finance.com/wp-content/uploads/2018/12/5.jpg

http://businesspr-finance.com/wp-content/uploads/2018/12/6.jpg

Main scenario

Long positions will become relevant during the correction, above the level of 1.1266 with the targets at 1.1511–1.1586. Implementation period: 5–7 days.

Alternative scenario

The breakdown and the consolidation of the price below the level of 1.1266 will let the pair go down to the levels of 1.1200–1.1150.

Use more opportunities of the NPBFX analytical portal: analytics.

You can find more actual analytical reviews on other popular currency pairs, metals and CFDs on the NPBFX online portal. Daily analytics with charts, current market prognoses and trading scenarios in the Feed section are available. Get free and unlimited access to the online portal after registering on the official website of NPBFX Company.

If you have any questions about trading instruments, you can always ask an analyst in the online chat on the portal and get a free consultation of an experienced specialist.

Use the current recommendations of analysts on EUR/USD and trade efficiently with NPBFX.

Re: NPBFX - making money with us since 1996!

USD/JPY: wave analysis 07.12.2018

Good afternoon, dear forum visitors!

NPBFX offers the latest release of analytics on USD/JPY for a better understanding of the current market situation and more efficient trading.

The pair may fall.

On the 4-hour chart, a local downward correction of the higher level develops as the wave 2 of (C). Now the wave c of 2 is forming, within which the third wave of the lower level (iii) of c is developing. If the assumption is correct, the pair will fall to the level of 111.35. In this scenario, critical stop loss level is 113.83.

http://businesspr-finance.com/wp-content/uploads/2018/12/8-1.jpg

http://businesspr-finance.com/wp-content/uploads/2018/12/9-1.jpg

Main scenario

Short positions will become relevant during the correction, below the level of 113.83 with the target at 111.35. Implementation period: 7 days and more.

Alternative scenario

The breakout and the consolidation of the price above the level of 113.83 will let the pair grow to the level of 115.50.

Use more opportunities of the NPBFX analytical portal: E-book.

If you just recently started to be interested in trading on FOREX and would like to deepen your knowledge, an electronic Beginner's Guide to FOREX Trading will be an excellent helper for you here. The book consists of 5 chapters and reflects fundamental concepts of the foreign exchange market to start successful trading. From the main chapters of the E-book you can learn about the concepts and history of FOREX, currencies and trend lines, technical indicators, types of orders, trading on news, psychology of trading, risk management and much more.

You can read a Beginner's guide to FOREX Trading online or download it free of charge from the NPBFX analytical portal in the "Education" section. In order to get unlimited access to the E-book and other useful instruments on the portal, you need to register on the NPBFX website.

If you have any questions about trading instruments, you can always ask an analyst in the online chat on the portal and get a free consultation of an experienced specialist.

Use the current recommendations of analysts on USD/JPY and trade efficiently with NPBFX.

Re: NPBFX - making money with us since 1996!

USD/CHF: wave analysis 10.12.2018

Good afternoon, dear forum visitors!

NPBFX offers the latest release of analytics on USD/CHF for a better understanding of the current market situation and more efficient trading.

The probability of downward movement remains.

On the H4 chart, the downward correction of the higher level is developing as a wave (2), which includes the formation of the wave C of (2). At the moment, it seems that the local correction as a wave ii of C was completed, and the third wave iii of C has begun. If the assumption is correct, the pair will continue to decline to the levels of 0.9724–0.9618. The critical level for this scenario is 1.0008.

http://businesspr-finance.com/wp-content/uploads/2018/12/7-1.jpg

http://businesspr-finance.com/wp-content/uploads/2018/12/8-2.jpg

Main scenario

Short positions will become relevant below the level of 1.0008 with a target in the range of 0.9724–0.9618. Implementation period: 7+ days.

Alternative scenario

Breakout and consolidation of the price above the level of 1.0008 will allow the pair to rise to the level of 1.0122.

Use more opportunities of the NPBFX analytical portal:economic calendar.

Be ready for any market changes through global events using the economic calendar on the NPBFX portal. The calendar contains all the most important events of the world economy and prognoses for them. In order to get free and unlimited access to the economic calendar and other useful instruments on the portal, you need to pass a one-time registration on the NPBFX website.

If you have any questions about trading instruments, you can always ask an analyst in the online chat on the portal and get a free consultation of an experienced specialist.

Use the current recommendations of analysts on USD/CHF and trade efficiently with NPBFX.

Re: NPBFX - making money with us since 1996!

NZD/USD: New Zealand dollar strengthens 12.12.2018

Good afternoon, dear forum visitors!

NPBFX offers the latest release of analytics on NZD/USD for a better understanding of the current market situation and more efficient trading.

Current trend

NZD showed uncertain growth against USD on Tuesday, having corrected after four "bearish" sessions in a row. Active "bullish" dynamics can be traced during the Asian session on December 12.

The traders are focused on US-China trade talks. Despite the condemnation by the Chinese side of the arrest of Huawei CFO Meng Wanzhou, there was no breakdown in the negotiations. Yesterday, Liu He, Vice-Premier of the State Council of the People's Republic of China, Stephen Mnuchin, the US Treasury, and Robert Lighthizer, the American sales representative, held telephone talks to discuss the supply of American agricultural products to China and the changes in support of Chinese industry "Made in China 2025". A schedule for further trade advice was also reviewed. Recall that on the eve of Lighthizer, citing President Donald Trump, said that the agreement with Beijing should be concluded before March 1, otherwise a new increase in US export duties is likely.

Support and resistance

Bollinger Bands in D1 chart show stable growth. The price range is narrowing, reflecting the ambiguous nature of trading of recent days. MACD is reversing upwards preserving a sell signal (located below the signal line). Stochastic has reversed upwards near its minimum levels, indicating a sufficient potential for the development of the corrective growth in the short and/or ultra-short term.

The development of "bullish" trend is possible in the near future.

Resistance levels: 0.6910, 0.6940, 0.6968, 0.7000.

Support levels: 0.6865, 0.6838, 0.6815, 0.6780.

http://businesspr-finance.com/wp-content/uploads/2018/12/7-2.jpg

http://businesspr-finance.com/wp-content/uploads/2018/12/8-3.jpg

Trading tips

To open long positions, one can rely on the breakout of 0.6910. Take profit — 0.6968 or 0.7000. Stop loss — 0.6880.

A breakdown of 0.6865 with the target at 0.6815 or 0.6800 could be an alternative. Stop loss — 0.6890.

Implementation period: 2-3 days.

Use more opportunities of the NPBFX analytical portal:trading signals.

Make right trade decisions on sell or buy USD/CAD and other popular instruments using trading signals on the NPBFX portal. All registered users have free access to signals from the top 10 trading indicators (MA10, BBands, Ichimoku, Stochastic, ZigZag, etc.) with also general recommendations on the portal.

If you have any questions about trading instruments, you can always ask an analyst in the online chat on the portal and get a free consultation of an experienced specialist.

Use the current recommendations of analysts on NZD/USD and trade efficiently with NPBFX.

Re: NPBFX - making money with us since 1996!

GBP/USD: wave analysis 14.12.2018

Good afternoon, dear forum visitors!

NPBFX offers the latest release of analytics on GBP/USD for a better understanding of the current market situation and more efficient trading.

The probability of decline is still strong.

On the 4-hour chart, a downward correction of the higher level is being developed as wave 2. At the moment, it is likely that wave C of 2 is being developed, within which the fifth wave of the lower level v of C is being formed. The pair will probably reach the levels of 1.2475–1.2412. The critical level for this scenario is 1.2763.

http://businesspr-finance.com/wp-content/uploads/2018/12/5-3.jpg

http://businesspr-finance.com/wp-content/uploads/2018/12/6-4.jpg

Main scenario

Short positions will become relevant below the level of 1.2763 with a target in the range of 1.2475-1.2412. Implementation period: 5-7 days.

Alternative scenario

Breakout and consolidation of the price above the level of 1.2763 will let the pair grow to the level of 1.2933.

Use more opportunities of the NPBFX analytical portal:glossary.

Beginning traders certainly face a lot of specialized concepts and lexicon on FOREX, which are often not fully been understood. Swap, tick, hedge, margin calls are often unfamiliar to beginning traders. But the lack of knowledge of these fundamentals make a competent market vision impossible. So glossary on the NPBFX analytical portal could be an excellent helper in this case, which contains all the main definitions with explanations in a compact and accessible form. All concepts are arranged in alphabetical order, so that you can easily and quickly find and explore a new concept for yourself.

If you have any questions about trading instruments, you can always ask an analyst in the online chat on the portal and get a free consultation of an experienced specialist.

Use the current recommendations of analysts on GBP/USD and trade efficiently with NPBFX.

Re: NPBFX - making money with us since 1996!

USD/CAD: wave analysis 17.12.2018

Good afternoon, dear forum visitors!

NPBFX offers the latest release of analytics on USD/CAD for a better understanding of the current market situation and more efficient trading.

The pair is likely to grow.

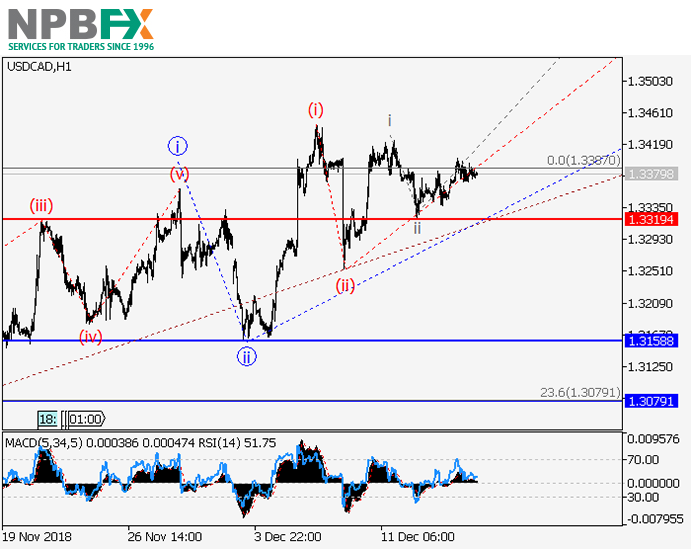
On the H4 graph, the third wave of the senior level 3 is developing. At the moment, it is likely that the third wave of the junior level iii of 3 is being formed, within which waves (i) and (ii) have ended. If the assumption is correct, the pair will continue to grow to the level of 1.3700 within wave (iii) of iii. The critical level for this scenario is 1.3319.

http://businesspr-finance.com/wp-content/uploads/2018/12/usdcad17122018.png

http://businesspr-finance.com/wp-content/uploads/2018/12/usdcad17122018-1.png

http://businesspr-finance.com/wp-content/uploads/2018/12/usdcad17122018-3.png

Main scenario

Long positions will become relevant above the level of 1.3319 with the target of 1.3700. Implementation period: 7+ days.

Alternative scenario

Breakdown and consolidation of the price below the level of 1.3319 will allow the pair to decline to the levels of 1.3158–1.3079.

Use more opportunities of the NPBFX analytical portal: economic indicators

Regular monitoring of global economic indicators plays an important role in trading, because of their strong influence on FOREX market and possibility to provoke significant price fluctuations. For the convenience of traders the "Education" section on the NPBFX portal contains the most popular and significant world economic indices with a detailed description, their possible impact on the economy and exchange rates (GDP, consumer price index, unemployment rate, Nonfarm Payrolls (NFP), etc.).

If you have any questions about trading instruments, you can always ask an analyst in the online chat on the portal and get a free consultation of an experienced specialist.

Use the current recommendations of analysts on USD/CAD and trade efficiently with NPBFX.

Re: NPBFX - making money with us since 1996!

USD/CHF: the instrument moves horizontally 19.12.2018

Good afternoon, dear forum visitors!

NPBFX offers the latest release of analytics on USD/CHF for a better understanding of the current market situation and more efficient trading.

Current trend

Yesterday, USD moved horizontally against CHF.

The possibility of a coming slowdown in the growth of the Fed’s interest rates affects USD negatively. However, on Tuesday, the US currency was supported by data from American construction market. In November, Building Permits number increased from 1.264 million to 1.328 million, which was much better than the negative forecast of 1.259 million. November Housing Starts indicator also rose from 1.217 to 1.256 million, while the experts forecasted growth only to 1.225 million

CHF is under pressure from the updated SECO Swiss economic outlook: GDP growth in 2018 and 2019 will decline due to weak domestic demand. It is expected that in 2019, GDP will grow by 1.5%, and in 2020 – by 1.7%.

Support and resistance

On the daily chart, Bollinger bands are moderately reducing. The price range narrows from above, reflecting the development of the flat trade dynamics. MACD indicator falls, keeping a weak sell signal (the histogram is below the signal line). Stochastic is falling more actively is rapidly approaching its lows, reflecting that the instrument can become oversold soon.

It is better to wait until the situation is clear.

Resistance levels: 0.9936, 0.9951, 0.9980, 1.0000.

Support levels: 0.9898, 0.9861, 0.9836.

http://businesspr-finance.com/wp-content/uploads/2018/12/6-6.jpg

http://businesspr-finance.com/wp-content/uploads/2018/12/7-4.jpg

Trading tips

Long positions can be opened after the breakout of the levels of 0.9936–0.9951 with the target at 1.0000. Stop loss is 0.9920–0.9900.

Short positions can be opened after the breakdown of the level of 0.9898 with the targets at 0.9836–0.9820. Stop loss is 0.9930.

Implementation period: 2–3 days.

Use more opportunities of the NPBFX analytical portal:economic calendar.

Be ready for any market changes through global events using the economic calendar on the NPBFX portal. The calendar contains all the most important events of the world economy and prognoses for them. In order to get free and unlimited access to the economic calendar and other useful instruments on the portal, you need to pass a one-time registration on the NPBFX website.

If you have any questions about trading instruments, you can always ask an analyst in the online chat on the portal and get a free consultation of an experienced specialist.

Use the current recommendations of analysts on USD/CHF and trade efficiently with NPBFX.

286 (edited by Antony_NPBFX 2018-12-21 14:25:20)

Re: NPBFX - making money with us since 1996!

Interview with the winner of November Battle of Traders contest from NPBFX

http://businesspr-finance.com/wp-content/uploads/2018/12/777.jpg

The first Battle of Traders is successfully completed, opening the first page in the history of the contest. And for the winner of the contest, Vladimir from Krasnodar, a big way on Forex is just starting. Vladimir gave a short interview to NPBFX to share the secret of his trading system, his thoughts about other participants and emotions from his victory.

1. Vladimir, NPBFX congratulates you with a deserved victory and excellent trading results!

- Thanks!)

2. How did you know about the Battle of Traders in NPBFX? Why did you decide to participate?

- I’ve found the contest on the Internet by searching "contests for traders".  Then I checked the contest terms on the NPBFX website and registered as a participant.

3. What emotions did you experience when you got information about your double victory: $1000 on a trading account and a special prize - the newest iPhone Xs?

- When I only started participating and saw the requirements to get an iPhone, I thought it was unreal! Increasing initial deposit minimum up to 50 times seemed to me an overstated requirement. But when I saw myself in the first place - it was something very special, emotions generally overwhelmed!
By the end of the last trading week I’ve managed to increase my account up to 50 times, so it was really hard for other participants to compete with me. I can compare my feelings at that moment with the day when my child was born!

4. That’s really great! Vladimir, what helped you to win? What are the main parts of your success?

- Patience and non-greed. I will explain. When trend goes your way and your profit grows, many traders want to get another 5-7 points, then more and more. But I stop and close the trade after reaching the goal, taking my profit and waiting patiently for the next moment to enter the market.

5. So I can see that you have no problems with trading psychology. You have shown an excellent trading result for the trading month: $253’222 with initial $5’000! Please, tell us a little about your trading system.

- I try to work from the levels of resistance and support in the crossing trading sessions: from Asia to Europe, from Europe to America.

6. Did you have any specific trading strategy referring to the results of other participants of the contest?

- Of course! This is the value of the competition. When you trade, you can evaluate yourself only by your trading result. And when you see others’ trading, you start asking questions: “Why is he better than me? Why does someone do it and I don’t?”
I remember how I was surprised in the first days of the contest that other participants already had 23 trades, 30 trades, 46 trades! I had only 7 trades on my account then. It was very interesting what strategy did they use, how did they work, did they monitor or use scalping?

7. The Battle of traders is a monthly contest in NPBFX. Are you planning to participate further?

- Definitely, yes. Even if I had finished at 101 place, I would got upset, but would participate again, hoping to win. And I wonder if I could succeed again. Today I have two goals. The first is to start working on a real NPBFX trading account and the second is to participate in the December Battle of Traders.

8. Vladimir, it would be great for traders who also took part in the contest to know more about you as a person. Please, tell us briefly about yourself (in which city you live, your age, profession, family, how long you are in Forex)?

- I’m 57 years old, live in Krasnodar with my family. I have a higher military education, but now I’m retired and work as a warehouse manager. I’m happy to have not only children, but already grandchildren. As for the Forex market, I have been trying it for about 5 years. Serious trading is being only for about 1.5 years.

9. What recommendations would you give to traders who take part in the December Battle of Traders?

- In my opinion, any trader who wants to succeed in such a fast changing financial market as Forex should not panic and be patient. The second advice is to set a goal and go there, do not turn either left or right. Then you will succeed!

10. Thank you for the good advice for our traders. Do you have any suggestions for NPBFX?

- I wish you prosperity, of course, and reaching understanding with clients in all situations. Want to sincerely thank NPBFX for an interesting and fair contest for traders!

Vladimir, thank you for participating in our contest and interesting interview. NPBFX wishes you new victories and achievements in the financial markets!

Re: NPBFX - making money with us since 1996!

XAU/USD: gold prices are rising 24.12.2018

Good afternoon, dear forum visitors!

NPBFX offers the latest release of analytics on XAU/USD for a better understanding of the current market situation and more efficient trading.

Current trend

Gold prices resumed fairly steady growth during today's Asian session, approaching local highs updated on December 20 again. The instrument is supported by the situation around a possible slowdown in the tightening of the monetary policy of the US Federal Reserve.

After the December interest rate increase, most of the managers of the regulator said that next year the rate will be raised only twice.

In addition, investors continue to monitor the situation around the US-China trade relations and the growth of domestic political pressure in the United States. In particular, over the weekend, the Republican Party, led by Donald Trump, was not able to achieve the allocation of USD 5 billion for the project to build a wall on the border with Mexico. The US President said he would not sign such a budget, which led to the government shutdown once again.

Support and resistance

Bollinger Bands in D1 chart show moderate growth. The price range is expanding, but it fails to catch the development of "bullish" trend at the moment. MACD indicator is growing preserving a moderate buy signal (located above the signal line). Stochastic also keeps the uptrend, but approaches its maximum levels, which indicates the risks associated with overbought gold in the short and ultra-short term.

Existing "bullish" positions should be kept until the situation clears up.

Resistance levels: 1266.26, 1270.11, 1276.87.

Support levels: 1260.75, 1257.82, 1253.72, 1250.66.

http://businesspr-finance.com/wp-content/uploads/2018/12/xauusd22112018-55.png

http://businesspr-finance.com/wp-content/uploads/2018/12/xauusd22112018-66.png

Trading tips

To open long positions, one can rely on the breakout of 1266.26. Take profit — 1276.87. Stop loss — 1260.75.

A breakdown of 1257.82 may be a signal to further sales with target at 1250.66 or 1247.00. Stop loss — 1264.00.

Implementation period: 2-3 days.

Use more opportunities of the NPBFX analytical portal: E-book.

If you just recently started to be interested in trading on FOREX and would like to deepen your knowledge, an electronic Beginner's Guide to FOREX Trading will be an excellent helper for you here. The book consists of 5 chapters and reflects fundamental concepts of the foreign exchange market to start successful trading. From the main chapters of the E-book you can learn about the concepts and history of FOREX, currencies and trend lines, technical indicators, types of orders, trading on news, psychology of trading, risk management and much more.

You can read a Beginner's guide to FOREX Trading online or download it free of charge from the NPBFX analytical portal in the "Education" section. In order to get unlimited access to the E-book and other useful instruments on the portal, you need to register on the NPBFX website.

If you have any questions about trading instruments, you can always ask an analyst in the online chat on the portal and get a free consultation of an experienced specialist.

Use the current recommendations of analysts on XAU/USD and trade efficiently with NPBFX.

Re: NPBFX - making money with us since 1996!

GBP/USD: wave analysis 28.12.2018

Good afternoon, dear forum visitors!

NPBFX offers the latest release of analytics on GBP/USD for a better understanding of the current market situation and more efficient trading.

The pair may grow.

On the 4-hour chart, the wave C of (2) developed as a wedge, within which the fifth wave v of C formed. Now the first wave of the lower level i of (i) and the correction ii of (i) have formed. If the assumption is correct, the pair will grow to the levels of 1.2932–1.3175. In this scenario, critical stop loss level is 1.2470.

http://businesspr-finance.com/wp-content/uploads/2018/12/6-9.jpg

http://businesspr-finance.com/wp-content/uploads/2018/12/7-7.jpg

Main scenario

Long positions will become relevant during the correction, above the level of 1.2470 with the targets at 1.2932–1.3175. Implementation period: 7 days and more.

Alternative scenario

The breakdown and the consolidation of the price below the level of 1.2470 will let the pair go down to the level of 1.2353.

Use more opportunities of the NPBFX analytical portal: analytics.

You can find more actual analytical reviews on other popular currency pairs, metals and CFDs on the NPBFX online portal. Daily analytics with charts, current market prognoses and trading scenarios in the Feed section are available. Get free and unlimited access to the online portal after registering on the official website of NPBFX Company.

If you have any questions about trading instruments, you can always ask an analyst in the online chat on the portal and get a free consultation of an experienced specialist.

Use the current recommendations of analysts on GBP/USD and trade efficiently with NPBFX.

Re: NPBFX - making money with us since 1996!

AUD/USD: technical analysis 31.12.2018

Good afternoon, dear forum visitors!

NPBFX offers the latest release of analytics on AUD/USD for a better understanding of the current market situation and more efficient trading.

AUD/USD, D1

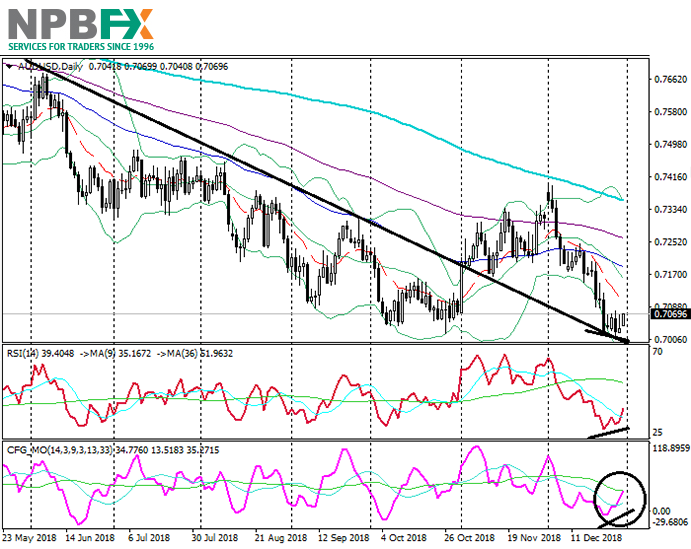
On the daily chart, the pair is trading in the lower Bollinger band. The price remains below its moving averages that are directed down. The RSI is growing, having formed a Bullish divergence with the price. The Composite is showing similar dynamics.

http://businesspr-finance.com/wp-content/uploads/2018/12/audusd31122018-55.png

AUD/USD, H4

On the 4-hour chart, the pair is trading in the upper Bollinger band. The price remains below the EMA65, EMA130 and SMA200 that are directed down. The RSI is growing, having broken out its longer MA. The is showing similar dynamics.

http://businesspr-finance.com/wp-content/uploads/2018/12/audusd31122018-56.png

Key levels

Support levels: 0.7015 (local lows), 0.6910 (September 2015 lows), 0.6830 (January 2016 lows).

Resistance levels: 0.7070 (local highs), 0.7100 (local highs), 0.7175 (local highs).

Trading tips

The price is testing its strong support near 0.7015. There is a chance of an upward correction.

Long positions can be opened from the level of 0.7100 with the target at 0.7175 and stop-loss at 0.7070. Validity – 3-5 days.

Short positions can be opened from the level of 0.7015 with targets at 0.6910, 0.6830 and stop-loss at 0.7070. Validity – 3-5 days.

Use more opportunities of the NPBFX analytical portal:trading signals.

Make right trade decisions on sell or buy USD/CAD and other popular instruments using trading signals on the NPBFX portal. All registered users have free access to signals from the top 10 trading indicators (MA10, BBands, Ichimoku, Stochastic, ZigZag, etc.) with also general recommendations on the portal.

If you have any questions about trading instruments, you can always ask an analyst in the online chat on the portal and get a free consultation of an experienced specialist.

Use the current recommendations of analysts on AUD/USD and trade efficiently with NPBFX.

Re: NPBFX - making money with us since 1996!

USD/CHF: wave analysis 02.01.2019

Good afternoon, dear forum visitors!

NPBFX offers the latest release of analytics on USD/CHF for a better understanding of the current market situation and more efficient trading.

The probability of the pair reducing remains.

On the 4-hour chart, the downward correction of the higher level continues to develop as a wave (2), which includes the formation of the wave C of (2). At the moment, the third wave iii of C is forming, within which the wave of the lower level (iii) of iii is developing. If the assumption is right, the decline of the pair will continue to the levels of 0.9724–0.9618. The level of 0.9879 is critical and stop loss for this scenario.

http://businesspr-finance.com/wp-content/uploads/2019/01/66.jpg

http://businesspr-finance.com/wp-content/uploads/2019/01/77.jpg

Main scenario

Short positions are relevant from the corrections below level of 0.9879 with the targets at 0.9724–0.9618. Implementation time: 7 days and more.

Alternative scenario

The breakout and the consolidation of the price above the level of 0.9879 will let the pair grow to the level of 0.9963.

Use more opportunities of the NPBFX analytical portal: economic indicators.

Regular monitoring of global economic indicators plays an important role in trading, because of their strong influence on FOREX market and possibility to provoke significant price fluctuations. For the convenience of traders the "Education" section on the NPBFX portal contains the most popular and significant world economic indices with a detailed description, their possible impact on the economy and exchange rates (GDP, consumer price index, unemployment rate, Nonfarm Payrolls (NFP), etc.).

If you have any questions about trading instruments, you can always ask an analyst in the online chat on the portal and get a free consultation of an experienced specialist.

Use the current recommendations of analysts on USD/CHF and trade efficiently with NPBFX.

291 (edited by Antony_NPBFX 2019-01-04 10:07:34)

Re: NPBFX - making money with us since 1996!

NZD/USD: technical analysis 04.01.2019

Good afternoon, dear forum visitors!

NPBFX offers the latest release of analytics on NZD/USD for a better understanding of the current market situation and more efficient trading.

NZD/USD, D1

On the daily chart, the instrument is trading at the bottom of Bollinger bands. Key support level is 0.6625. The indicator is directed downwards, and the price range has widened, confirming the downward trend. MACD histogram is in the negative zone, keeping a sell signal. Stochastic does not give a signal to enter the market.

http://businesspr-finance.com/wp-content/uploads/2019/01/99.jpg

NZD/USD, H4

On the 4-hour chart, the instrument consolidated at the top of Bollinger bands but is still testing the support level of 0.6682. The indicator is directed downwards, the price range remains quite wide, indicating a continuation of the downward trend. MACD histogram is in the negative zone, keeping a sell signal. Stochastic leaves the overbought area, forming a sell signal.

http://businesspr-finance.com/wp-content/uploads/2019/01/88.jpg

Key levels

Resistance levels: 0.6737, 0.6777, 0.6822, 0.6855, 0.6914.

Support levels: 0.6682, 0.6653, 0.6625, 0.6591, 0.6536.

Trading tips

Short positions can be opened from the current level with the target at 0.6625 and stop loss 0.6720.

Long positions can be opened above the level of 0.6740 with the target at 0.6810 and stop loss 0.6715.

Implementation period: 1–3 days.

Use more opportunities of the NPBFX analytical portal: glossary

Beginning traders certainly face a lot of specialized concepts and lexicon on FOREX, which are often not fully been understood. Swap, tick, hedge, margin calls are often unfamiliar to beginning traders. But the lack of knowledge of these fundamentals make a competent market vision impossible. So glossary on the NPBFX analytical portal could be an excellent helper in this case, which contains all the main definitions with explanations in a compact and accessible form. All concepts are arranged in alphabetical order, so that you can easily and quickly find and explore a new concept for yourself.

If you have any questions about trading instruments, you can always ask an analyst in the online chat on the portal and get a free consultation of an experienced specialist.

Use the current recommendations of analysts on NZD/USD and trade efficiently with NPBFX.

Re: NPBFX - making money with us since 1996!

EUR/USD: general analysis 07.01.2019

Good afternoon, dear forum visitors!

NPBFX offers the latest release of analytics on EUR/USD for a better understanding of the current market situation and more efficient trading.

Current trend

Today, amid the weakening dollar, the EUR/USD pair has grown and reached the level of 1.1421. Data from Germany was ambiguous and did not support the price: Retail Sales grew by 1.1% MoM and by 1.4% YoY, Factory Orders declined by 1.0%.

On Monday, investors will pay attention to the publication of data on retail sales in the Eurozone at 12:00 (GMT+2), which is predicted to fall to 0.2% in November from 0.3% in the previous month. In general, confirming forecasts can affect the instrument negatively. In the US, ISM Non-Manufacturing New Orders and Factory Orders data will be released at 17:00 (GMT+2). The market predicts moderate volatility.

Support and resistance

On the 4-hour chart, the pair is trading around the middle line of Bollinger bands, the indicator cloud is narrowing. MACD histogram is around the zero line, the signal line is directed upwards.

Resistance levels: 1.1429, 1.1442, 1.1458, 1.1497.

Support levels: 1.1391, 1.1337, 1.1307, 1.1268.

http://businesspr-finance.com/wp-content/uploads/2019/01/eurusd07012019-2.png

Trading tips

Long positions can be opened from the level of 1.1430 with the target at 1.1490 and stop loss 1.1400.

Short positions can be opened from the level of 1.1390 with the target at 1.1340 and stop loss 1.1420.

Implementation period: 1–3 days.

Use more opportunities of the NPBFX analytical portal: economic calendar.

Be ready for any market changes through global events using the economic calendar on the NPBFX portal. The calendar contains all the most important events of the world economy and prognoses for them. In order to get free and unlimited access to the economic calendar and other useful instruments on the portal, you need to pass a one-time registration on the NPBFX website.

If you have any questions about trading instruments, you can always ask an analyst in the online chat on the portal and get a free consultation of an experienced specialist.

Use the current recommendations of analysts on EUR/USD and trade efficiently with NPBFX.

Re: NPBFX - making money with us since 1996!

USD/JPY: USD remains under pressure 10.01.2019

Good afternoon, dear forum visitors!

NPBFX offers the latest release of analytics on USD/JPY for a better understanding of the current market situation and more efficient trading.

Current trend

USD showed a decline against JPY on Wednesday, leveling off growth at the beginning of the current trading week. The main reason for the emergence of "bearish" dynamics was quite cautious Fed protocols, published the day before.

Heads of the regulator pointed out the expediency of “a certain increase in the rate”, however any exact dates were not named. In addition, the protocols reflected growing uncertainty about risks in the global economy and low inflationary expectations in the United States.

In turn, JPY is under pressure from the US-China trade negotiations. The prospect of their success makes investors withdraw from the safe-haven asset and invest in other currencies. Meanwhile, Wednesday's Japanese average cash earnings data grew by 2.0%, which is the most significant indicator since last August and the World Bank raised the growth forecast for the Japanese economy in 2019 from 0.8% to 0.9%.

Support and resistance

Bollinger Bands in D1 chart demonstrate a stable decrease. The price range is actively narrowing, but still remains quite spacious for the current trend at the market. MACD is reversing downwards recovering a sell signal (located below the signal line). Stochastic shows similar dynamics, reversing downwards near the level of "80", which is a formal margin of oversold USD.

The further development of the downtrend is possible in the short and/or ultra-short term.

Resistance levels: 108.52, 109.07, 110.00, 110.45.

Support levels: 108.00, 107.47, 107.00, 106.44.

http://businesspr-finance.com/wp-content/uploads/2019/01/99-1.jpg

http://businesspr-finance.com/wp-content/uploads/2019/01/00.jpg

Trading tips

Long positions can be opened if the price rebounds from 107.47 followed by the breakout of 108.00. Take profit — 110.00. Stop loss — 107.30.

A breakdown of 107.47 or 107.30 may be a signal to further sales with target at 105.88 or 105.58. Stop loss — 108.00.

Implementation period: 2-3 days.

Use more opportunities of the NPBFX analytical portal:trading signals. Make right trade decisions on sell or buy USD/JPY and other popular instruments using trading signals on the NPBFX portal. All registered users have free access to signals from the top 10 trading indicators (MA10, BBands, Ichimoku, Stochastic, ZigZag, etc.) with also general recommendations on the portal.

If you have any questions about trading instruments, you can always ask an analyst in the online chat on the portal and get a free consultation of an experienced specialist.

Use the current recommendations of analysts on USD/JPY and trade efficiently with NPBFX.

Re: NPBFX - making money with us since 1996!

XAG/USD: silver prices are consolidating 11.01.2019

Good afternoon, dear forum visitors!

NPBFX offers the latest release of analytics on XAG/USD for a better understanding of the current market situation and more efficient trading.

Current trend

Silver prices fluctuate near 15.50, rather sharply reacting to all changes in the market.

Investors are still focused on the Shutdown, US-Chinese trade negotiations, and the Fed minutes. The meeting of Trump with the Democratic Party did not yield any results. The president left it after receiving a new refusal to finance the construction of a wall on the Mexico border. Thus, the Shutdown lasts for 19 days and may be the longest in American history against the one of 1995-1996, which lasted 21 days. Yesterday, Chinese officials commented on the trade negotiations with the US that ended on Wednesday. According to the spokesman for the Ministry of Commerce of China Gao Feng, the parties made progress, and this explains the extension of consultations by one day.

The Fed Minutes indicated that some FOMC members opposed December rate hike due to the low inflationary pressure. Officials noted that, in conditions of insufficient inflation, another tightening of monetary policy can be postponed.

Support and resistance

On the daily chart, Bollinger bands are growing. The price range is actively narrowing, indicating the ambiguous dynamics. MACD is falling, keeping a poor sell signal (the histogram is below the signal line). Stochastic is falling but at the moment it is tending to reverse flat in the center of its working area.

The development of a corrective decline is possible in the short and/or super short term.

Resistance levels: 15.66, 15.75, 15.84, 16.00.

Support levels: 15.47, 15.37, 15.24, 15.09.

http://businesspr-finance.com/wp-content/uploads/2019/01/4-1.jpg

http://businesspr-finance.com/wp-content/uploads/2019/01/5-4.jpg

Trading tips

Long positions can be opened after the breakout of 15.75 with the target at 16.00. Stop loss is 15.66.

Short positions can be opened after the breakdown of 15.47 with the targets at 15.24 or 15.15–15.09. Stop loss is 15.60.

Implementation period: 2–3 days.

Use more opportunities of the NPBFX analytical portal: trading signals for commodities.

How can a trader determine if it’s worth buying or selling XAG/USD now or better waiting for a more favorable period? Use trading signals for commodities from the top 10 technical indicators on the NPBFX portal and make the right decisions! All registered users have free and unlimited access to the minutely updated trading signals (MA10, BBands, Ichimoku, Stochastic, ZigZag, etc.) for Gold, Silver, Brent and WTI Crude oil.

If you have any questions about trading instruments, you can always ask an analyst in the online chat on the portal and get a free consultation of an experienced specialist.

Use the current recommendations of analysts on XAG/USD and trade efficiently with NPBFX.

Re: NPBFX - making money with us since 1996!

WTI Crude Oil: price is consolidating 14.01.2019

Good afternoon, dear forum visitors!

NPBFX offers the latest release of analytics on WTI Crude Oil for a better understanding of the current market situation and more efficient trading.

Current trend

After an active growth at the beginning of the year, oil prices are consolidating near the level of $50 per barrel.

"Black gold" is supported by investors' hopes for a positive outcome of China-US trade negotiations and the end of the trade conflict in the near future. In addition, quotes are rising against the background of the Norwegian Petroleum Directorate, which reported a likely reduction in production by 4.8% to 1.42 million barrels per day in 2019, which is the minimum figure for the last 30 years.

Last Friday, Baker Hughes US Oil Rig Count report affected the instrument positively. During the week, the number of rigs decreased by 4 to 873 units. Over the past period, the figure also declined from 885 to 877.

Support and resistance

On the daily chart, Bollinger bands are growing steadily. The price range narrows, reflecting the emergence of ambiguous trading dynamics in the short term. The MACD indicator is growing, keeping a buy signal (the histogram is above the signal line), and is testing the zero line but is not likely to consolidate above it. Stochastic declines, reacting to the active “bearish” dynamics of the beginning of the week.

The current readings of the indicators do not contradict the further development of the corrective decline in the short and/or super short term.

Resistance levels: 52.00, 53.19, 54.43, 55.64.

Support levels: 50.00, 49.00, 48.05, 47.00, 45.80.

http://businesspr-finance.com/wp-content/uploads/2019/01/14.jpg

http://businesspr-finance.com/wp-content/uploads/2019/01/15.jpg

Trading tips

Long positions can be opened after the rebound from the level of 50.00 with the target at 52.00 or 53.19. Stop loss is 49.00.

Short positions can be opened after the breakdown of the level of 50.00 with the target at 48.05 or 47.00. Stop loss is 51.00.

Implementation period: 2–3 days.

Use more opportunities of the NPBFX analytical portal: glossary

Beginning traders certainly face a lot of specialized concepts and lexicon on FOREX, which are often not fully been understood. Swap, tick, hedge, margin calls are often unfamiliar to beginning traders. But the lack of knowledge of these fundamentals make a competent market vision impossible. So glossary on the NPBFX analytical portal could be an excellent helper in this case, which contains all the main definitions with explanations in a compact and accessible form. All concepts are arranged in alphabetical order, so that you can easily and quickly find and explore a new concept for yourself.

If you have any questions about trading instruments, you can always ask an analyst in the online chat on the portal and get a free consultation of an experienced specialist.

Use the current recommendations of analysts on WTI Crude Oil and trade efficiently with NPBFX.

Re: NPBFX - making money with us since 1996!

GBP/USD: wave analysis 16.01.2019

Good afternoon, dear forum visitors!

NPBFX offers the latest release of analytics on GBP/USD for a better understanding of the current market situation and more efficient trading.

The pair may grow.

On the 4-hour chart, a downward correction of the higher level developed as the wave (2), within which the wave C of (2) formed as a wedge. Now, the development of the third wave (3) has begun, within which the entry momentum of the lower level (i) of i of 1 of (3) has formed, and the correction (ii) of i has ended. If the assumption is correct, the pair will grow to the level of 1.3175. In this scenario, critical stop loss level is 1.2665.

http://businesspr-finance.com/wp-content/uploads/2019/01/4-2.jpg

http://businesspr-finance.com/wp-content/uploads/2019/01/5-5.jpg

Main scenario

Long positions will become relevant during the correction, above the level of 1.2665 with the target at 1.3175. Implementation period: 7 days and more.

Alternative scenario

The breakdown and the consolidation of the price below the level of 1.2665 will let the pair go down to the levels of 1.2393–1.2300.

Use more opportunities of the NPBFX analytical portal: analytics.

You can find more actual analytical reviews on other popular currency pairs, metals and CFDs on the NPBFX online portal. Daily analytics with charts, current market prognoses and trading scenarios in the Feed section are available. Get free and unlimited access to the online portal after registering on the official website of NPBFX Company.

If you have any questions about trading instruments, you can always ask an analyst in the online chat on the portal and get a free consultation of an experienced specialist.

Use the current recommendations of analysts on GBP/USD and trade efficiently with NPBFX.

Re: NPBFX - making money with us since 1996!

USD/JPY: the dollar is strengthening 18.01.2019

Good afternoon, dear forum visitors!

NPBFX offers the latest release of analytics on USD/JPY for a better understanding of the current market situation and more efficient trading.

Current trend

USD grows moderately against JPY, renewing local highs since January 2, 2018.

Yesterday, investors were focused on the speech of the head of the Bank of Japan Haruhiko Kuroda. He noted that central banks should carefully assess the impact on the economy of unconventional monetary policy measures since they can cause various side effects. Kuroda also mentioned that rapidly aging societies, including Japan, may complicate the work of banks since reducing the demand for their services may induce financial institutions to encourage risky investments.
Today, during the Asian session, the pair is strengthening due to poor macroeconomic statistics from Japan. In December, the national Consumer Price Index slowed down from +0.8% YoY to +0.3% YoY. CPI excluding prices for fresh food fell from +0.9% YoY to +0.7% YoY, while the growth by 0.8% YoY was expected.

Support and resistance

On the daily chart, Bollinger bands reverse horizontally. The price range narrows, reflecting the emergence of an upward trend in the short term. MACD is growing, keeping a strong buy signal (the histogram is above the signal line). Stochastic is directed upwards but is near its highs, which indicates that USD can become overbought in the super short term.

It is better to keep current long positions until the market situation becomes clear.

Resistance levels: 109.45, 110.00, 110.45, 111.00.

Support levels: 109.07, 108.58, 108.00, 107.47.

http://businesspr-finance.com/wp-content/uploads/2019/01/68.jpg

http://businesspr-finance.com/wp-content/uploads/2019/01/69.jpg

Trading tips

Long positions can be opened after the breakout of the level of 109.70 or 110.00 with the targets at 111.00–111.50. Stop loss is 109.40–109.10.

Short positions can be opened after a downward reversal near current levels and a breakdown of the level of 109.00 or 108.70 with the target at 108.00 or 107.80.

Stop loss is 109.30–109.50.

Implementation period: 2–3 days.

Use more opportunities of the NPBFX analytical portal: trading signals.

Make right trade decisions on sell or buy USD/JPY and other popular instruments using trading signals on the NPBFX portal. All registered users have free access to signals from the top 10 trading indicators (MA10, BBands, Ichimoku, Stochastic, ZigZag, etc.) with also general recommendations on the portal.

If you have any questions about trading instruments, you can always ask an analyst in the online chat on the portal and get a free consultation of an experienced specialist.

Use the current recommendations of analysts on USD/JPY and trade efficiently with NPBFX.

Re: NPBFX - making money with us since 1996!

Who won from $100 to $1000 in December contest? NPBFX presents the results of the last Battle of traders in 2018

Good afternoon, dear forum users!

Recently the year 2018 ended as well as the December Battle of Traders from NPBFX! How many participants took part in it? Who opened the list of TOP 10 winners? Was the iPhone Xs 64Gb presented? Below we will uncover the results and answer the most exciting questions.

The December battle united 1477 traders! Almost every participant of the New Year's Eve contest felt the spirit of rivalry and the desire to win. Daily monitoring reflected strong fight for places in the TOP 10 for the total prize fund of $ 2500.

The contest is held on NPBFX demo accounts and participants are allowed to use any trading strategy and all available instruments (Forex currency, precious metals, cryptocurrency).

Each trader started with a virtual starting deposit of $ 5000. Participants who managed to maximize their initial deposit became the winners. So the December list of winners included the following traders:

http://businesspr-finance.com/wp-content/uploads/2019/01/123456.png

The honorable first place goes to the trader with a nickname GAS (101295 contest trading account). The trader managed to increase the initial funds by 20 times - up to $ 104388.58! Unfortunately, the amount on the balance was not enough to get a special prize iPhone Xs 64Gb, according to the conditions of the contest. At the same time, the trading result of the December leader can be definitely called excellent!

NPBFX sincerely congratulates all the winners of December contest and also thanks all the participants of the final battle in 2018!

NPBFX invites experienced and beginner traders to participate in the exciting Battle of Traders on demo accounts in February. The registration is opened until February 14, 2019.

You can find the December contest monitoring on the NPBFX website.

Re: NPBFX - making money with us since 1996!

EUR/USD: euro remains under pressure 22.01.2019

Good afternoon, dear forum visitors!

NPBFX offers the latest release of analytics on EUR/USD for a better understanding of the current market situation and more efficient trading.

Current trend

Yesterday, EUR rose uncertainly against USD within the correction after last week’s fall. However, the pair failed to consolidate in the new positions and by the end of the session, lost its advantage.

EUR growth is constrained by negative PRC data. Chinese Q4 2018 GDP declined. The indicator fell from 1.6% QoQ to 1.5% QoQ and from 6.5% YoY to 6.4% YoY (the worst figure since 1990). Also, European investors are monitoring the situation around Brexit. Yesterday, Prime Minister Theresa May announced a backup plan for an agreement with the EU.

Today, January German and EU data on the index of business sentiment from ZEW will be published. According to the forecast, the number of pessimists in German business circles will increase: the figure will grow from –17.5 to –18.4. EU figure will decrease from –21.0 to –20.1 but pessimism will continue to prevail in European business circles, which may adversely affect EUR.

Support and resistance

On the daily chart, Bollinger bands move flat. The price range is virtually unchanged but remains wide enough for the current activity level. MACD falls, keeping a strong sell signal (the histogram is below the signal line). Stochastic reached its lows, reversed horizontally, indicating the growing risks of an upward correction in the super short term.

It is better to wait until the situation is clear.

Resistance levels: 1.1376, 1.1400, 1.1421, 1.1442.

Support Levels: 1.1351, 1.1333, 1.1300, 1.1268.

http://businesspr-finance.com/wp-content/uploads/2019/01/3-3.jpg

http://businesspr-finance.com/wp-content/uploads/2019/01/4-3.jpg

Trading tips

Long positions can be opened after a rebound from 1.1351 and a breakout of 1.1376 with the targets at 1.1421–1.1442. Stop loss is 1.1351. Implementation period: 2–3 days.

Short positions can be opened after the breakdown of 1.1351 with the target at 1.1300. Stop loss is 1.1376–1.1380. Implementation period: 1–2 days.

Use more opportunities of the NPBFX analytical portal: economic calendar.

Be ready for any market changes through global events using the economic calendar on the NPBFX portal. The calendar contains all the most important events of the world economy and prognoses for them. In order to get free and unlimited access to the economic calendar and other useful instruments on the portal, you need to pass a one-time registration on the NPBFX website.

If you have any questions about trading instruments, you can always ask an analyst in the online chat on the portal and get a free consultation of an experienced specialist.

Use the current recommendations of analysts on EUR/USD and trade efficiently with NPBFX.

Re: NPBFX - making money with us since 1996!

USD/CHF: wave analysis 23.01.2019

Good afternoon, dear forum visitors!

NPBFX offers the latest release of analytics on USD/CHF for a better understanding of the current market situation and more efficient trading.

The pair may grow.

On the 4-hour chart, a downward correction of the higher level developed as the wave (2), within which the wave C of (2) formed. Now the development of the third wave (3) has begun, within which the first wave of the lower level i of 1 of (3) is forming. If the assumption is correct, the pair will grow to the levels of 1.0126–1.0256. In this scenario, critical stop loss level is 0.9914.

http://businesspr-finance.com/wp-content/uploads/2019/01/7-1.jpg

http://businesspr-finance.com/wp-content/uploads/2019/01/8-1.jpg

Main scenario

Long positions will become relevant during the correction, above the level of 0.9914 with the targets at 1.0126–1.0256. Implementation period: 7 days and more.

Alternative scenario

The breakdown and the consolidation of the price below the level of 0.9914 will let the pair go down to the levels of 0.9801–0.9712.
Use more opportunities of the NPBFX analytical portal: analytics.

You can find more actual analytical reviews on other popular currency pairs, metals and CFDs on the NPBFX online portal. Daily analytics with charts, current market prognoses and trading scenarios in the Feed section are available. Get free and unlimited access to the online portal after registering on the official website of NPBFX Company.

If you have any questions about trading instruments, you can always ask an analyst in the online chat on the portal and get a free consultation of an experienced specialist.

Use the current recommendations of analysts on USD/CHF and trade efficiently with NPBFX.