forex software

Create and Test Forex Strategies

forex software

Skip to forum content

Forex Software

Create and Test Forex Strategies

You are not logged in. Please login or register.


(Page 62 of 62)

Forex Software → Market Analysis → InstaForex Analysis

Pages Previous 1 60 61 62

You must login or register to post a reply

RSS topic feed

Posts: 1,526 to 1,547 of 1,547

Re: InstaForex Analysis

Forex Analysis & Reviews: Forecast for EUR/USD on February 2, 2024

EUR/USD
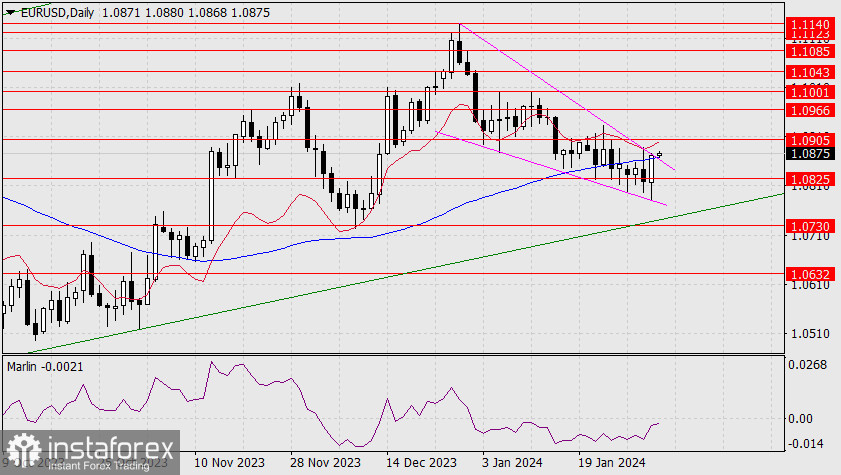
Yesterday, the euro, which was losing momentum, received support from the stock market, which gained 1.25% (S&P 500) and lifted the euro by 54 pips. On the daily chart, the price broke out of the descending wedge and is attempting to settle above the MACD line. The Marlin oscillator is also ready to rise; soon, it will move into the growth territory.
https://forex-images.ifxdb.com/userfiles/20240202/analytics65bc575724a51_source!.jpg

Today, the market expects the U.S. employment data to show minor weakness. In the non-farm sector for January, 187,000 new jobs are forecasted compared to 216,000 in December, and an increase in the unemployment rate from 3.7% to 3.8%. However, the stock market, along with other instruments, often developed a risk-on sentiment against labor data, for instance, on November 3rd, when non-farm payrolls for October were 150,000 against an expectation of 180,000.
https://forex-images.ifxdb.com/userfiles/20240202/analytics65bc574e88669_source!.jpg

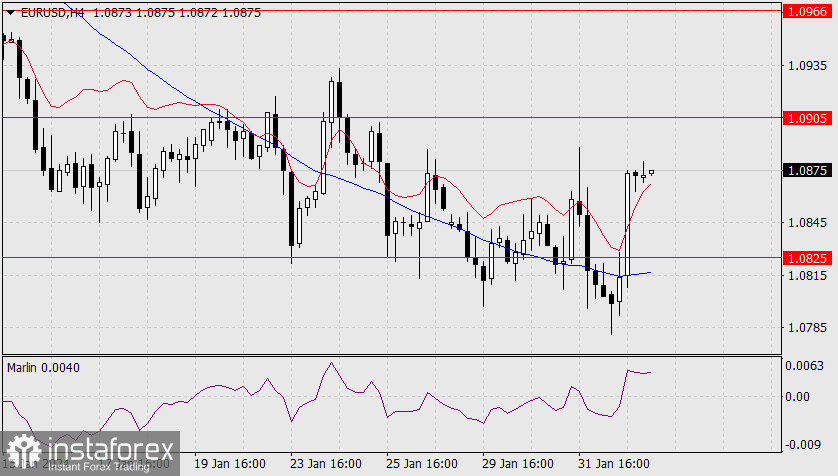
On the 4-hour chart, the price has already settled into the uptrend territory – it is currently moving above both indicator lines, and Marlin has been stable in the bullish territory. We expect the euro to rise towards the target levels of 1.0966, 1.1001 (the peak of January 11th), and 1.1043, while keeping a close eye on the stock market.
Analysis are provided by InstaForex.

Read More

Re: InstaForex Analysis

Forex Analysis & Reviews: Forecast for EUR/USD on February 5, 2024

EUR/USD
Last Friday, the US employment data from the US Bureau of Labor Statistics surprised the currency market. US nonfarm payroll employment far exceeded expectations of 157,000, with an increase of 353,000 in January. Not only that, but December's figures were revised upward by 117,000. According to federal funds rates, the market probability of maintaining the current Federal Reserve rate at 5.50% in the March meeting has increased from 62% to 80%, and the likelihood of a rate cut in May rose from 58% to 60%. The yield on 5-year US government bonds rose from 3.82% to 3.98%. The S&P 500 stock index jumped by 1.07%, but the euro lacked the decisiveness to follow suit, dropping by 85 pips. Oil and gold also fell.

https://forex-images.ifxdb.com/userfiles/20240205/analytics65c04c2ea2daa_source!.jpg

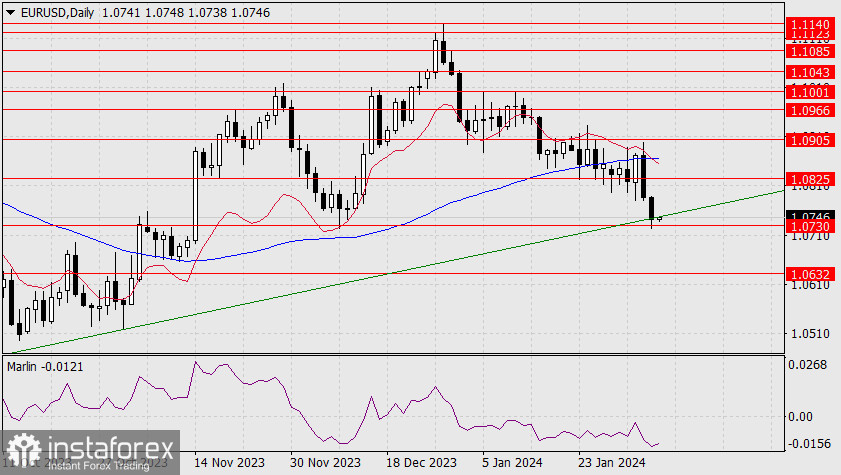
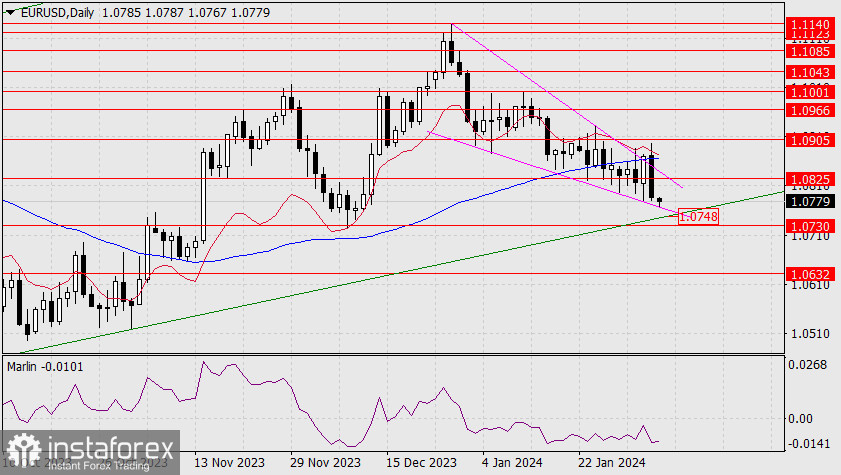
The euro still has a chance to turn higher, but it needs to rebound from the support level. The nearest support is the price channel line on the daily chart at 1.0748. Just below it is the level of 1.0730. If the price does not turn from there, the price could aim for 1.0632. There is also support at the lower boundary of the wedge, which has already been tested this morning but appears weak.

https://forex-images.ifxdb.com/userfiles/20240205/analytics65c04c25275e2_source!.jpg

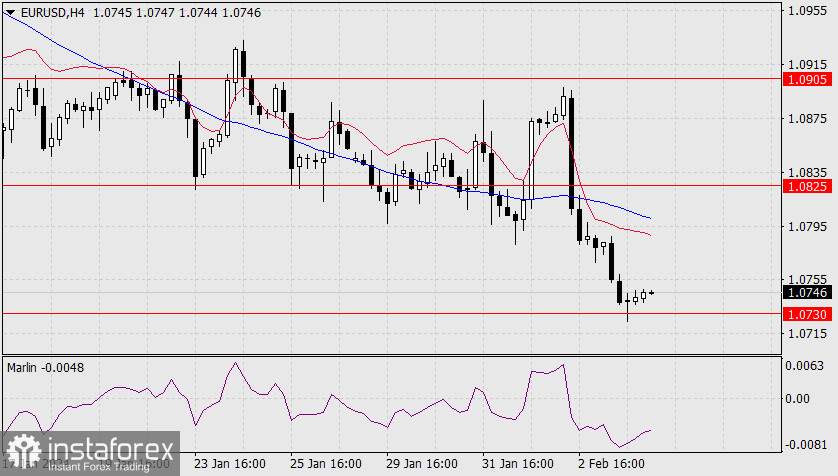
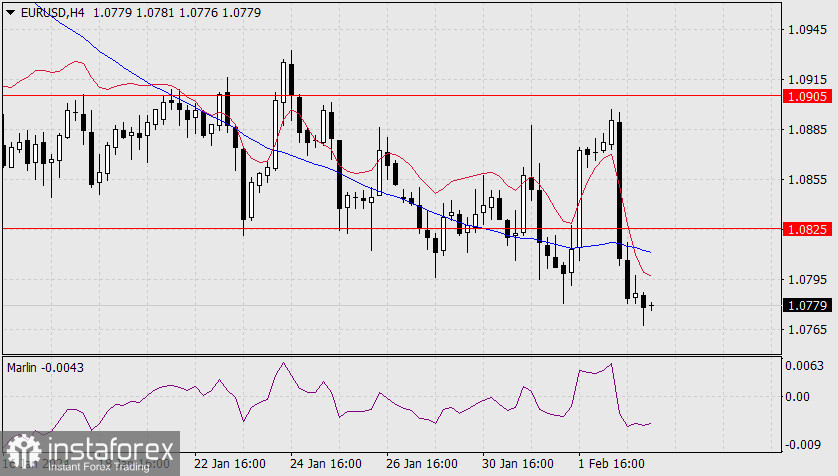
On the 4-hour chart, the price has settled below the balance and MACD indicator lines. The Marlin oscillator has settled in the downtrend territory. Probably a short-term continuation of the downward movement.

Analysis are provided by InstaForex.

Read More

Re: InstaForex Analysis

Forex Analysis & Reviews: Forecast for EUR/USD on February 6, 2024

EUR/USD
On Monday, the euro fell by 44 pips, reaching the target level of 1.0730 with the lower shadow of the daily candle. The price surpassed the lower border of the green price channel, and the channel is no longer relevant.

https://forex-images.ifxdb.com/userfiles/20240206/analytics65c19c78433af_source!.jpg

Now, after overcoming the level of 1.0730, which the price has reached, the euro may continue to fall to the next target at 1.0632. The signal line of the Marlin oscillator slightly bent upwards, which may indicate a minor correction from the support it reached before it falls further.

https://forex-images.ifxdb.com/userfiles/20240206/analytics65c19c65d0561_source!.jpg

On the 4-hour chart, the price consolidates above the support level. Marlin is discharging before a possible new wave of decline. We are waiting for the price to consolidate below 1.0730 and move towards the designated level of 1.0632 – the low of September 14, 2023, and the low of May 31.

Analysis are provided by InstaForex.

Read More

Re: InstaForex Analysis

Forex Analysis & Reviews: Forecast for EUR/USD on February 7, 2024

EUR/USD
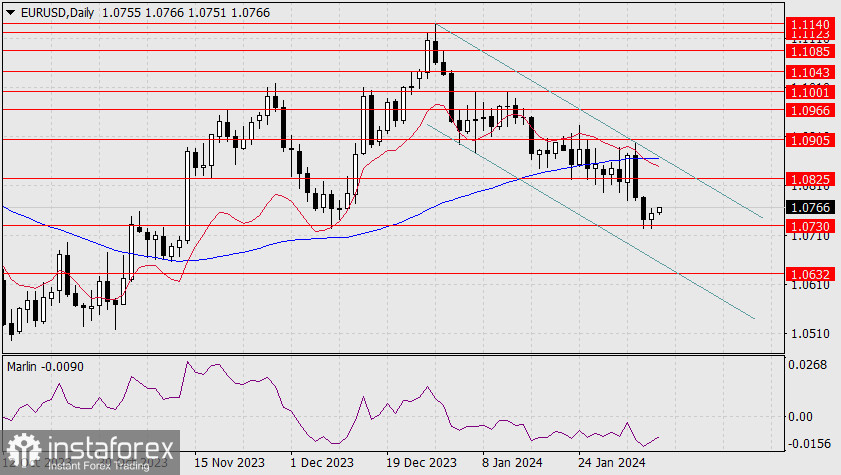
The market started a corrective move on Tuesday. Even the S&P 500, which lost 0.32% on Monday, rebounded by 0.23% yesterday. We do not expect a strong correction since this week's economic calendar does not include any significant economic data. The euro's correction will look like a consolidation above the level of 1.0730, approaching the upper boundary of the short-term downtrend channel on the daily timeframe. If the price settles below 1.0730, it will open the target at 1.0632.

https://forex-images.ifxdb.com/userfiles/20240207/analytics65c2ef880386a_source!.jpg

The price needs to do a lot to reverse the entire movement, including breaking above the MACD line, i.e., approaching 1.0905. Therefore, in the current situation, we are simply waiting for the sideways movement to end. The price could rise above 1.0905 if the stock market continues to set new historical records. However, this will eventually stop.

https://forex-images.ifxdb.com/userfiles/20240207/analytics65c2ef880386a_source!.jpg

On the 4-hour chart, a small convergence has formed. The bullish target is the MACD line around the 1.0790 mark. Staying above the line will make it possible for the price to rise to 1.0825.

Analysis are provided by InstaForex.

Read More

1,530 (edited by ifx.gertrude 2024-02-08 10:52:28)

Re: InstaForex Analysis

USD/CHF H4 | Bearish Drop

https://forex-images.ifxdb.com/userfiles/20240208/analytics65c4479558fbf.jpg

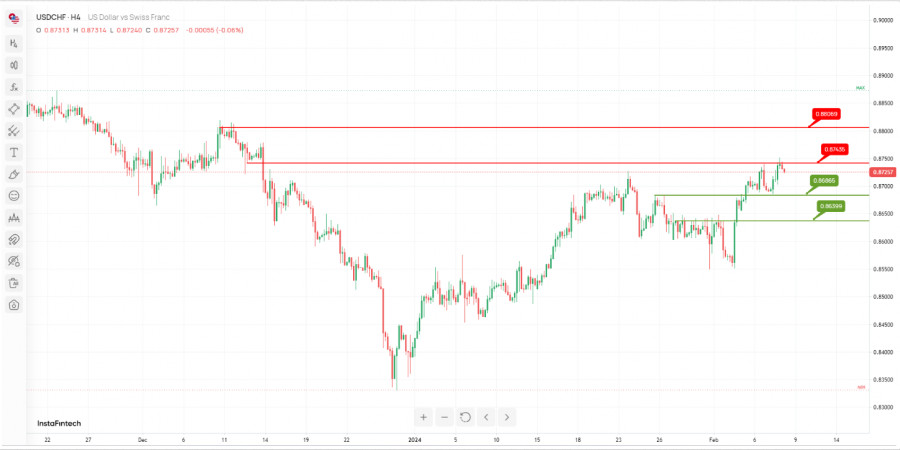
For USD/CHF (US Dollar/Swiss Franc), there's a potential bearish reversal scenario indicated by the following key levels:

Resistance Levels:

The 1st resistance level at 0.87435 is identified as "An Overlap resistance," suggesting a significant barrier where selling pressure could intensify, potentially leading to a reversal in the price trend.

The 2nd resistance level at 0.88069 is described as "Multi-swing high resistance," indicating another level where sellers might be active, reinforcing the bearish sentiment.

Support Levels:

The 1st support level at 0.86865 is recognized as "An Overlap support," implying a level where buying interest may emerge, potentially providing a floor for the price decline.

The 2nd support level at 0.86399 is noted as "Pullback support," suggesting another area where buyers could enter the market, potentially limiting further downward movement.

Analysis are provided by InstaForex.

Read More

Re: InstaForex Analysis

Forex Analysis & Reviews: Forecast for EUR/USD on February 9, 2024

EUR/USD
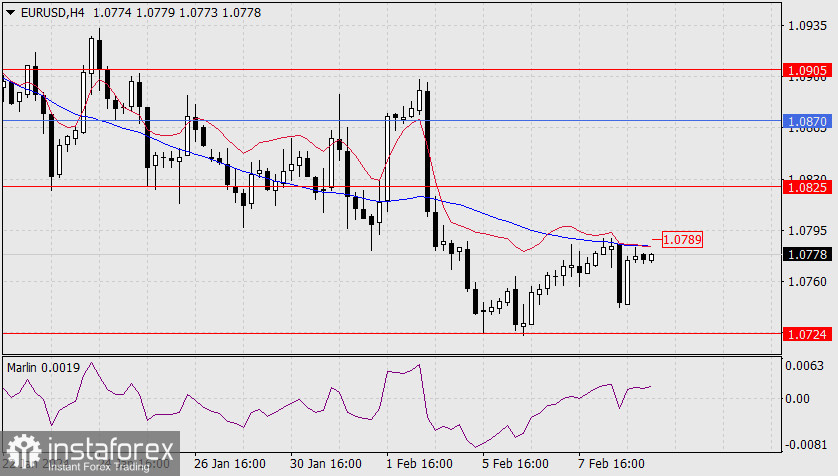
Yesterday, the euro attempted a bearish breakthrough but quickly returned to the initial positions, ending the day with a 5-point gain. We're waiting for progress, probably until the 13th, which is when the US inflation data for January will be released.

https://forex-images.ifxdb.com/userfiles/20240209/analytics65c59413a7b95_source!.jpg

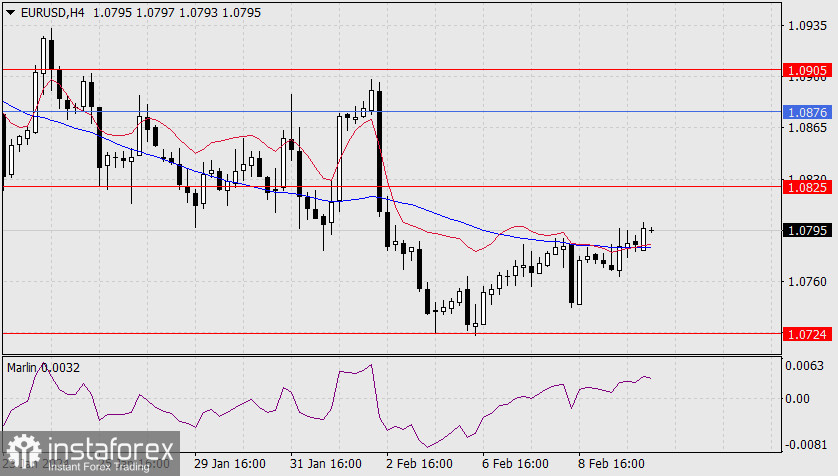
Technically, the waiting mode is working in a downward vector, as it brings it closer to the upper boundary of the descending price channel. With the Marlin oscillator in negative territory, there is a higher chance that the price could fall from this level. Overcoming the support at 1.0724 will be a crucial condition for such a decline. The nearest target is 1.0632.

https://forex-images.ifxdb.com/userfiles/20240209/analytics65c59405e0765_source!.jpg

On the 4-hour chart, yesterday's downturn occurred from the MACD line. This line stopped the price from returning. Marlin is currently in the positive territory, but this may not last long. For a bullish breakthrough, the price must consolidate with yesterday's high at 1.0789, which is also slightly above the MACD line. The bulls are aiming for 1.0825.

Analysis are provided by InstaForex.

Read More

Re: InstaForex Analysis

Forex Analysis & Reviews: Forecast for EUR/USD on February 12, 2024

EUR/USD
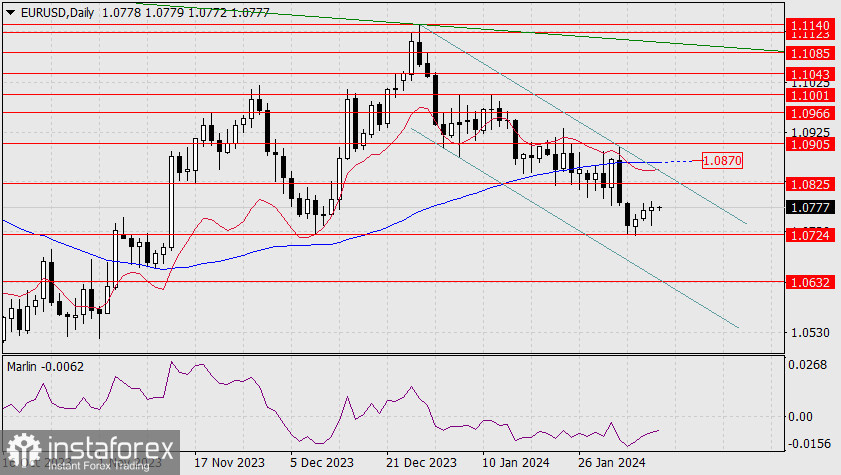
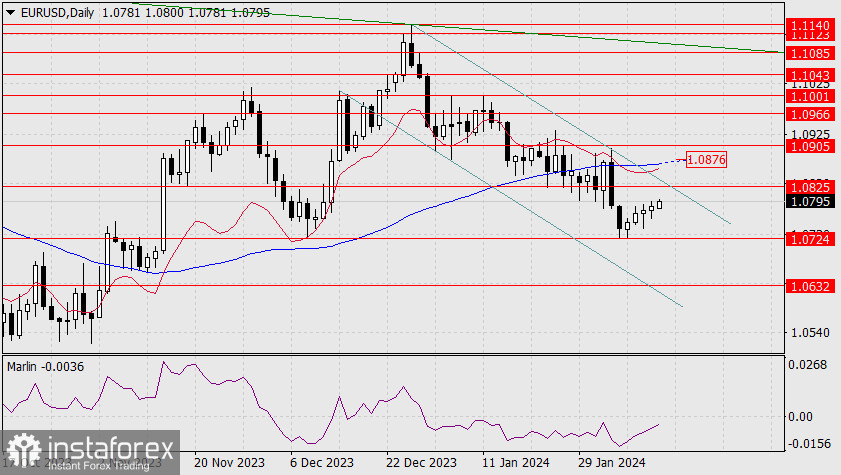
After a reversal from the support at 1.0724, the euro continues to rise for the 5th day towards the target level of 1.0825, which is near the upper band of the local descending channel on the daily scale.

https://forex-images.ifxdb.com/userfiles/20240212/analytics65c984dd6fe69_source!.jpg

The bodies of the observed white candles are small, indicating an apparent corrective nature of this growth. If the price manages to consolidate above the MACD line (1.0876), the bulls will have a basis to support a stronger rise, for instance, into the range of 1.0966-1.1001. The Marlin oscillator is still developing in negative territory, although its rise is fast.

https://forex-images.ifxdb.com/userfiles/20240212/analytics65c984ea137e5_source!.jpg

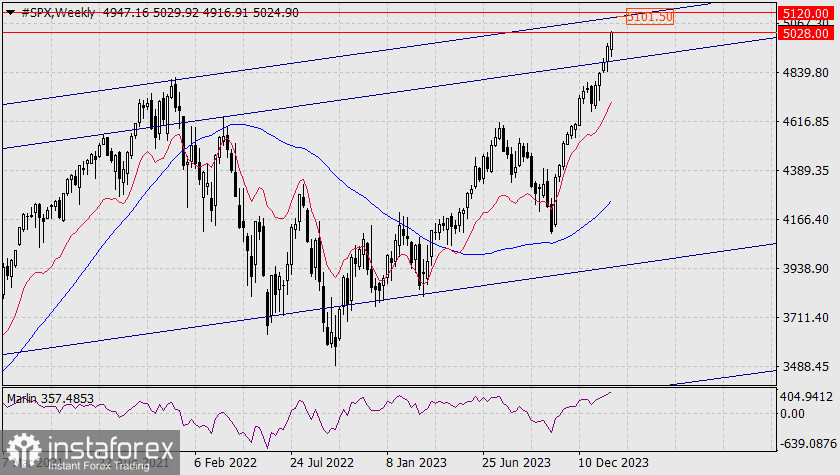
We are also keeping an eye on the S&P 500 stock index, which reached the target level of 5028 on Friday, and there is a risk of a reversal from this level. If it continues to rise, the next target will be the upper boundary of the global hyperchannel in the target range of 5101.50-5120.00, where the risk of a reversal will increase significantly.

https://forex-images.ifxdb.com/userfiles/20240212/analytics65c984c619f31_source!.jpg

On the 4-hour chart, the price has settled above the MACD line, and Marlin is growing in the uptrend territory. The nearest target of 1.0825 is open.

Analysis are provided by InstaForex.

Read More

Re: InstaForex Analysis

Forex Analysis & Reviews: Forecast for EUR/USD on February 13, 2024

EUR/USD
Yesterday, the euro did not reach its target of 1.0825, hindered by investors' flight from risk in the broader market; the S&P 500 lost 0.09% (although overall, stock markets closed mixed), and the yield on US government bonds edged down slightly.

https://forex-images.ifxdb.com/userfiles/20240213/analytics65cadadf24ddd_source!.jpg

Perhaps the single currency will not rise further, say, to 1.10. Currently, the euro is falling within a medium-term descending channel, staying below the balance and MACD indicator lines with a declining Marlin oscillator. If the price hits the nearest target of 1.0724, consolidates below it, then the euro will continue to fall to the second target of 1.0632 – to the low of September 14, 2023. We expect the pair to continue its downward movement.

https://forex-images.ifxdb.com/userfiles/20240213/analytics65cadad2488fd_source!.jpg

On the 4-hour chart, the price has returned below the MACD line but currently feels uncertain there, as the Marlin oscillator has not yet left the growth territory. Perhaps it will do so when the price surpasses yesterday's low of 1.0757.

Today, the US will release figures for its February's Consumer Price Index (CPI). This is the main agenda of the day, as this may influence the Federal Reserve's attitude toward monetary policy.

https://forex-images.ifxdb.com/userfiles/20240212/analytics65c984c619f31_source!.jpg

On the 4-hour chart, the price has settled above the MACD line, and Marlin is growing in the uptrend territory. The nearest target of 1.0825 is open.

Analysis are provided by InstaForex.

Read More

Re: InstaForex Analysis

Forex Analysis & Reviews: Forecast for EUR/USD on February 14, 2024

EUR/USD
Yesterday there was a strong shift away from risk; the S&P 500 -1.37%, copper -0.52%, but bond yields increased, and oil prices rose. On the one hand, this divergence fully corresponds to investors' expectations of a slowdown in the pace of Federal Reserve rate cuts due to yesterday's US inflation data – the core index held at 3.9% YoY against expectations of a decrease to 3.7% YoY, the US CPI decreased from 3.4% YoY to 3.1% YoY against expectations of 2.9% YoY, and investors' expectations for a rate cut shifted from May to June. On the other hand, earlier in the day, before the data was released, European stock markets and futures on the US stock market were falling, only accelerating with the release of the news. Perhaps the market will not return to the record high that was set by the S&P 500 on Monday, for a long time at that, and this is the beginning of a global crisis. Traditionally, we're waiting for a major company to announce bankruptcy to officially start the crisis. Last year, there were several major bankruptcies, but amid unbridled optimism, they went unnoticed. Now, markets are more attentive.

https://forex-images.ifxdb.com/userfiles/20240214/analytics65cc2c18b0841_source!.jpg

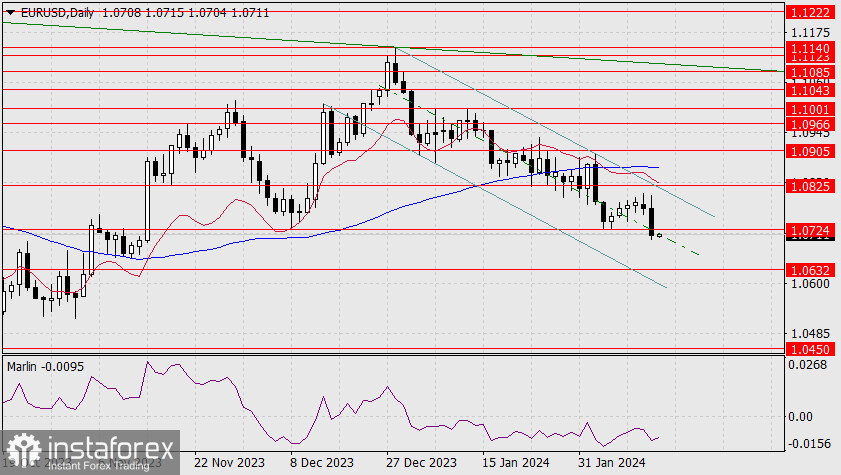
On the daily chart, the euro has crossed the midline of the descending price channel. The price has breached the support at 1.0724, so now it can aim for 1.0632. Surpassing this target would reveal a significantly lower one at 1.0450, the October 2023 low.

https://forex-images.ifxdb.com/userfiles/20240214/analytics65cc2c2511d11_source!.jpg

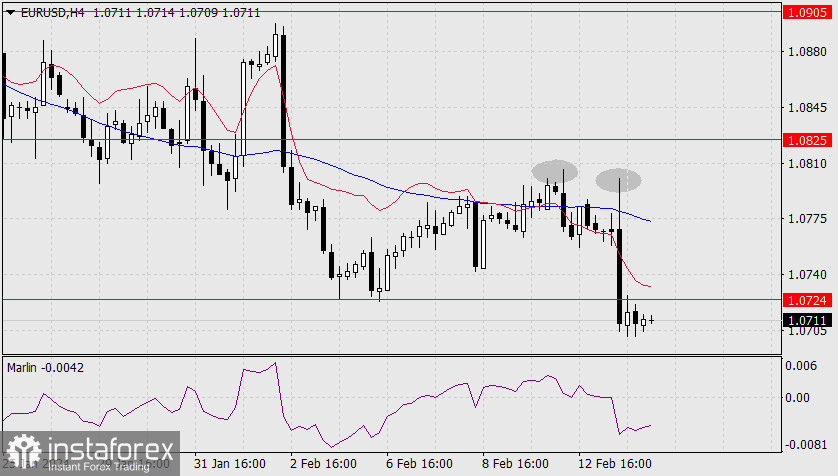
On the 4-hour chart, the price has settled below the target level of 1.0724. The Marlin oscillator has firmly settled in the downtrend territory. It is noteworthy that the decline occurred after a double false breakout above the MACD line (marked by ovals). This is a sign of the medium-term downward movement.

Analysis are provided by InstaForex.

Read More

Re: InstaForex Analysis

Forecast for EUR/USD on February 15, 2024

EUR/USD
The euro continues to closely follow the movements of the stock market. Yesterday, the S&P 500 index corrected from Tuesday's decline, showing a 0.96% increase. We outlined our main points in yesterday's review, so today, we are taking a wait-and-see position.
https://forex-images.ifxdb.com/userfiles/20240215/analytics65cd7e96ad1c3_source!.jpg.jpg

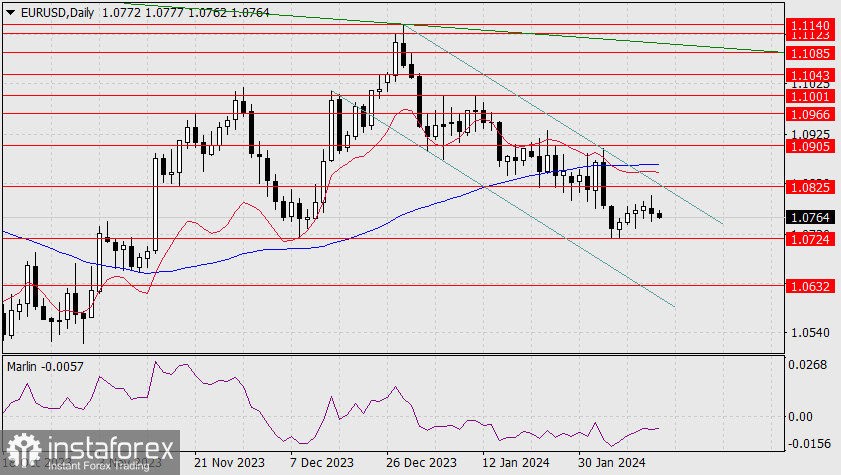
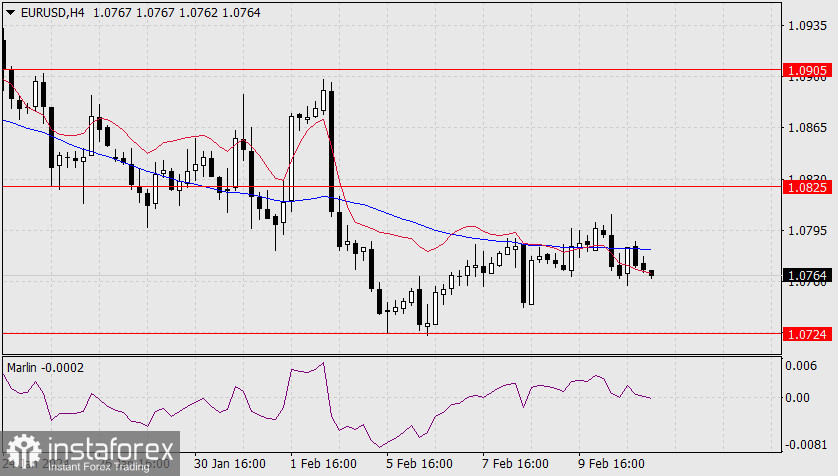
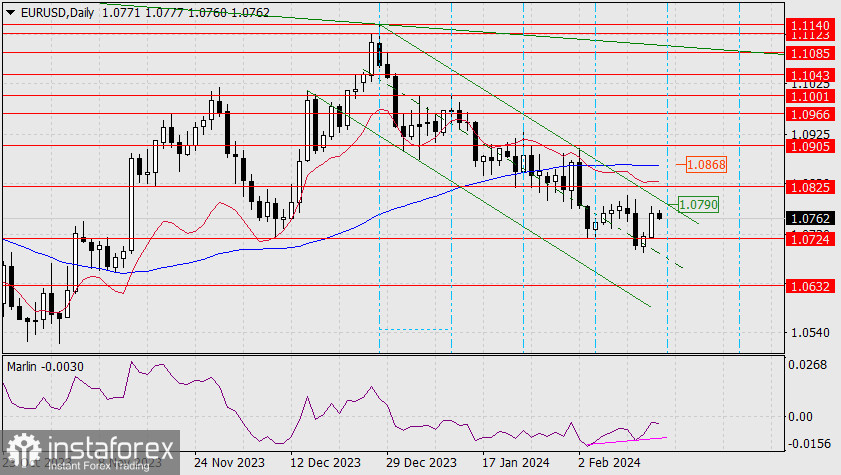
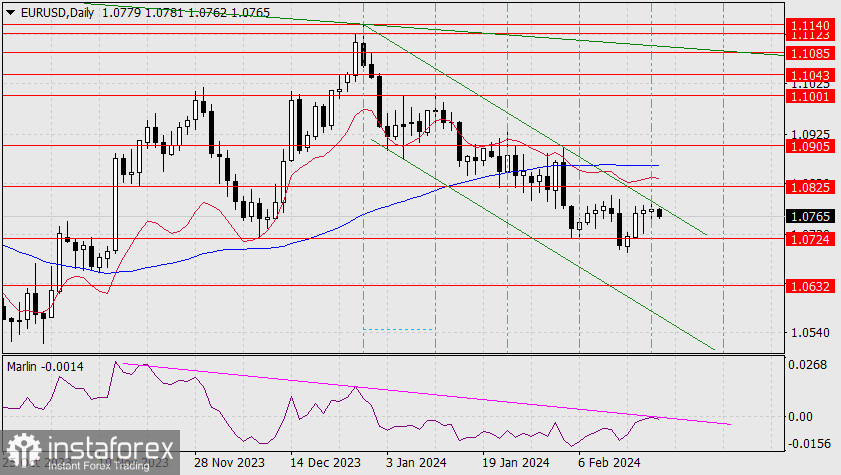
On the daily chart, the euro has shown moderate growth in the upper half of the descending price channel both yesterday and this morning. A small convergence has formed with the Marlin oscillator. Apparently, traders are not in a hurry to anticipate events, so the convergence will guide the euro into sideways movement, slightly above the support at 1.0724, where the price may gather strength to show a firm downward movement.

https://forex-images.ifxdb.com/userfiles/20240215/analytics65cd7e8dd7fb4_source!.jpg

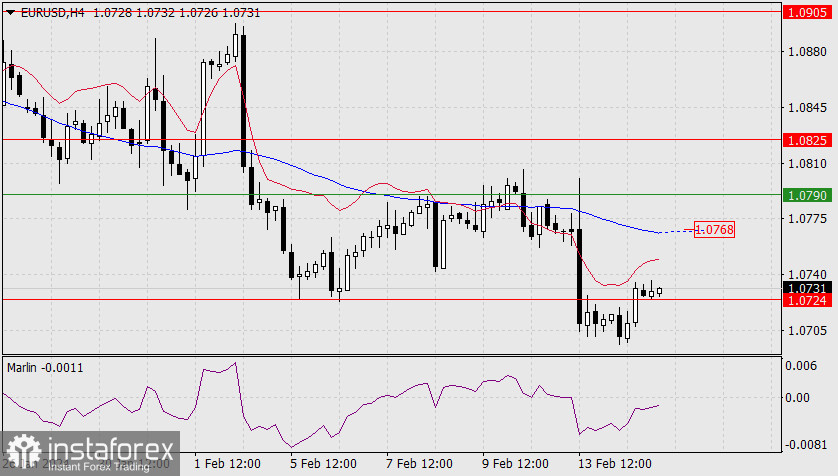
On the 4-hour chart, the price has already managed to consolidate above the level of 1.0724, but it is noticeably below the MACD indicator line (1.0768). Overcoming this line will allow the price to test the upper boundary of the daily price channel (1.0790). Only a break above the channel will postpone the euro's decline for an indefinite period.

Analysis are provided by InstaForex.

Read More

Re: InstaForex Analysis

Forex Analysis & Reviews: Forecast for EUR/USD on February 16, 2024

EUR/USD
Yesterday, under the influence of the stock market (S&P 500 0.58%) and its own convergence, the euro rose by 44 pips. The upper boundary of the descending price channel at 1.0790 is nearby. A break above the channel will open the nearest target level at 1.0825. Then, assuming that the stock market will continue to rise, the euro may attempt to reach the MACD indicator line at 1.0868 on the daily chart.

https://forex-images.ifxdb.com/userfiles/20240216/analytics65ced3a54f3c7_source!.jpg

The stock market needs to rise by 0.39% to reach its record high set on February 12. If it manages to do so, it may rise by another 1.04% to reach the upper boundary of the global growing price channel since 2009. But we wouldn't count on the euro's growth until the S&P sets a new record high. If the euro breaks the support at 1.0724, the bears may try to bring the quote to the target level of 1.0632. We are waiting for progress.

https://forex-images.ifxdb.com/userfiles/20240216/analytics65ced38ad4b8c_source!.jpg

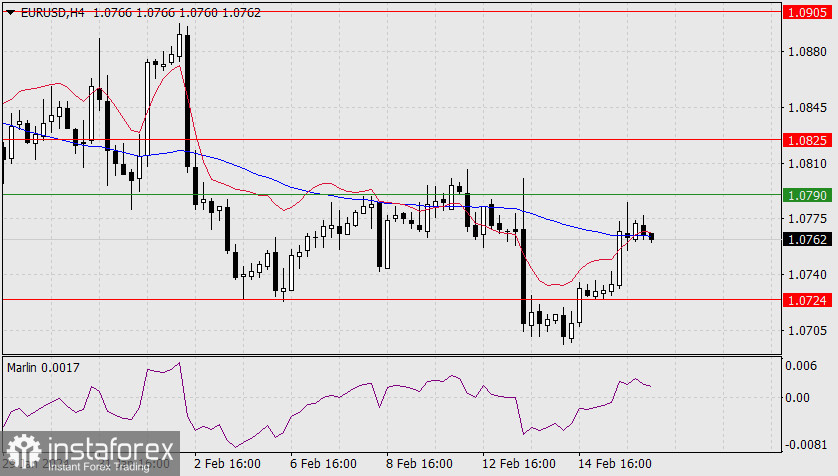
On the 4-hour chart, the price has risen above the balance and MACD indicator lines, and the Marlin oscillator has settled on its rising half. However, the main obstacle is the upper boundary of the price channel (1.0790), and it is quite difficult to overcome this while we're facing a downward trend. Perhaps the main events will unfold next week. And if you look at such a tool as cyclic lines on the daily chart, you can see a reversal moment on Monday.

Analysis are provided by InstaForex.

Read More

Re: InstaForex Analysis

Forex Analysis & Reviews: Forecast for EUR/USD on February 19, 2024

EUR/USD
Last Friday, due to the decline in the stock market, the euro failed to develop a full-fledged upward movement, closing the day up by 5 pips. This morning, the euro is trying to rise without external influence, but technically, the price has reached the intersection point of the upper boundary of the descending price channel and the cyclical line, from which a bearish trend reversal is expected. Also, the signal line of the Marlin oscillator has reached the border of the uptrend territory, and a reversal may occur from this line.

Thus, the main scenario is the euro will fall through the nearest support at 1.0724 to the target level of 1.0632. Possibly even lower, to the lower boundary of the price channel, around the target level of 1.0440 (the 2023 low). If the price breaks above the upper boundary of the price channel at 1.0793, the channel will be invalidated, and the price will continue to rise to the nearest target level of 1.0825 with the goal of attacking the MACD line around the 1.0870 mark.

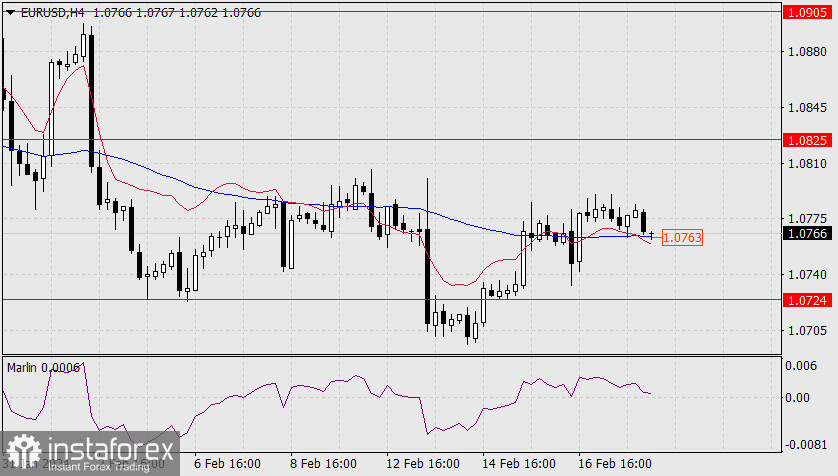
On the 4-hour chart, the price has settled above the balance and MACD indicator lines, and Marlin is growing in the positive territory after bouncing off the zero line. The growth seems deceptive, especially since the stock market has not yet come into play. If the price returns below the MACD line (1.0763), this may bring back the bearish scenario. Today, the US and Canadian markets are closed for a holiday.

Analysis are provided by InstaForex

Read More https://ifxpr.com/3T3St4Y

Re: InstaForex Analysis

Forex Analysis & Reviews: Forecast for EUR/USD on February 20, 2024

EUR/USD
The euro is starting to form a bearish reversal exactly along the cyclical line with a period of 9 daily bars. The upper line of the descending price channel is still undeveloped, but this option is also acceptable during reversals.

https://forex-images.ifxdb.com/userfiles/20240220/analytics65d410f2bf909_source!.jpg

The signal line of the Marlin oscillator is also turning down without reaching the zero line, but at the same time it is sensitive to the upper resistance line. The final confirmation that the euro will fall is when the price breaches the support at 1.0724. After that, the target will be 1.0632.

https://forex-images.ifxdb.com/userfiles/20240220/analytics65d410e3b4ca2_source!.jpg

On the 4-hour chart, the first signal for a downward movement is when the price falls below the MACD line (1.0763). It is very likely that at this moment, the Marlin oscillator will enter the downtrend territory. This will be a good pattern for creating the momentum to reach the support at 1.0724.

Analysis are provided by InstaForex.

Read More

Re: InstaForex Analysis

Forex Analysis & Reviews: Forecast for GBP/USD on February 21, 2024

GBP/USD
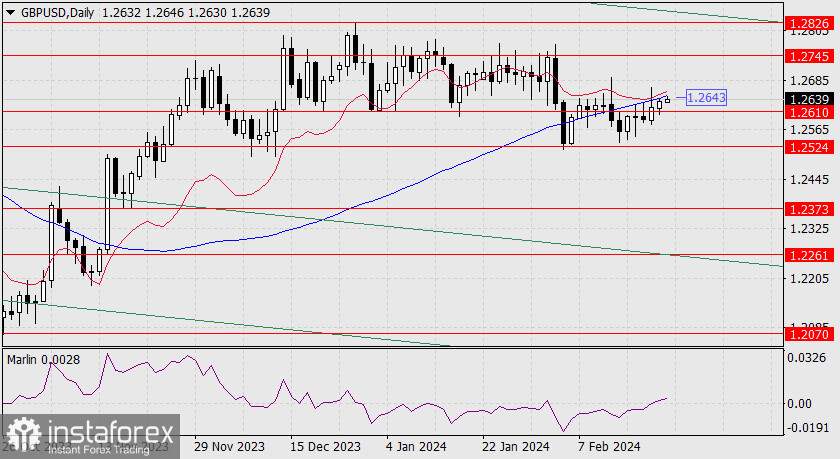
Yesterday, the price surpassed the resistance of the target level at 1.2610, as well as both indicator lines. Afterward, it retreated, and the pound closed the day with a 29-pip gain. The Marlin oscillator entered the growth territory.

https://forex-images.ifxdb.com/userfiles/20240221/analytics65d562d0f18d5_source!.jpg

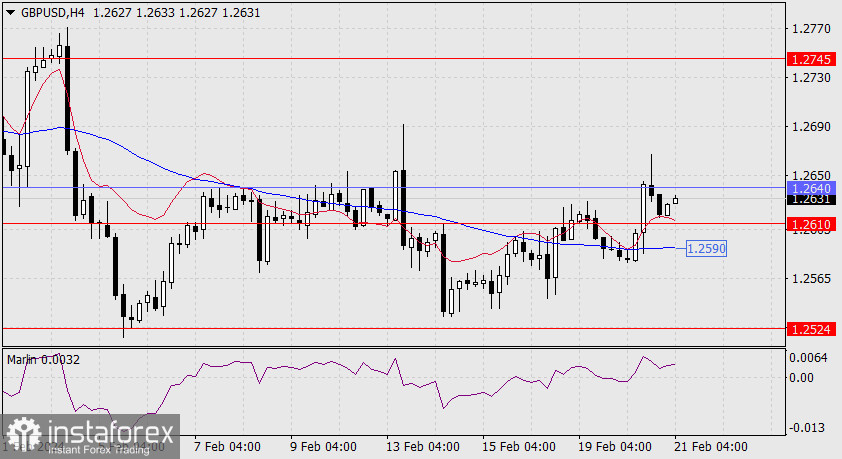
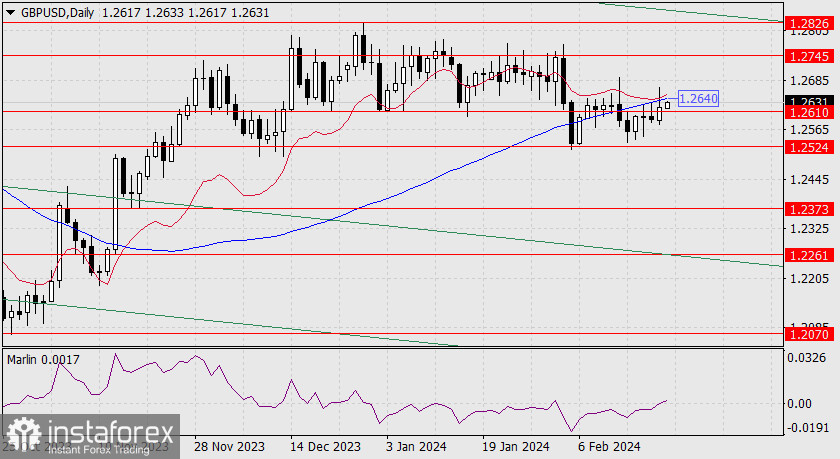
However, as long as the price doesn't settle above the MACD line (1.2640), there is a high probability of a reversal from the resistance levels it reached. Marlin can also turn down from the zero line. If the price consolidates below 1.2610, the target will be 1.2524. Consolidating above 1.2640 will allow the price to rise to the level of 1.2745 – the peak of August 30, 2023.

https://forex-images.ifxdb.com/userfiles/20240221/analytics65d562c0a40f6_source!.jpg

The price has covered a distance of 50 pips from yesterday's high to its current quote, approaching the support at 1.2610. A break below will make it possible to attack the MACD line in the 4-hour chart (1.2590). Consolidating below it opens the target level at 1.2524.

Analysis are provided by InstaForex.

Read More

Re: InstaForex Analysis

Forex Analysis & Reviews: Forecast for GBP/USD on February 22, 2024

GBP/USD
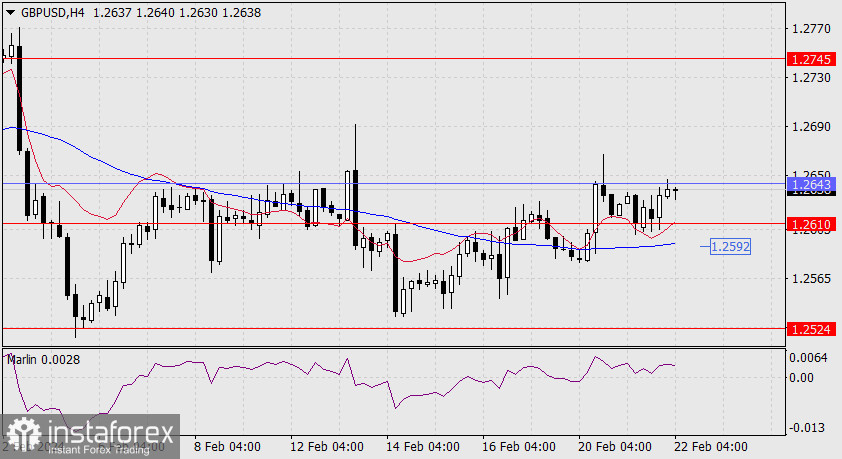
Yesterday, the British pound only rose by 15 pips, but it accomplished an important task for the bulls - it consolidated above the level of 1.2610. So now it is much easier to overcome the MACD line. It will succeed once the price overcomes the February 20th peak (1.2667). After that, the next target will be 1.2745.

https://forex-images.ifxdb.com/userfiles/20240222/analytics65d6ba13a2d32_source!.jpg

The Marlin oscillator is stable in the uptrend territory and it continues to rise further. A reversal below 1.2610 will be a sign of the bulls' weakness, despite all the positive signs that it received.

https://forex-images.ifxdb.com/userfiles/20240222/analytics65d6ba23430bb_source!.jpg

On the 4-hour chart, we can see a consolidation above 1.2610 while the price is struggling with the MACD line on the daily timeframe. The Marlin oscillator moved up in the bullish territory. But once the price overcomes the support of the MACD line (1.2592), this will confirm a bearish breakthrough and it will mark the bears' victory in the current situation.

Analysis are provided by InstaForex.

Read More

Re: InstaForex Analysis

Forex Analysis & Reviews: Forecast for GBP/USD on February 23, 2024

GBP/USD
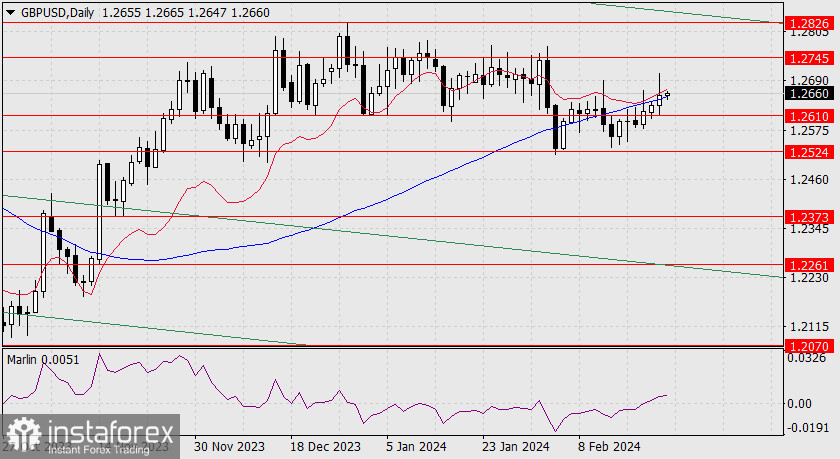
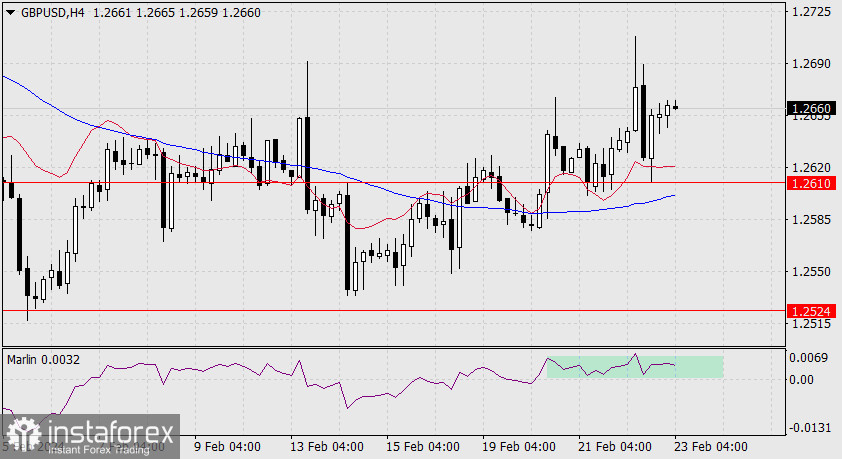
Yesterday, the composite PMI index for the UK increased to 53.30 in February from 52.90 in January of 2024. The British pound, also influenced by external markets, gained 22 pips. The intraday growth was 74 pips, but the price could not break out of the grids of the indicator lines in the daily timeframe.

https://forex-images.ifxdb.com/userfiles/20240223/analytics65d805971e756_source!.jpg

The signal line of the Marlin oscillator is growing in the positive territory, but visually it is getting weaker. In order to rise to the nearest target of 1.2745, the price must close today with a white candle to settle above the MACD line. To realize the opposite scenario, the quote must overcome the support of 1.2610. We are waiting for Monday.

https://forex-images.ifxdb.com/userfiles/20240223/analytics65d8058596888_source!.jpg

On the 4-hour chart, the price has settled and is rising above both indicator lines. However, the Marlin oscillator moves horizontally, in a sideways range. The uptrend is getting weaker, and it is better to wait for the start of next week.

Analysis are provided by InstaForex.

Read More

Re: InstaForex Analysis

FOREX ANALYSIS & REVIEWS: FORECAST FOR AUD/USD ON FEBRUARY 26, 2024

AUD/USD
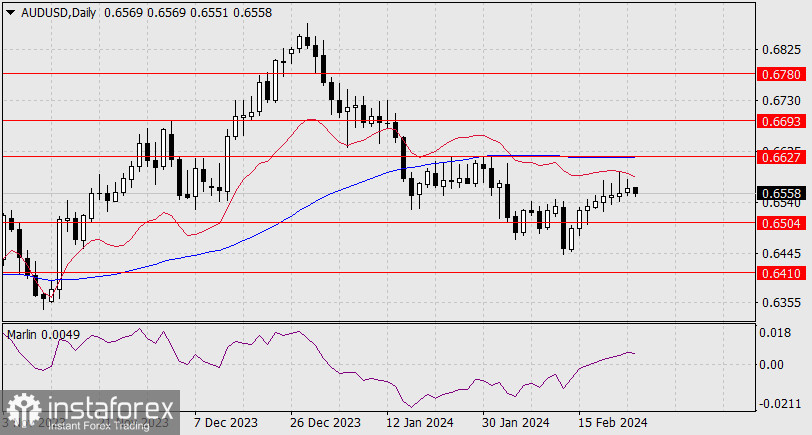
A reversal started in AUD/USD after the test of the balance indicator line on the daily chart. The Marlin oscillator moving towards the positive area also reflects this scenario. Most likely, the pair will decline when the price drops below the support level of 0.6504 and head towards 0.6410.

https://forex-images.ifxdb.com/userfiles/20240226/analytics65dbf707c5876_source!.jpg

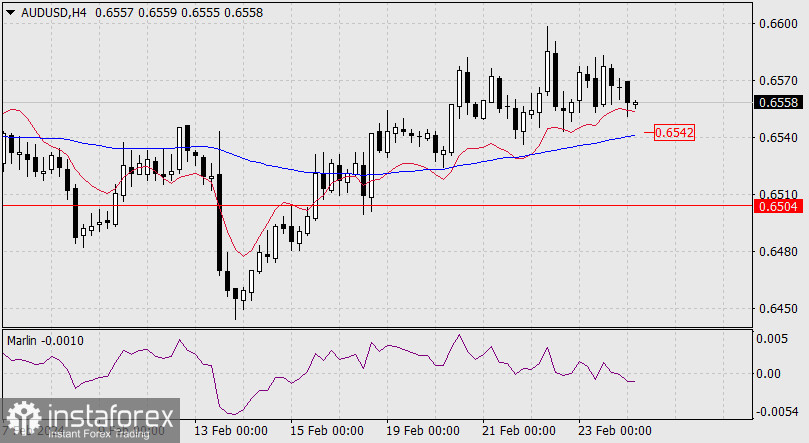
On the four-hour chart, the fall below the MACD line and 0.6542 indicates an impending downward movement. The Marlin oscillator also turned downward.

https://forex-images.ifxdb.com/userfiles/20240226/analytics65dbf713f0acf_source!.jpg

Today, data on new home sales in the US will be released, with an expected growth of 2.41%. If the data turns out to be weaker than expected, stock indices will decline and, along with them, AUD/USD.

Analysis are provided by InstaForex.

Read More

Re: InstaForex Analysis

FOREX ANALYSIS & REVIEWS: FORECAST FOR EUR/USD ON FEBRUARY 27, 2024

EUR/USD
S&P500 decreased by 0.38%, while the dollar index declined by 0.20%, thanks to a slight increase in government bond yields. Investors also expressed some confusion over the lack of agreements in Congress on the budget, which could lead to another partial government shutdown (starting from March 1). If the shutdown occurs, it will not necessarily lead to an automatic decline in dollar. Most likely, it will strengthen in the medium term as a safe-haven currency amid the decline in stock markets.

https://forex-images.ifxdb.com/userfiles/20240227/analytics65dd4cf86df8d_source!.jpg

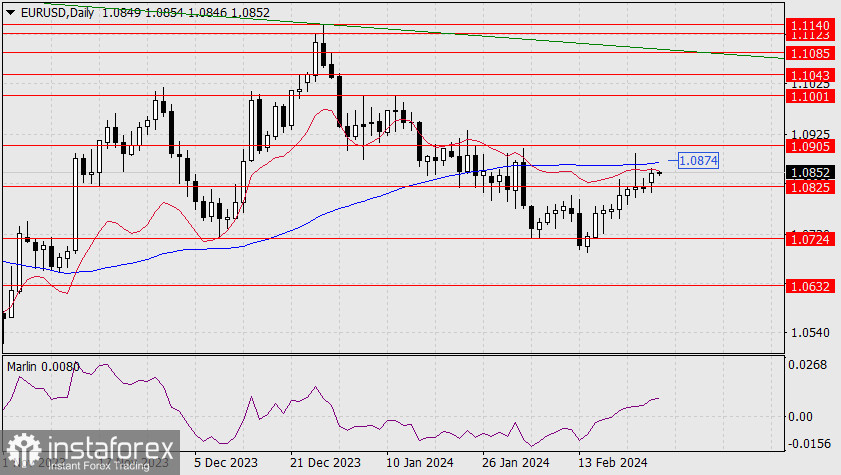
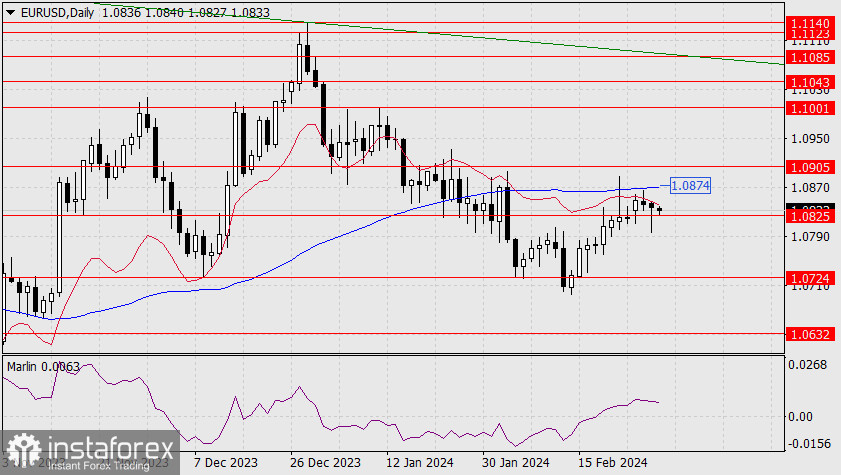
On the daily chart, yesterday's rise in euro halted because of the balance line. The signal line of the Marlin oscillator also turned downward slightly. If the price settles below 1.0825, the pair will move towards 1.0724. EUR/USD faces obstacles not only from the indicator lines but also from the target level of 1.0905. It needs to successfully surpass the level to continue the movement towards the target level of 1.1001 (peak on January 11).

https://forex-images.ifxdb.com/userfiles/20240227/analytics65dd4d0a10e32_source!.jpg

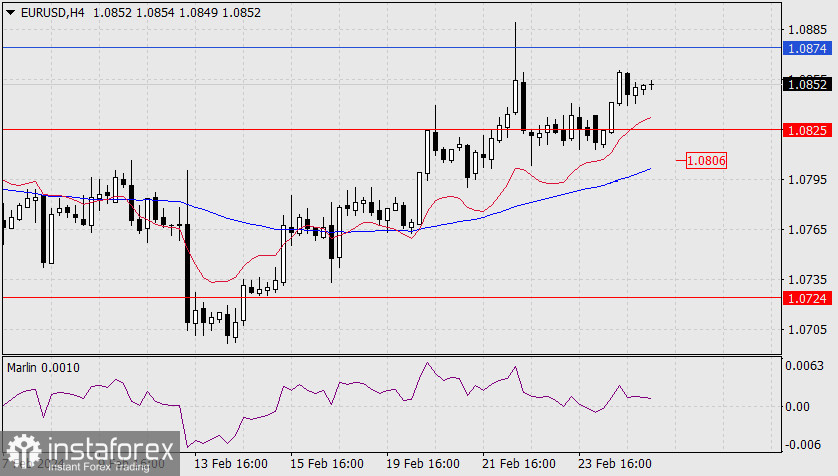
On the four-hour chart, the Marlin oscillator continues to experience pressure and may soon shift downward. However, the price remains above the indicator lines, so the pair may not decline yet. A downward move will occur only when the price settles below the support at 1.0825 and falls under the MACD line support at 1.0806, which coincides with the peak from February 12.

Analysis are provided by InstaForex.

Read More

Re: InstaForex Analysis

FOREX ANALYSIS & REVIEWS: FORECAST FOR EUR/USD ON FEBRUARY 28, 2024

EUR/USD
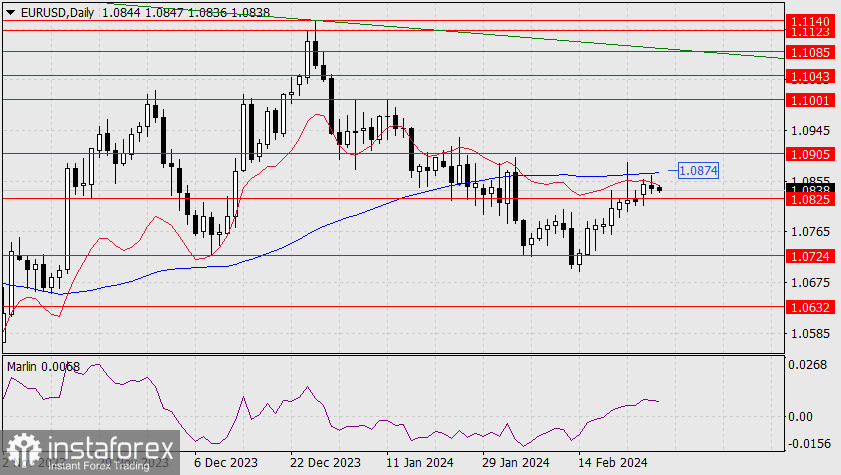
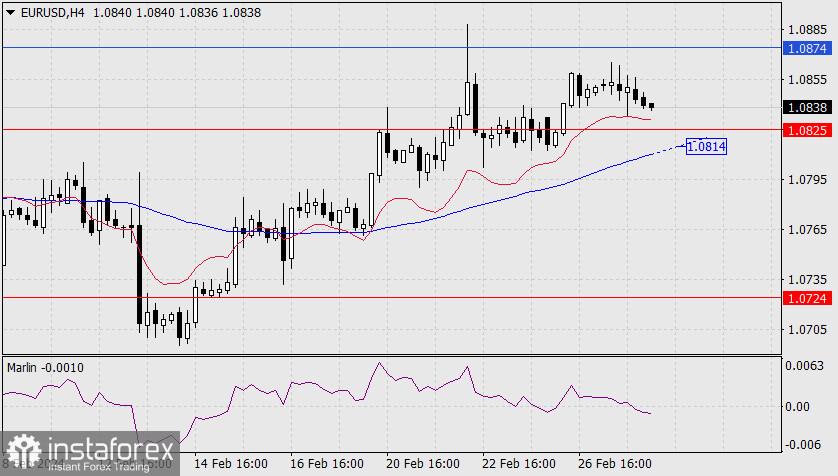
Euro's situation did not change even though the indicators on the daily chart maintained their positions. The price continues to test its strength in both upward and downward movements, leaning towards the downside. This indicates a potential breach of the support level at 1.0825, where a consolidation below the level will likely bring the pair to the target level of 1.0724.

https://forex-images.ifxdb.com/userfiles/20240228/analytics65dea0571963c_source!.jpg

Weak data on durable goods orders and consumer confidence in the US came out, but dollar did not decline. Further movement will depend on the upcoming GDP data for the 4th quarter, which forecasts say will remain unchanged at 3.3%.

https://forex-images.ifxdb.com/userfiles/20240228/analytics65dea06b4493c_source!.jpg

On the four-hour chart, the price appears to be heading towards the balance line. It will test the support level of 1.0825 along with the movement. The MACD line (1.0814) lies slightly below the level.

Without external assistance, such as a decline in stock indices, euro will find it difficult to cross the support levels in a single day. Currently, it has only one ally - the Marlin oscillator, which already arrived at the area of a downward trend.

Analysis are provided by InstaForex.

Read More

Re: InstaForex Analysis

FOREX ANALYSIS & REVIEWS: FORECAST FOR EUR/USD ON FEBRUARY 29, 2024

EUR/USD
On Wednesday, the euro made a strong attempt to break below the support level of 1.0825, but, as we anticipated in yesterday's overview, it did not succeed in just a day. Nevertheless, it made an attempt, and speculative interest is clear. We expect another attack on the aforementioned support level. Traders could receive external help – yesterday, the S&P 500 decreased by 0.17%, and in today's Asia Pacific session, the S&P/ASX200 is losing 0.16%.

https://forex-images.ifxdb.com/userfiles/20240229/analytics65dff3215ab9f_source!.jpg

On Wednesday, U.S. lawmakers, for the fourth time, agreed to extend funding for some government agencies for a week, through March 8, and the rest for another two weeks, until March 22. Obviously, they will be able to approve the final allocation of $1.7 trillion even if they fail to do so in March.

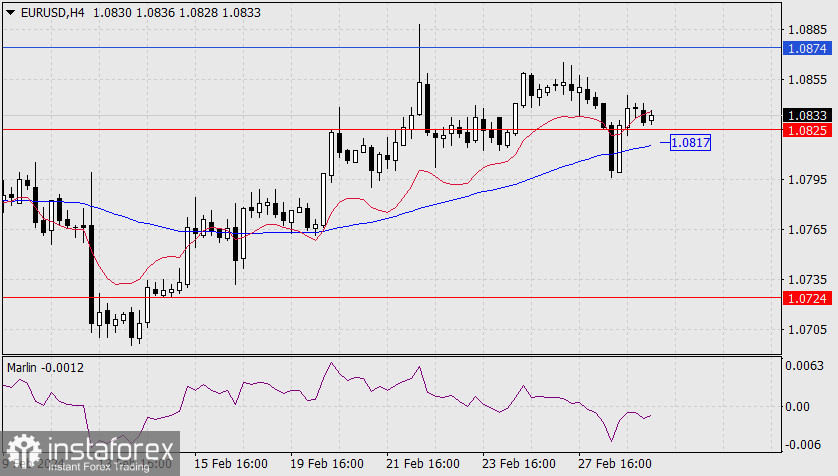
We're waiting for the price to settle below the level of 1.0825 to confirm the market's choice in pushing the pair towards 1.0724. An alternative scenario, suggesting growth above 1.0905, will begin to develop after the price overcomes the resistance of the MACD line (1.0874).

https://forex-images.ifxdb.com/userfiles/20240229/analytics65dff32deb061_source!.jpg

On the 4-hour chart, yesterday, the price failed to settle below the MACD line, rising back above the red balance line. The Marlin oscillator is in its lower half, indicating a predominantly downward trend. In order to support the decline, the price needs to settle below the 1.0817 mark.

Analysis are provided by InstaForex.

Read More

Posts: 1,526 to 1,547 of 1,547

Pages Previous 1 60 61 62

You must login or register to post a reply

Forex Software → Market Analysis → InstaForex Analysis

Similar topics in this forum