Re: RoboForex - Company news and official support

RoboForex enables access to the CopyFX platform in the MT5 terminal

https://roboforex.com/uploads/img/news/main/roboforex-header.jpg

Dear Clients and Partners,

You can now invest using CopyFX via accounts opened in MT5, the trading terminal that is very popular with traders.

CopyFX is RoboForex’s proprietary investment platform for copy-trading. It allows users to copy transactions of successful Traders and earn on their trading strategies or trade on their own and receive additional income from subscribers, the platform’s Investors.

Aspects of investing using CopyFX via MT5 accounts:

  • Investments using CopyFX are available to any hedging MT5 account. All you have to do is to choose a Trader from the Rating and subscribe.

  • To become a Trader, you don’t need to open a new account and trade to create a new trading history – your statistics and trading results are already synced with the platform. To start working, you have to specify subscription conditions, that’s all.

  • You can use the same MT5 trading account to copy transactions of other Traders and let your transactions be copied by Investors.

  • Investors can use three subscription modes, “Proportional”, “Classic”, and “Fixed”, while Traders can work according to the “Without commission” scheme.

  • All transactions are copied instantly; there are no limits for the number of accounts per subscription.

  • Subscriptions are allowed only between MT5 accounts.

How to start investing?

  • Register a new MT5 account or log in to an existing one.

  • Choose the amount to be invested via CopyFX and deposit it using one of the 20 available payment systems.

  • Choose a Trader in the Rating and start copying their transactions.

Are you ready to start earning on investments?

https://b.radikal.ru/b14/2112/53/fe22ddd720a4.png

Read more about CopyFX >
Sincerely,
RoboForex team

Re: RoboForex - Company news and official support

How to Use EPS for Evaluating Shares

Author: Victor Gryazin

https://blog.roboforex.com/wp-content/uploads/2021/12/09.12.png

Dear Clients and Partners,

To choose interesting stocks for investing, market players evaluate carefully various economic indices and statistics. This overview is devoted to one index called Earning per Share, or EPS.

What is EPS?

This Earning per Share index evaluates how profitable a certain company is in terms of one share. This multiplier shows the relation of net profit over a year’s time and the number of its ordinary shares in turnover, giving an idea of what profit can be brought to the investor by each share they buy.

In essence, each shareholder holds their share of the authorized capital of the company that equals to the number of issued shares. The profit made is given proportionally to each shareholder. So, the EPS multiplier reveals how much money out of the invested sum will return to the investor. The higher the EPS, the more profitable it is to invest in the company.

The profit made by the company can be fully or partially given to the shareholders as dividends. Here, things depend on the decisions of the board of directors. Shareholders via their representatives on the board can influence the issue, altering the share of the profit that will be given out to the shareholders in the form of dividends.

How is EPS calculated?

For calculating EPS, we use the net profit minus dividends on privileged shares. the formula is as follows:

EPS = (P – Div) / N

Where:

  • P is the net profit of the company for the reporting period (after taxes)

  • Div is the dividends on privileged shares

  • N is the number of ordinary shares in turnover in the reporting period

Example of calculation:

As an example, let us use Netflix (NASDAQ: NFLX). Over the last financial year, the company reported 2,761,395,000 USD of net profit, while the total number of ordinary shares in turnover was 440,922,000 shares.

The balance report says that Netflix did not issue privileged shares, so in the calculation formula, we subtract nothing.

Dividing the net profit of 2,761,395,000 USD by 440,922,000 shares, we get EPS of 6.26 USD per share.

You can check EPS in economic reports or on websites. For EPS or American companies, for example, go to Finviz.com:

https://blog.roboforex.com/wp-content/uploads/2021/12/eps-1200x599.png

Closing thoughts

EPS gives a chance to assess the potential profit made on one shares of the company you are planning to invest in. The multiplier has equally advantages and drawbacks, so it is recommended to be used alongside other multipliers, P/E being the most frequently used one.

Read more at R Blog - RoboForex

Sincerely,
RoboForex team

Re: RoboForex - Company news and official support

How to Choose Shares for Investing in Correcting Market

Author: Eugene Savitsky

https://blog.roboforex.com/wp-content/uploads/2021/12/08.12.png

Dear Clients and Partners,

Over the last 10 days, the stock index S&P 500 corrected by 5%. Previous correction was longer but amounted finally to just 6%. Since the beginning of 2021, the index has had five corrections, yet the price has never fallen more than by 6%.

Based on this, we can suppose that the current correction is close to an end, and soon the quotations will start growing again. In this case, the question is: which stocks to buy in such a market?

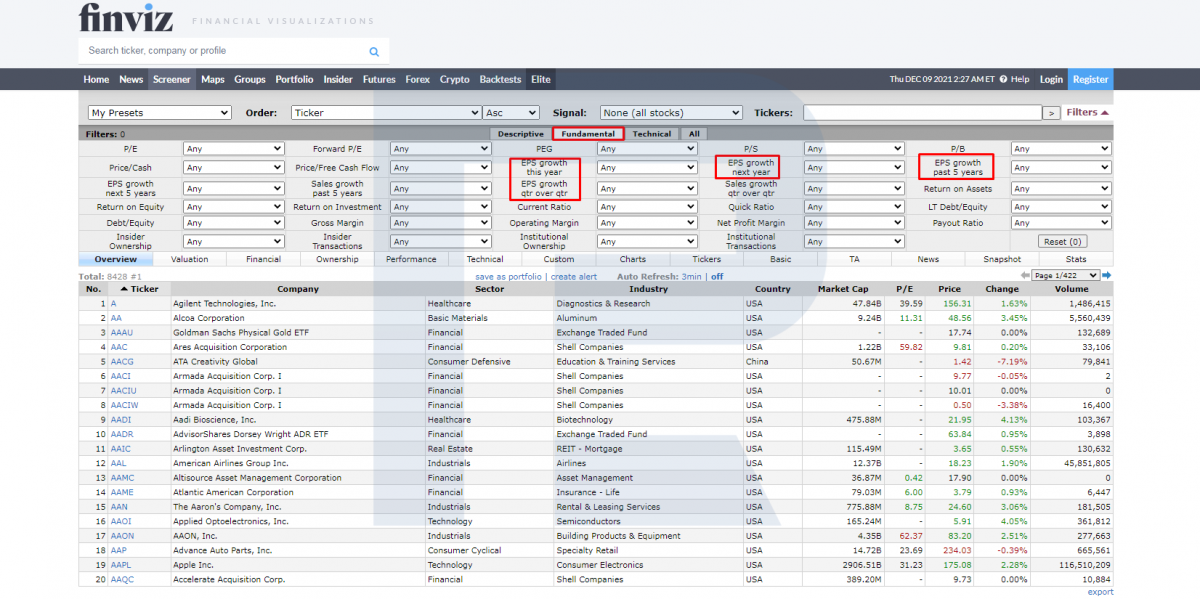
Today, I will drive your attention to major market players and see which shares they prefer investing in.

At present, the top-3 market participants managing a capital of more than 1 trillion USD includes:

  • VANGUARD GROUP INC – 4.2 trillion USD

  • BlackRock Inc. – 3.57 trillion USD

  • STATE STREET CORP – 1.89 trillion USD

I suggest looking into the portfolios of these funds and check their recent investments. I guess, you will be surprised because you will not see there such well-known companies as Apple Inc. (NASDAQ: AAPL), Alphabet Inc. (NASDAQ: GOOG), or Amazon.com, Inc. (NASDAQ: AMZN).

VANGUARD GROUP INC

Let us start with VANGUARD GROUP INC. Note that I range the shares by their “weight” in the portfolio, and these are brand-new purchases, i.e. these shares had not been in the portfolios before.

Number one is Lucid Group, Inc. (NASDAQ: LCID).

Lucid Group, Inc. was founded in 2007. It manufactures cars. This investment is evaluated as 900 million USD. In the last quarter, the average share price of the company was 25.38 USD, while now they are trading for 48 USD.

VANGUARD invested in GXO Logistics about 798 million USD. In the last quarter, the average share price was 78.44 USD and the current market price is 92 USD.

Meanwhile, number three is SoFi Technologies, Inc. (NASDAQ: SOFI).

SoFi Technologies is a financial company founded in 2011. It gives loans for education, refinancing older loans, insurance, mortgage, and provides other financial services.

In SoFi Technologies, VANGUARD invested 751 million USD. In Q3, its average share price was 15.88 USD and the current price is 16.40 USD. Note that with the current price growth, the investments of VANGUARD GROUP already demonstrate profitability.

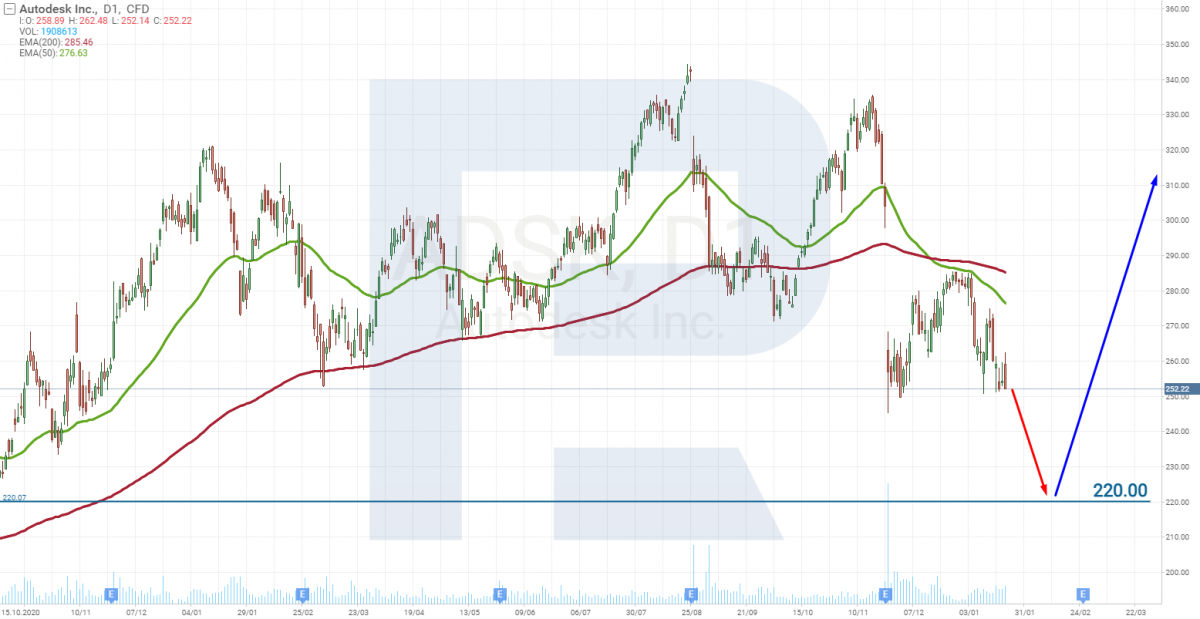
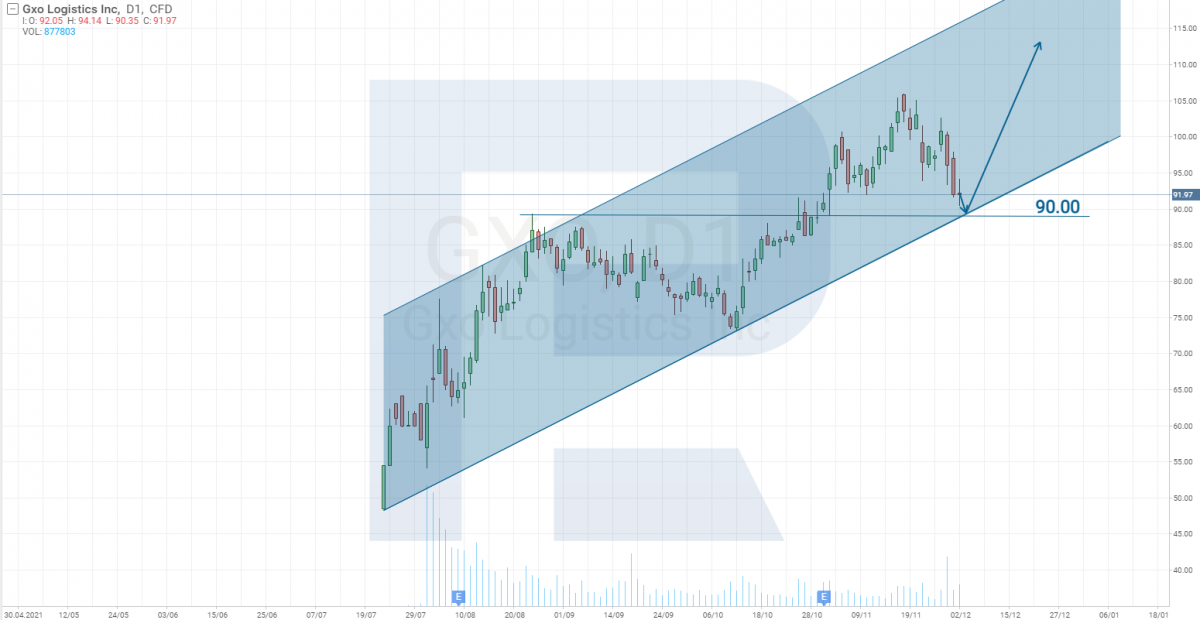
Tech analysis of GXO Logistics shares

Now to the charts of the companies. The shares were bought in Q3, so now we can check how this process affected the share prices of the issuers.

The leader in terms of the sum of investment is GXO Logistics. Since the IPO, the shares of the company have been growing, which is no surprise. Average daily trade volume amounts to 55 million USD. Hedge funds created demand for the shares with their 1.6 billion USD of investments, making the share price grow.

Today, there is an uptrend on the chart, and the quotations have declined to the lower trendline, which means the correction will soon be over, and growth will start again. Another signal to buy the shares will be a bounce off 90 USD.

https://blog.roboforex.com/wp-content/uploads/2021/12/GXO-D1-1200x620.png

Bottom line

Corrections give investors a great chance to buy some shares at lower prices. However, there is always a question, which shares to buy. I suggest that we look for possible investments in the reports of major market players that employ dozens or perhaps hundreds of analysts all over the globe.

All the three funds spent on the shares of the named companies no more than 0.02% of their portfolios, which means in the future they will be investing more, making the shares grow.

Currently, keep a close eye on the charts of the shares, checking for support levels, as with Victoria's Secret & Co quotations. This will be a hint on the price, at which it is better to buy the shares.

Read more at R Blog - RoboForex

Sincerely,
RoboForex team

Re: RoboForex - Company news and official support

RoboForex: changes to the trading schedule (in view of the Christmas and New Year holidays)

https://roboforex.com/uploads/img/news/main/roboforex-header.jpg

Dear Clients and Partners,

We are informing you that there will be some changes to the trading schedule* during the Christmas and New Year holidays.

MetaTrader 4 / MetaTrader 5 platforms

Schedule for trading on DE30Cash and DE40Cash

  • 24 December 2021 – no trading.

  • 27 December 2021 – trading as usual.

  • 31 December 2021 – no trading.

  • 3 January 2022 – trading as usual.

Schedule for trading on CFDs on GDRs

  • 24 December 2021 – no trading.

  • 27 December 2021 – no trading.

  • 28 December 2021 – no trading.

Schedule for trading on other instruments

  • 24 December 2021 – no trading.

  • 27 December 2021 – trading as usual.

  • 31 December 2021 – trading stops at 8:00 PM, server time.

  • 1 January 2022 – no trading.

  • 2 January 2022 – trading as usual.

R StocksTrader platform

Schedule for trading on GER40

  • 24 December 2021 – no trading.

  • 27 December 2021 – trading as usual.

  • 31 December 2021 – no trading.

  • 3 January 2022 – trading as usual.

Schedule for trading on UK100, SPA35, FRA40

  • 24 December 2021 – no trading.

  • 27 December 2021 – no trading.

  • 28 December 2021 – no trading.

  • 29 December 2021 – trading as usual.

  • 31 December 2021 – no trading.

  • 3 January 2022 – no trading.

  • 4 January 2022 – trading as usual.

Schedule for trading on UK stocks

  • 24 December 2021 – no trading.

  • 27 December 2021 – no trading.

  • 28 December 2021 – no trading.

  • 29 December 2021 – trading as usual.

  • 31 December 2021 – no trading.

  • 3 January 2022 – no trading.

  • 4 January 2022 – trading as usual.

Schedule for trading on CFDs on EU stocks

  • 24 December 2021 – no trading.

  • 27 December 2021 – trading as usual.

  • 30 December 2021 – no trading.

  • 31 December 2021 – no trading.

  • 3 January 2022 – trading as usual.

Schedule for trading on other instruments

  • 24 December 2021 – no trading.

  • 27 December 2021 – trading as usual.

  • 31 December 2021 – trading stops at 8:00 PM, server time.

  • 1 January 2022 – no trading.

  • 2 January 2022 – trading as usual.

cTrader platform

Schedule for trading on all instruments

  • 24 December 2021 – no trading.

  • 27 December 2021 – trading as usual.

  • 31 December 2021 – trading stops at 8:00 PM, server time.

  • 1 January 2022 – no trading.

  • 3 January 2022 – trading as usual.

Please take note of the above trading schedule changes when planning your trading activity.

* – This schedule is for informational purposes only and may be subject to further change.

Sincerely,
RoboForex team

30 (edited by Vlad RF 2021-12-23 13:39:02)

Re: RoboForex - Company news and official support

RoboForex receives the "Best Stocks Broker (Global)" Award

https://roboforex.com/uploads/news/2021/best-stocks-broker-2021.jpg

Dear Clients and Partners,

In late 2021, RoboForex became the recipient of the “Best Stocks Broker (Global)” award from the prestigious media Global Business Review.

https://c.radikal.ru/c03/2112/fc/162f13a6a2c0.png

For much of 2021, we were paying extra attention to the improvement of our multi-asset platform R StocksTrader, which allows to invest in a lot of different instruments, including over 3,000 stocks and more than 8,000 CFDs American and European stocks.

  • We extended the list of assets by adding over 700 new instruments.

  • We added the opportunity to invest in SPAC.

  • We enabled access to trading fractional shares.

  • We expanded the platform functionality.

  • We improved the mobile application.

Another award in the "Best Stocks Broker (Global)" nomination is proof that the company is moving in the right direction. It motivates us to consistently improve our products and services for our clients.

Are you ready to try stock trading?

See the quality of our provided services for yourself!

https://d.radikal.ru/d08/2112/d7/7b3b23b801d1.png

Sincerely,
RoboForex team

Re: RoboForex - Company news and official support

What Are Futures and How to Trade Them?

Author: Andrey Goilov

https://blog.roboforex.com/wp-content/uploads/2021/12/24.12.jpg

Dear Clients and Partners,

Many traders start by trading currency pairs, trying later CFDs, stocks, and futures. Today I will be talking about the latter ones.

A futures is a contract between the seller and buyer by which they agree to sell/buy the asset in the future for a set price. Initially, such contracts were meant for companies, so that they could avoid unnecessary expenses.

Here is an example. We sell coffee yet we understand that due to the pandemic, the price for it will only be growing, and quite noticeably. To avoid a steep increase in the price and a decrease in sales, we agree with the supplier on a large supply of beans at the current price but in six months.

If the price for coffee indeed grows in the future, we will only win because we will buy the beans at a lower price. If the price does not grow and even fall, the one to profit from the trade is the seller because they will sell the coffee at a higher price than the current one.

Most often, base commodities for futures contracts are crude oil, wheat, corn, stock indices. Such contracts, as a rule, are trading in the exchange, and real supply of the commodity never happens.

Why are futures interesting to traders?

On the whole, futures contracts are somewhat different from, say, stocks. When an individual trader buys stocks, it is more like an investment, while trading futures is more of a speculation.

Simultaneously, thanks to this peculiarity, futures have certain advantages, unavailable for investments in the stock market. For example, futures are traded almost 24 hours a day six days a week, while shares have a limited trading time.

Another advantage of futures is easier margin requirements when selling than those to stocks. A short position in stocks means selling the asset that has been loaned and then buying this one for less money. For stocks, this trading operation has high margin requirements, while with futures, they are the same for selling and buying.

Futures also allow diversifying certain classes of assets and invest in them more actively.

For example, the share price of an oil company will depend not only on oil prices but also on the work of the management and rivals. However, a futures itself can depend only on the oil price without any factors created by the work of the company and its rivals.

How to trade futures, after all?

To work actively with futures, the trader needs to focus on a limited number of instruments to stay concentrated and accumulate experience. With futures, you can take long and short positions: the direction of the work depends on your tolerance to risk and your goals.

A long position means that you buy a contract and wait for the base asset to grow in the future. Then you sell it at a higher price and make money on it. Risks emerge from the base asset not growing or even falling – this way you lose your money.

A short position means that you sell your futures and wait for the price of the base asset to fall in the future. Here are also risks: if you are in a short position, and the price for the base asset grows, your losses can be unlimited because there are no limits to growth.

There is also such a notion as calendar spread. This is a strategy by which the trader takes both a long and short position in one asset with different delivery dates.

The potential profit emerges from the small difference between the sold and bought contract. If the calendar spread is positive, the trader buys a futures with a shorter delivery term and sells a futures with a longer one. If the calendar spread is negative, they sell the futures with a shorter delivery term and buy the futures with a longer one.

Read more at R Blog - RoboForex

Sincerely,
RoboForex team

Re: RoboForex - Company news and official support

How to Trade Marubozu Candlestick Pattern?

Author: Victor Gryazin

https://blog.roboforex.com/wp-content/uploads/2021/12/16.12.png

Dear Clients and Partners,

This article is devoted to a universal candlestick pattern Marubozu: what it looks like on the chart and in which cases it can be used for trading.

What Marubozu candlestick is

The pattern is named after the only candlestick that it includes – Marubozu. From Japanese, the name is translated as “bald”, “with shaved head”. The candlestick has a large body and almost no shadows, so it looks as if its shadows have been “cut off”, leaving the candlestick with just a “bald” body.

There are three Marubozu types:

  • Marubozu Full almost lacks both shadows;

  • Marubozu Open lacks the shadow at the side of the opening price and has a small shadow at the side of the closing price.

  • Marubozu Close, on the contrary, lacks the shadow at the closing side and a small one at the opening sid

The pattern can consist of any Marubozu, the type does not matter. As for the strength of the candlestick, it is considered quite strong and does not appear too often. When it does appear, however, this means bulla or bears are going to take action.

https://blog.roboforex.com/wp-content/uploads/2021/12/Marubozu.png

Types of Marubozu pattern

Depending on the color of Marubozu body, traders single out two types of the pattern: Bearish Marubozu and Bullish Marubozu. Sometimes you can hear about Marubozu Brothers, which means there are both types of the candlestick: a white bullish and a black bearish candlestick. I would say, one brother tries to push the market upwards (the Bullish Marubozu), while the second brother, on the contrary, plans to send the market down (the Bearish Marubozu).

Bullish Marubozu

The pattern consists of a large white candlestick and demonstrates that bulls are ready to attack. The place on the chart where the pattern forms, indeed, matters. There are two main trading scenarios.

Read more at R Blog - RoboForex

Sincerely,
RoboForex team

Re: RoboForex - Company news and official support

Financial Reports of Companies: Main Reference Point for Investors

Author: Maks Artemov

https://blog.roboforex.com/wp-content/uploads/2021/12/17.12.png

Dear Clients and Partners,

When you are investing in the stock market, you need to account for various factors and data from companies that you will be basing your investment decisions on. One of the most important and complex indicators of success of businesses is the financial report. It helps predict further development of the company and decide whether its shares are worth putting your money in.

Companies that do not have their shares traded in the stock market may not reveal their reports to all those who are curious. On demand, they can provide this information to tax authorities or potential investors. However, only public companies must reveal their financial reports fully.

As a rule, reports are published in open sources or on the websites o companies. The reporting period that ends up in a financial report, can be a quarter, six months, or a year. In certain cases, companies provide reports for longer periods for the sake of clearance of analysis.

Types of financial reports

Internationally accepted practice offers several types of standard reports:

  • IFRS – International Financial Reporting Standard

  • US GAAP – US Generally Accepted Accounting Principles.

The latter standard is used by companies that have their shares traded in US stock markets.

As the name reveals, the IFRS is an international reporting standard. Quite often, the IFRS report is adjusted to the standards of US GAAP for simpler analysis.

How to use financial reports

Having studies financial reports of a company or several companies, an investor can carry out a comparative analysis of their business. This is quite a simple thing to do.

First, choose the companies you would like to compare, but make sure they are working in one sector or make similar products. It would be wrong to compare a company that produces heavy metals and an entertainment company. In such a case, comparison will be incorrect for a number of reasons.

Draw a table of the indicators you are interested in. Thus you can assess the perspectives of development and potential profit from investments. As a rule, for comparison previous reports of both companies are taken, and comparative analysis is carried out that, among other things, helps assess potential dividends and the market sustainability of the company.

If the results of a company are disappointing, hold back from investing in it. Promising companies with innovative products can be an exception, but never forget about increased risks.

Bottom line

There is no reason for an investor to study the whole of financial report. Reports can contain up to 200 pages and some information meant for a very small number of people.

An optimum way out is to choose several indicators and use only them. Note that you need to study the reports for the previous reporting period. To see the full picture, annual reports are usually used.

When making decisions, investors are often perplexed by impulsive statements or negative news about the company. In this case, it will be safer to act based on digits and facts instead of emotions.

Read more at R Blog - RoboForex

Sincerely,
RoboForex team

Re: RoboForex - Company news and official support

What Are Fractional Shares, and How to Use Them for Investments?

Author: Maks Artemov

https://blog.roboforex.com/wp-content/uploads/2021/12/3.jpg

Dear Clients and Partners,

Every day more and more people get interested in investments and the stock market. However, not every investor has a sum substantial for a starting capital. Naturally, you can borrow money from your friends or a bank, but in this case, psychology will work against you, and if you make a mistake, you will have to return the loaned money as well.

Future and beginning investors have a stereotype that they need a serious sum to get started. However, nowadays this idea is not completely fair.

Clearly, a million dollar is more efficient and nicer to invest, but what beginners with a modest capital should do? Here is where fractional shares come to the scene: they let you buy a share even in expensive companies for the money you actually have.

This means you buy a part of a share and become a co-owner of the company. Of course, such a way of shareholding has certain details, and in some cases there is no way to give a voice to a holder of a fractional share, yet there are advantages as well.

What is a fractional share?

A fractional share is a normal share broken down into several parts. There are several reasons for and goals of such a split and one of them is to give small investors an opportunity to buy a share in the company, driving more money into the company.

The share price of many companies is much more than 1,000 USD, which sifts away a lot of potential investors. This is the problem that stock split is to solve.

Where do fractional shares appear from?

  • Consolidation of shares is the process of uniting several shares in one. In this case, so-called remainders appear sometimes. They cannot be united in one share for some reasons and turn into fractional shares in the end.

  • During additional issue of shares new shares get to the market, and shareholders can buy new shares in proportion to those they already have. In this case, fractional shares can also appear.

  • As a result of merger or acquisition of companies fractional shares can also appear. They trade and participate in all other processes as normal shares do, only proportional to their volume.

  • Stocks split of a broker: a broker gathers applications from those who want a certain share, buy it when possible, and spreads it between the participants. However, the share itself is kept by the broker, while fractional shareholders own their parts and can sell it to the broker at any moment.

How to trade fractional shares

There is nothing supernatural in trading fractional shares. The quotations are the same as with a normal share, and you can use any trading strategy.

For example, you can use fundamental analysis alongside tech analysis. If you invest medium-term and long-term, you will have to study the work of the company carefully and spread the money in the portfolio wisely.

Trading fractional shares imposes the same obligations on you and the same risks as when you trade a share or a pack of shares.

Read more at R Blog - RoboForex

Sincerely,
RoboForex team

Re: RoboForex - Company news and official support

RoboForex: upcoming changes to the trading schedule in view of Martin Luther King Jr. Day in the US

https://roboforex.com/uploads/img/news/main/roboforex-header.jpg

Dear Clients and Partners,

We are informing you that due to the public holiday in the USA, Martin Luther King Jr. Day in the US, there will be some changes to the trading schedule*.

MetaTrader 4 / MetaTrader 5 platforms

Schedule for trading on CFDs on US indices (US30Cash, US500Cash, USTECHCash) and Japanese index JP225Cash

  • 17 January 2022 – trading stops at 7:45 PM server time.

  • 18 January 2022 – trading starts as usual.

Schedule for trading on Metals (XAUUSD, XAGUSD) and CFDs on oil (Brent, WTI)

  • 17 January 2022 – trading stops at 7:45 PM server time.

  • 18 January 2022 – trading starts as usual.

Schedule for trading on CFDs on US stocks

  • 17 January 2022 – no trading.

  • 18 January 2022 – trading starts as usual.

R StocksTrader platform

Schedule for trading on US stocks, CFDs on US stocks, and ETFs

  • 17 January 2022 – no trading.

  • 18 January 2022 – trading starts as usual.

Schedule for trading on CFDs on US indices (US500, US30, NAS100)

  • 17 January 2022 – no trading.

  • 18 January 2022 – trading starts as usual.

Schedule for trading on Metals (XAUUSD, XAGUSD) and CFDs on Crude Oil (BRENT.oil, WTI.oil)

  • 17 January 2022 – no trading.

  • 18 January 2022 – trading starts as usual.

cTrader platform

Schedule for trading on Metals (XAUUSD, XAGUSD)

  • 17 January 2022 – trading stops at 7:45 PM server time.

  • 18 January 2022 – trading starts as usual.

Please take note of the above trading schedule changes when planning your trading activity.

* - This schedule is for informational purposes only, and may be subject to further change.

Sincerely,
RoboForex team

Re: RoboForex - Company news and official support

How to Trade USD/CAD Currency Pair?

Author: Victor Gryazin

https://blog.roboforex.com/wp-content/uploads/2021/12/23.12.png

Dear Clients and Partners,

USD/CAD – US dollar vs Canadian dollar – is a major currency pair, popular in the Forex market. Let us see, what influences its quotations and what the main trading methods are.

Some history

Canada is a country with the largest territory in North America. The name of the country stands for “kanata”, which means “settlement, land” in the language of local Indian people. The history of Canada started in 1534 when a French seafarer Jacques Cartier explored the country. One of the first French colonies was founded on the territory of modern Quebec, initially populated by indigenous people.

Canada is a federative country that consists of ten provinces and three territories. As early as the 1850s, the country gave up the colonial Canadian pound and switched to the Canadian dollar. Traders also use a slang name “loony”, from “loon”, the name of the bird on the 1 dollar coin. This bird is a mascot o Canada. Since 1970, the CAD has been a free tradable currency; the monetary policy is regulated by the Bank of Canada, the Central Bank of the country.

The CAD is a popular currency that takes part in 3% of all trading operations of international trade. Many leading countries keep a part of their gold reserves in the CAD. Thanks to free conversion and good volatility, the CAD is one of the seven Forex majors.

Trading characteristics of USD/CAD

USD/CAD demonstrates the relation of the US dollar to the Canadian dollar. The quotation demonstrates how many Canadian dollars you will need to buy one Us dollar. The growth of USD/CAD means that the USD becomes stronger on the expense of the CAD. And when the USD/CAD falls, the CAD becomes stronger against the USD.

Here are several trading characteristics of the USD/CAD:

  • Trading time: the pair trades 24/7 except weekends and holidays. Its trading volumes and volatility reach their peaks during the American trading session when important economic statistics from the USA and Canada is published, influencing the quotations of the pair.

  • Volatility: USD/CAD is a quite volatile pair. Its average daily movements are about 80-100 points. Strong surges bring the volatility to 200-300 points a day for a short while.

  • Spread: this pair is a major, popular and liquid enough for the spread to be small. On popular ECN accounts in normal market conditions it amounts to 1-1.5 points.

Trading USD/CAD

To trade the pair, you can use fundamental analysis, tech analysis, and indicators.

Fundamental analysis
This approach analyzes various fundamental factors: economic statistics, expectations of changes in the interest rate, or the current trend in global currency and commodity markets.

Example:

In 2020, when the stock market collapsed due to the pandemic, global oil prices were falling fast. At that time, two negative factors at once influenced the CAD: the US dollar was growing because investors were fleeting from risks, and oil prices were falling. As a result, the USD/CAD pair was growing fast; one could buy it and hold until its growth stopped with the end of the acute phase of the crisis and the beginning of economic recovery.

https://blog.roboforex.com/wp-content/uploads/2021/12/usdcad-fundament-1020x630.png

Closing thoughts

Thanks to good liquidity, volatility, and a small spread, USD/CAD is actively used by Forex traders. Trading decisions are based on various methods, including analysis of economic statistics, price charts, and indicator signals.

To get started, use a demo account so you could practice and only then switch to a real account with minimal risks.

Read more at R Blog - RoboForex

Sincerely,
RoboForex team

Re: RoboForex - Company news and official support

How to Profit from Growing Uranium Prices?

Author: Eugene Savitsky

https://blog.roboforex.com/wp-content/uploads/2022/01/3.jpg

Dear Clients and Partners,

Market players already understand that in 2022, the QE monetary policy will be coming to an end, and the US Federal Reserve System will increase the interest rate.

This understanding makes investors every time less optimistic and sends stock indices down. For example, NASDAQ Composite (NAS100) has lost 4% since the beginning of the year, and S&P 500 (US500) – 1.5%. Dow Jones Industrial Average (US30) is the only one to withstand the troubles: its decline remains within 1%.

In such a market, do not hurry to buy even those shares that look promising. Their prices may fall even deeper down. However, we still need to look for efficient investment ideas. So, in this article I am driving your attention to the green energy sector and another one that is somewhat connected – the atomic energy sector.

Some history

Canada is a country with the largest territory in North America. The name of the country stands for “kanata”, which means “settlement, land” in the language of local Indian people. The history of Canada started in 1534 when a French seafarer Jacques Cartier explored the country. One of the first French colonies was founded on the territory of modern Quebec, initially populated by indigenous people.

Canada is a federative country that consists of ten provinces and three territories. As early as the 1850s, the country gave up the colonial Canadian pound and switched to the Canadian dollar. Traders also use a slang name “loony”, from “loon”, the name of the bird on the 1 dollar coin. This bird is a mascot o Canada. Since 1970, the CAD has been a free tradable currency; the monetary policy is regulated by the Bank of Canada, the Central Bank of the country.

The CAD is a popular currency that takes part in 3% of all trading operations of international trade. Many leading countries keep a part of their gold reserves in the CAD. Thanks to free conversion and good volatility, the CAD is one of the seven Forex majors.

Looking for clean energy

Renewable energy sources (sun and wind) cannot replace hydrocarbons yet because the humanity has not figured out how to store lots of energy for a long time.

Using solar and wind power, people become dependent on weather.
Meanwhile, hydrocarbons are more user-friendly and reliable, as well as economically efficient. However, it has a negative influence on the environment. Ecological concerns and the threat of global warming make people look for replacements for hydrocarbons.

Options are few:

  • Solar energy

  • Wind energy

  • Sea wave energy

  • Water energy

  • Atomic energy

  • Thermonuclear energy

Why we do not use thermonuclear energy

Thermonuclear energy is a dream of the humanity. First attempts to get electricity from thermonuclear reactions were made as long ago as in 1950. yet, scientists fail to achieve any satisfactory results: they still spend more energy on carrying out those processes than they get in the end.

This sector is developing actively anyway. A good example is the International Thermonuclear Experimental Reactor project, originating back in 1980. Nowadays, no one can confidently say when the dream will come true, while we need electricity every day, and the need for it is growing constantly.

The EU plans to consider atomic energy “green”

Some steps have already been made in this direction. On January 1st, the Euro Commission presented to member countries a draft bill where it is suggested to consider atomic energy ecologically clean. This means financing of nuclear energy plants construction at least until 2045.

Germany opposes constructing nuclear energy plants

Germany speaks against this project, referring to the consequences of nuclear power plants accidents. German government does not only speak against this project – it takes actions.

By January 1st, it had shut down three nuclear power plants, leaving just three more in the energy system of the country, that are also going to be shut down by the end of 2022.

Read more at R Blog - RoboForex

Sincerely,
RoboForex team

Re: RoboForex - Company news and official support

RoboForex improves Affiliate programme conditions

https://roboforex.com/uploads/img/news/main/roboforex-header.jpg

Dear Partners,

We’ve updated our cooperation conditions – now the maximum profit you can earn as a RoboForex partner is 84% of the broker’s revenue.

Payout amounts have been increased from 50 to 70%

The Affiliate programme is now even more profitable: the rates for Cent Affiliate, ECN Affiliate and Pro Affiliate accounts have been increased up to 70% for all partners and the commission is on a daily basis.

We’ve also launched a dedicated server for Pro Affiliate accounts. It will help to distribute the load and increase the order execution speed.

The Loyalty programme conditions have also been improved

A greater number of partners can now join the programme – the minimum commission amount for receiving payouts is now 100 USD.

https://b.radikal.ru/b37/2201/16/5a7260038764.png

Earn more with RoboForex!

Advertising banners and other materials available in your Members Area will help to get the maximum commission of 84%. Do you want to calculate your potential profit? Use the interactive Affiliate calculator.


https://a.radikal.ru/a01/2201/c9/5a7f203611ad.png

Sincerely,
RoboForex team

Re: RoboForex - Company news and official support

The Most Anticipated IPOs of 2022

Author: Vadim Kovalenko

https://blog.roboforex.com/wp-content/uploads/2022/01/7.jpg

Dear Clients and Partners,

Last week, we told you about the IPO of Justworks, the company that created the management accounting platform. Due to the current market situation, the underwriters decided to postpone the IPO to a more favourable period. The underwriters of other IPOs followed in their footsteps, that’s why today, we’ll talk about the most anticipated IPOs of 2022.

SDiscord, a messenger

https://blog.roboforex.com/wp-content/uploads/2022/01/1-ipo.png

The company was established in 2015 with headquarters in San Francisco, California. Developers decided to create a messenger for gamers with a wide range of free services – text, voice, and video chats. Users can communicate while playing without risking disconnecting. It’s particularly important for cyber athletes, who were indeed instrumental in the growth of Discord popularity.

The messenger is compatible with all operating systems, including Windows, macOS, and Linux. In addition to that, it can be installed on a mobile device. Discord’s key competitive advantage is that it can be used even with gaming consoles, such as Xbox and PlayStation. The messenger audience is over 140 million people all over the world.

Microsoft took interest in buying Discord but the acquisition didn’t happen. Now Discord intends to go public at the end of 2022. The preliminary estimate was made during the latest round of financing and amounted to about $15 billion.

Databricks, software for data analysis

https://blog.roboforex.com/wp-content/uploads/2022/01/2-ipo.png

In the last few years, large corporations tend to use data analysis for making management decisions. It resulted in the growth of demand for software intended for this purpose. In 2013, seven scientists from the University of California, Berkeley, founded Databricks. Its speciality is the development of software for BigData analysis.

According to BusinessWire, the global BigData analysis market is expected to reach $142.5 billion by 2024. As a result, the average annual growth rate could be 20%.

Databricks already has over 5,000 clients. Among them are such famous companies as Comcast and T Mobile. In 2020, the company’s revenue demonstrated 75% growth, up to $350 million. The revenue in 2021 is expected to pass $500 million. the company’s goal for 2022 is $1 billion in sales. Databricks capitalization is estimated at $28 billion. The exact IPO date hasn’t been announced yet.

Read more at R Blog - RoboForex

Sincerely,
RoboForex team

Re: RoboForex - Company news and official support

RoboForex improves conditions of Cryptocurrency trading and Affiliate Programme

https://roboforex.com/uploads/img/news/main/roboforex-header.jpg

Dear Clients and Partners,

Trading Cryptocurrencies at RoboForex is now even more profitable: we’ve reduced commissions on Prime accounts and brought our trading conditions as close to the ones offered by cryptoexchanges as possible.

  • 24/7 access to 26 cryptoinstruments
    BTC, ETH, XRP, LTC, BCH, SOL, LINK, TRX, XMR, ADA, and others.

  • A single account for all investments
    You won’t need another wallet or account at a cryptoexchange.

  • Conditions at the level of cryptoexchanges
    Commission for cryptocurrencies on Prime accounts is 0.1%.

https://c.radikal.ru/c43/2202/6a/0233b9abb49d.png

Invest in Cryptocurrencies on the best conditions

https://c.radikal.ru/c22/2202/43/11e5cddafbfb.png

Up to 25% of the company’s revenue on Prime for partners

The conditions of the Affiliate VIP programme for Prime accounts have been improved. The partner commission for attracting new clients is now 25% of the company’s revenue instead of 20% before.

In addition to that, you can also receive up to 20% of your total partner commission within the frameworks of the Loyalty programme. To calculate your potential profit as a RoboForex partner, use the Calculator on our website.

https://b.radikal.ru/b07/2202/1b/05a6ba5831a0.png https://b.radikal.ru/b36/2202/47/46be7b051e53.png

Sincerely,
RoboForex team

Re: RoboForex - Company news and official support

RoboForex is voted the Best Broker of the year by the Traders Union

https://roboforex.com/uploads/news/2022/roboforex-iaft-awards-2021/award-image.png

Dear Clients and Partners,

we are proud to announce that RoboForex has conquered a new peak – in 2021, the broker won new awards from the International Association of Forex Traders in several nominations:

https://a.radikal.ru/a13/2202/9d/9dee26ba05d5.png

We’re sincerely thankful to our clients for their trust and confidence, and want to meet their expectations by providing the most transparent and favourable trading conditions. Assess them yourself:

https://a.radikal.ru/a05/2202/e2/559f02e2a379.png

Sincerely,
RoboForex team

Re: RoboForex - Company news and official support

How to Invest in Metaverse

Author: Eugene Savitsky

https://blog.roboforex.com/wp-content/uploads/2022/01/13.jpg

Dear Clients and Partners,

The stock market expects that the Federal Reserve System will soon increase the interest rate, and this cause a lot of tension. The S&P 500 index has already lost 8% since the beginning of the year and remains in a downtrend. The tech sector is also suffering: over the last three months it has lost 9%, becoming one more outsider.

There is no crisis these days: the interest rate is being raised to cool down the economy a bit, i.e. slow down its growth and avoid forming of a bubble. Hence, the current decline of the indices can be looked upon as a correction.

The decline of stock prices and, consequently, the decline of the capitalization of companies can be used by corporations that manager to accumulate plenty of cash on their accounts during the pandemic. They will start engulfing other companies, so that 2022 can become a year of mergers.

Microsoft Corporation buys Activision Blizzard

The one to get started is Microsoft Corporation (NASDAQ: MSFT): on 18 January, it became known that the company was buying Activision Blizzard Inc. (NASDAQ: ATVI). After such news, the shares of the game company grew by 33%.

The purchase will cost 74 billion USD. Microsoft can afford such spending: according to its fresh financial report, it has about 130 billion USD on the balance.

However, what is important here is not the sum that the IT giant will pay but the direction it is going in. As the official press release goes, buying Activision Blizzard will speed up the development of the game business of the corporation and, most importantly, will provide building blocks for the metaverse.

This confirms the idea that the metaverse is developing, not just in the form of empty talks nowadays but as real mergers that aim at getting closer to the virtual reality.

I have already touched upon this topic in the article about the trends of 2022. Today, it is of exception interest to many — just look at the dynamics of the "metaverse" inquiry in Google.

https://blog.roboforex.com/wp-content/uploads/2022/01/meta.en_.png

Let us get acquainted with several other companies that can increase their revenue thanks to the growth of the virtual reality industry.

Autodesk

Autodesk Inc. (NASDAQ: ADSK) is the largest software provider for industrial and civil building, car industry and entertainment in the world. With Autodesk software, you can create 3D animation for virtual and augmented reality, which is great for the metaverse.

Hedge funds demonstrate vivid interest in the company. Autodesk shares are held in the portfolios of more than 50 investment companies.

According to the report for Q3, 2021 — we will see the results of Q4 only in March — the revenue of the company reached 1.1 billion USD. This was 14% more than in Q3, 2020. EPS grew from 1.04 to 1.33 USD. However, these results turned out more modest than experts had expected, so Autodesk shares dropped and are trading in a downtrend.

They are further pulled down by the general decline in the stock market. Hence, this investment should become a promising one, where you will be waiting for the negative influence to subside. Currently, the optimum purchase level for Autodesk shares will be the support level at 220 USD.

https://blog.roboforex.com/wp-content/uploads/2022/01/adsk-1200x619.png

Adobe

Adobe Inc. (NASDAQ: ADBE) designs software and is well-known for such products as Acrobat, Photoshop, Creative Cloud, and Aero.

Aero is an instrument for designers meant for creating images in the augmented reality and requiring almost no programming skills. Director-general of Adobe Shantanu Narayen considers Aero the best product for metaverse development of these days.

Adobe shares, as well as those of Autodesk, dropped quite a deal after the quarterly report was published. However, the difference is that Adobe revenue lived up to the expectations of experts. Alas, they were unhappy about the forecast for the next year made by the management: EPS is expected to be 12.48-13.7 USD while now it is 10 USD.

With that, the shares lost 20% of the price and keep going in a downtrend. Nonetheless, not all investors support the idea that Adobe shares are to be get rid of. Laura Desmond, a member of the board of directors of the company, used the downtrend to increase the number of the shares in her portfolio. On 7 January she bought 973 shares for about 500 million USD.

Read more at R Blog - RoboForex

Sincerely,
RoboForex team

Re: RoboForex - Company news and official support

How to Trade Piercing Pattern and Dark Cloud Cover?

Author: Victor Gryazin

https://blog.roboforex.com/wp-content/uploads/2022/01/9.jpg

Dear Clients and Partners,

Today the article is devoted to two patterns — the Piercing Pattern and Dark Cloud Cover — their forming and trading principles.

How do the patterns form?

The Piercing Pattern and Dark Cloud Cover are reversal candlestick patterns that predict a correction or reversal of the current trade

These patterns consist of two candlesticks each and mirror each other. The Piercing Pattern forms at the lows of the chart and forecasts a reversal upwards. The Dark Cloud Cover appears at the highs and warns of a decline beginning.

Speaking metaphorically, the emergency of the Dark Cloud Cover in a growing market shows that the bulls are stuck in a serious obstacle, and if they fail to overcome it, a downward correction will follow. And vice versa: if after a market decline the Piercing Pattern appears, the bears are losing the grip, and the bulls are optimistic about an upward reversal.

Dark Cloud Cover

Japanese traders state that this pattern in the chart gives little chance for further growth. The pattern consists of two candlesticks, a white and a black ones.

At the white candlestick, the market is growing actively, and a new local high is set. Thanks to the optimism and the pressure applied by buyers, the next trading session opens with a gap upwards. But then the market falls, and the black candlestick closes in the middle of the body of the white one or even lower.

As a result, the optimism of the bulls reflected in the white candlestick gets fully destroyed by the black candlestick. The bears have managed to recover, stop the bulls, and are ready to fight back.

The farther the closing price of the black candlestick reaches behind the preceding white one, the stronger this signal is considered. The signal can be canceled by the growth of the price above the high of the pattern.

https://blog.roboforex.com/wp-content/uploads/2022/01/clouds-dark.png

Closing thoughts

The Piercing Pattern and Dark Cloud Cover form in a downtrend or an uptrend, respectively. They predict a reversal of the current trend.

Trading by these patterns can be augmented by tech analysis and indicators. In more details, this trading is described in a book called “Beyond Candlesticks: New Japanese Charting Techniques Revealed” by Steve Nison.

Read more at R Blog - RoboForex

Sincerely,
RoboForex team

Re: RoboForex - Company news and official support

What Is Additional Issue of Shares and How Does It Influence Investments?

Author: Maks Artemov

https://blog.roboforex.com/wp-content/uploads/2022/01/10.jpg

Dear Clients and Partners,

When you invest long-term and medium-term, you can face such a stock market phenomenon as additional issue of shares. Not all investors understand how it influences the capitalization of companies or their share prices, so feel vulnerable in such situations. Today’s article is devoted to the details of additional issue of shares.

What is additional issue of shares?

Under additional issue we understand issuing and selling new shares of a company in order to attract new capital. This measure is meant to neutralize negative factors that influence the economic situation of the company, to help expand the business, or to launch new projects that require investments.

How can a company attract money?

A profitable company can allocate a part of the profit to reaching new goals. However, if the size of the profit is not enough or the new project requires a colossal influx of money, the company decides on an additional issue.

Another option is using loans and credits. These require extra expenses on serving them and paying off interests. This is not always profitable and increases the financial load on the company.

The influence of the additional issue on the share price is quite ambivalent. The share price may drop significantly and recovery will take quite long. However, the inflow of finance in the company generated at smaller expense will have a good influence on the company in the future.

What is additional issue of shares meant for?

  1. Attracting extra money to support or develop the business

  2. Increasing authorized capital

  3. Expanding the share of large investors for making them more influential in the company

  4. Avoiding extra expenses on paying off loans

How is additional issue organized?

  1. The board of directors and major investors decide to issue additional shares. They agree on the size of the issue and the initial share price.

  2. The decision is ratified based on the company charter.

  3. The authorities register the additional issue by all legal procedures.

  4. The issued shares are sold among the existing investors of the company. The remaining shares are placed in the stock market where they become available to anyone who wants them.

  5. The company charter gets amended, namely — the charter capital and the number of the shares in turnover.

How does the additional issue influence the share price?

In most cases, additional issue drives the share price down. In the future, the quotations can recover and even grow, but normally it takes quite long, several years sometimes.

Example of additional issue

The N production company had 1 million of shares in turnover that cost $1 each. Hence, the capitalization of the company reached $1 million. The board of directors and the stock meeting decided to attract additional investments sized $500 thousand. The money was necessary for building a new plant and expanding production to enter new markets.

Read more at R Blog - RoboForex

Sincerely,
RoboForex team

Re: RoboForex - Company news and official support

How to Trade Hammer and Shooting Star Candlestick Patterns

Author: Victor Gryazin

https://blog.roboforex.com/wp-content/uploads/2022/02/13.jpg

Dear Clients and Partners,

Hammer and Shooting Star are two popular candlestick patterns. Appearing on the chart, they precede a correction or trend reversal. These two patterns form at the local extremes of the price chart after a lengthy movement.

Hammer

The Hammer pattern indicates a market reversal upwards and forms at the price lows after a descending price movement. The pattern looks like a candlestick with a small body and a long lower shadow, at least three times as large as the body.

The body of the candlestick closes near the highs, the upper shadow is tiny or lacking altogether. The candlestick may be of any colour, with or without a gap from the previous candlestick. A pattern with a white body will be a bit stronger. The candlestick resembles a hammer on a long handle, that is why the pattern got its name.

The Hammer only matters after a serious decline, when the market is oversold. In a downward movement, the bears bump at a strong support level that lets the bulls find a foothold and try to reverse the market upwards. The long lower shadow of the candlestick demonstrates the power of the bulls and their readiness to fight back.

If after the Hammer forms the bulls manage to hold the support level consisting of the pattern low and push the quotations upwards, renewing the high of the candlestick — then an upward correction becomes more possible, which means a good chance to buy. However, if the bears manage to drag the prices under the low of the candlestick, the signal to buy will be cancelled, so that the decline may continue.

https://blog.roboforex.com/wp-content/uploads/2022/02/candle-hammer.png

Shooting Star

Shooting Star indicates a market reversal downwards, appearing at the highs of the price after an ascending movement. This pattern mirrors the Hammer: it consists of a candlestick with a small body and a long upper shadow, at least three times larger than the body.

The body closes near the lows, the lower shadow is small or totally lacks. The candlestick may be of any colour, with or without a gap from the previous candlestick. A pattern with a black body will be a bit stronger. This candlestick looks like a shooting star (a meteorite burning in the atmosphere) that leaves a long trail.

The pattern is significant only after a lengthy decline of the quotations, when the market is overbought. In an ascending movement, the bulls get stuck in a strong resistance level that gives the bears a chance to accumulate forces and push the price down. The long upper shadow of the candlestick demonstrates the power of the bears and their eagerness to reverse the market in their direction.

If after a Shooting star the bears manage to hold the resistance level formed by the high of the pattern, and push the quotations down, renewing the low — then the descending correction becomes more probable and a good chance to sale appears. However, if the bulls manage to raise the quotations above the high of the pattern, the signal to sell will be cancelled, and the upward movement may return.

https://blog.roboforex.com/wp-content/uploads/2022/02/candle-shootingstar.jpg

Trading the Hammer and Shooting Star

As long as these two are reversal patterns, they are to be looked for on the local lows and highs of the price chart in a descending or ascending trend, respectively. These patterns are not recommended for flats except for the cases when they confirm bounces off the borders of the price range.

The patterns are good for trading shares, commodity futures, Forex currencies, etc. They work on larger timeframes by themselves and can be useful for trading intraday when applied alongside tech analysis.

Read more at R Blog - RoboForex

Sincerely,
RoboForex team

Re: RoboForex - Company news and official support

Top 7 Major Currency Pairs on Forex

Author: Victor Gryazin

https://blog.roboforex.com/wp-content/uploads/2022/02/9.jpg

Dear Clients and Partners,

In this article, you’ll find a short review of seven major currency pairs on the Forex market. These pairs are the most popular with traders and investors and are also characterised by high liquidity and low spreads.

EUR/USD

Euro (EUR) is a single European currency, which replaced all national currencies in the European Union in 1999. Given its status, EUR is reflective of the state of economic affairs in the European Union and very sensitive to the macroeconomic statistics from Europe.

The EUR/USD pair is leading the Forex market: its daily trading volume is the biggest – almost 20% of the total trading turnover.

The EUR/USD rate shows the current ratio between currencies of two global economic regions, the EU and the US. If the pair is growing, it means that EUR is getting stronger against USD, and vice versa. Economic and political news from these regions has a significant influence on the EUR/USD rate.

At the very beginning of trading, EUR/USD was moving downwards and once reached the all-time low at 0.8200. For several years after that, the pair was steadily rising and set its all-time high a bit above 1.6000 in 2008.

Later on, due to crises and some troubles in Europe, the pair dropped pretty much. EUR/USD is characterised by high liquidity, low spreads, and daily volatility of about 80 pips.

https://blog.roboforex.com/wp-content/uploads/2022/02/top7-eurusd-1012x630.png

GBP/USD

British Pound (GBP) is the United Kingdom’s national currency. It’s one of the oldest currencies in the world, which approximately appeared in the twelfth century. As a result of the development of trading relations between Britain and its colonies, there emerged a need for a reliable currency to be used in settlements.

GBP/USD shows the ratio between currencies of the United Kingdom and the United States. The pair accounts for 15% of the total currency market trading turnover. “Cable” is a foreign exchange slang term for GBP/USD. The term comes from the days of early telegraph cables that were laid between London and New York and were used to communicate currency quotes and other data.

British Pound is the base currency, while USD is the quote currency. If the pair rises, it means that GBP is getting stronger against USD, and vice versa.

The British Pound is considered a rather aggressive speculative currency, which creates high volatility in GBP/USD, about 100 pips a day. The pair movements often create a lot of false breakouts of support and resistance levels in the price charts.

https://blog.roboforex.com/wp-content/uploads/2022/02/top7-gbpusd-1006x630.png

NZD/USD

New Zealand Dollar (NZD) is the national currency of New Zealand. Its history goes back to the 1970s. In the “colonial” past, New Zealand Dollar was pegged to British Pound and was named New Zealand Pound.

In 1967, the first New Zealand Dollars appeared and they were pegged to USD. New Zealand Dollar is classified as a commodity currency.

Read more at R Blog - RoboForex

Sincerely,
RoboForex team

Re: RoboForex - Company news and official support

Divergence and Convergence in Trading: How to Use Signals

Author: Victor Gryazin

https://blog.roboforex.com/wp-content/uploads/2022/03/3.jpg

Dear Clients and Partners,

This article is devoted to such terms as divergence and convergence as well as their use in trading.

What is divergence

Divergence is the instance when the price chat diverges with the used trading indicator. This looks as follows: in an ascending movement the price chart forms a new high that is higher than the previous one while the indicator shows a high that is no higher than the previous one. This inequality might mean that the bulls are losing power, so next thing a descending correction or even a reversal follows.

A classic divergence consists of two highs of the price chart and two corresponding highs of the trading indicator. One of the most popular indicators for catching divergences is the MACD (Moving Average Convergence/Divergence).

https://blog.roboforex.com/wp-content/uploads/2022/03/diver-1-1012x630.png

How to use convergence and divergence in trading

A divergence or a convergence on the chart is considered a useful trading signal. Many traders fish for them to open or close their positions.

To catch convergences/divergences, various indicators can be used, the most popular of them being the MACD, RSI, and Stochastic. Convergences/divergences can be traded on any highly liquid assets, on timeframes from H1 and higher.

How to sell with divergences

When a divergence appears, it gives a signal to sell: the quotes set a new local high but the indicator does not confirm it. However, quite often signals from divergences go against the current trend, giving a good reason for closing profitable positions because a reversal becomes too possible.

As for opening new positions against the trend, here one needs to be extremely careful. Beginners should rather abstain from this. To open new positions, divergences during corrections are better. If there is a correction of a downtrend, and a divergence appears in the meantime, this is a good signal to sell. Positions should be open by the current trend

Example of selling by a divergence

  • On H1 of GBP/USD in an ascending correction the MACD signaled about a divergence.

  • After a local high formed and the price reversed downwards, a selling position by the trend can be opened.

  • Stop Loss is to be placed behind the last high, and Profit can be taken as soon as a strong support level is reached.

https://blog.roboforex.com/wp-content/uploads/2022/03/diver-sell-1014x630.png

Bottom line

Divergence and convergence stand for the process of diverging/converging of the price chart and the trading indicator. These are good trading signals used for opening and closing positions.

To make signals more efficient, the divergence/convergence should be used alongside other instruments of tech analysis. Before trading for real, practice on a demo account.

Read more at R Blog - RoboForex

Sincerely,
RoboForex team

Re: RoboForex - Company news and official support

Why ChargePoint Shares Are Interesting Investment

Author: Eugene Savitsky

https://blog.roboforex.com/wp-content/uploads/2022/03/5.jpg

Dear Clients and Partners,

Every year, more and more electric cars are sold all over the world. In 2021, 6.75 million electric cars were sold, i.e. 120% more than in 2020. If not for the shortage of semiconductors, the result would have been even more stunning. Today the overall number of sold electric cars in the world reaches almost 16 million, which is 8.5% of all vehicles.

For comfortable driving, electric cars require lots of charging points. The demand for the development of charging stations network makes companies from this segment quite appealing for investments. The leader of the segment is ChargePoint Holdings Inc. (NYSE: CHPT). This is the corporation that this article is devoted to.

What we know about ChargePoint Holdings

This company, founded in 2007, makes equipment and software for charging electric vehicles. As checked on 31 January 2022, Charge Point Holdings manages the world’s largest network of charging stations – 174,000 stations in 16 countries. 51,000 out of them are situated in Europe.

The company has carried out 13 rounds of investments, and the list of those eager to invest in its development features, among other companies, Daimler AG, BMW Siemens AG, Chevron Corp, Toyota Motor Corp, American Electric Power, Canada Pension Plan Investment Board, Singapore GIC, and Chevron Technology Ventures.

Note the participation of Canada Pension Plan Investment Board and Singapore GIC. Such large and conservative trusts investing in the company means that they consider ChargePoint promising.

Moreover, Canada Pension Plan Investment Board and Singapore GIC can now lobby the interests of the company in their home countries. This will not only let the American company increase its presence in the market but also step further away from the nearest rival – such as Blink Charging Co. (NASDAQ: BLNK).

Tech analysis of ChargePont Holdings shares

ChargePoint Holdings shares are trading in a downtrend, and here is an explanation of why it is normal. After the agitation of 2020, the shares of the corporation grew by 220% to 50 USD, and the capitalization reached 16.5 billion USD. However, the revenue at that time only reached 40 million USD.

To compare: the capitalization of ROKU Inc. (NASDAQ: ROKU) is now 16.7 billion USD, while its quarterly income is 865 million USD, and the net profit is 23 million USD.

The share price of ChargePoint Holdings did not stay at such levels for long and started descending gradually. The first strong support level at which market players started buying the shares was at 20 USD and stayed there for long. The quotations tested it 4 times, bouncing off each time and then rising by 30-85%.

https://blog.roboforex.com/wp-content/uploads/2022/03/chpt-1200x620.png

Now the resistance level of 15.5 USD should be noted, and a breakaway of this will be the first signal for possible growth of the price to 20 USD. And then, if the quotations manage to rise over 20 USD, the trend might reverse and start a long-term uptrend. This breakaway will mean a breakaway of the descending trendline.

Closing thoughts

ChargePoint Holdings is the leader in the market of electric car chargers. The growth in the sales of electric cars will provoke stable increased demand for the produce of the company.

Currently, investments in ChargePoint Holdings can be regarded as long-term. The risk here is an increase in the interest rate of the Fed that will make the debts of the company also grow. For now, this is the only weak point.

Read more at R Blog - RoboForex

Sincerely,
RoboForex team

Re: RoboForex - Company news and official support

How to Use Standard Deviation Indicator in Trading

Author: Victor Gryazin

https://blog.roboforex.com/wp-content/uploads/2022/02/18.jpg

Dear Clients and Partners,

Today the article is devoted to the Standard Deviation indicator. It helps evaluate the dynamics of volatility of a financial instrument and find promising entry points.

What the indicator shows

Standard Deviation (STDev) is a trading instrument that shows how far the price of a financial instrument deviates from standard values of a certain period. It shows the deviation from a Simple Moving Average and thus helps to assess the change in the price volatility.

The indicator conditionally belongs to trend ones: when it grows, this might mean the beginning of a new market trend. The higher the volatility and the more the price fluctuates from the average over the chosen period, the higher STDev values will be. And vice versa: if the quotes are stable, trading in a narrow price range, indicator values will fall to the lows.

STDev can be used for trading on its own and alongside other indicators. Also, it is used inside more complicated indicators. For example, it can be found in a famous channel indicator Bollinger Bands: STDev helps to calculate the borders of the price range for the quotes.

Standard Deviation appears in a separate window under the chart and has just one main line. Its values start with 0 and always remain positive, i.e. never drop under 0.

The indicator does not show trend direction. The line will grow alongside the growth of volatility regardless of the market direction, equally when the quotes are growing and falling.

https://blog.roboforex.com/wp-content/uploads/2022/02/stdev-1004x630.png

How to install Standard Deviation

Standard Deviation is built in the majority of popular trading platforms. To install it on the chosen price chart on the MetaTrader 4 and MetaTrader 5 platforms, go to the Main Menu. Your algorithm is: Main Menu – Insert – Indicators – Trend – Standard Deviation.

You can customize the following settings:

  • Period is the period for which the indicator will be calculated. By default, it is 20.

  • Apply to: choose the price that calculations will be based on. By default, it is Close.

  • MA method is the calculation method for the MA. By default, it is Simple.

  • Style sets the appearance of the line. You can change its color, width, and representation method.

https://blog.roboforex.com/wp-content/uploads/2022/02/stdev-settings-en-1003x630.png

Calculating Standard Deviation

To calculate the indicator, use the following formula of statistic average square deviation:

Standard Deviation = Sqrt (SUM ((CLOSE - SMA (CLOSE, N)) ^ 2, N) /N)

Where:

Read more at R Blog - RoboForex

Sincerely,
RoboForex team

Re: RoboForex - Company news and official support

What Are Decentralized Finance

Author: Andrey Goilov

https://blog.roboforex.com/wp-content/uploads/2022/02/19.jpg

Dear Clients and Partners,

Decentralized Finance (DeFi) are an alternative to the traditional banking sector. It includes blockchain apps and services that facilitate digital transactions between the participants directly, without intermediaries. As the crypto community thinks, the current financial system is obsolete, it lacks transparency, and is highly controlled.

DeFi replaces traditional technology by open source protocols, granting access to financial services to anyone. The systems are maintained by the users. Meanwhile, the projects remain open and free of regulators that can block a transaction or deprive a user of access to a certain service.

Services feature crediting, investments, and buying crypto. Thanks to DeFi, those institutions that used to process operations slowly and be prone to human mistakes, became automatic and safe. DeFi provides passive income from storing crypto and save money on transactions and credits.

How DeFi is different from traditional finance

To understand the idea of DeFi and their popularity, it is important to see the difference between it and centralized, or traditional, finance. Here are the main issues of the banking sector that DeFi solves today:

  • Banking services are not available to everyone

  • Financial services include hidden payments

  • Transaction take time.

  • Financial entities have work hours.

In the classic banking sector, money is stores in banks and other financial institutions, the only goal of which is making money. Transactions are processed by third party services that charge fees for their intermediary functions.

Read more at R Blog - RoboForex

Sincerely,
RoboForex team