forex software

Create and Test Forex Strategies

forex software

Skip to forum content

Forex Software

Create and Test Forex Strategies

Forex Software

You are not logged in. Please login or register.


(Page 19 of 72)

Forex Software → Market Analysis → Technical Analysis by FXOpen

Pages Previous 1 17 18 19 20 21 72 Next

You must login or register to post a reply

RSS topic feed

Posts: 451 to 475 of 1,778

Re: Technical Analysis by FXOpen

ETHUSD and LTCUSD Technical Analysis – 28th OCT, 2021

https://i.postimg.cc/VvcCHBm3/ccxopt.jpg

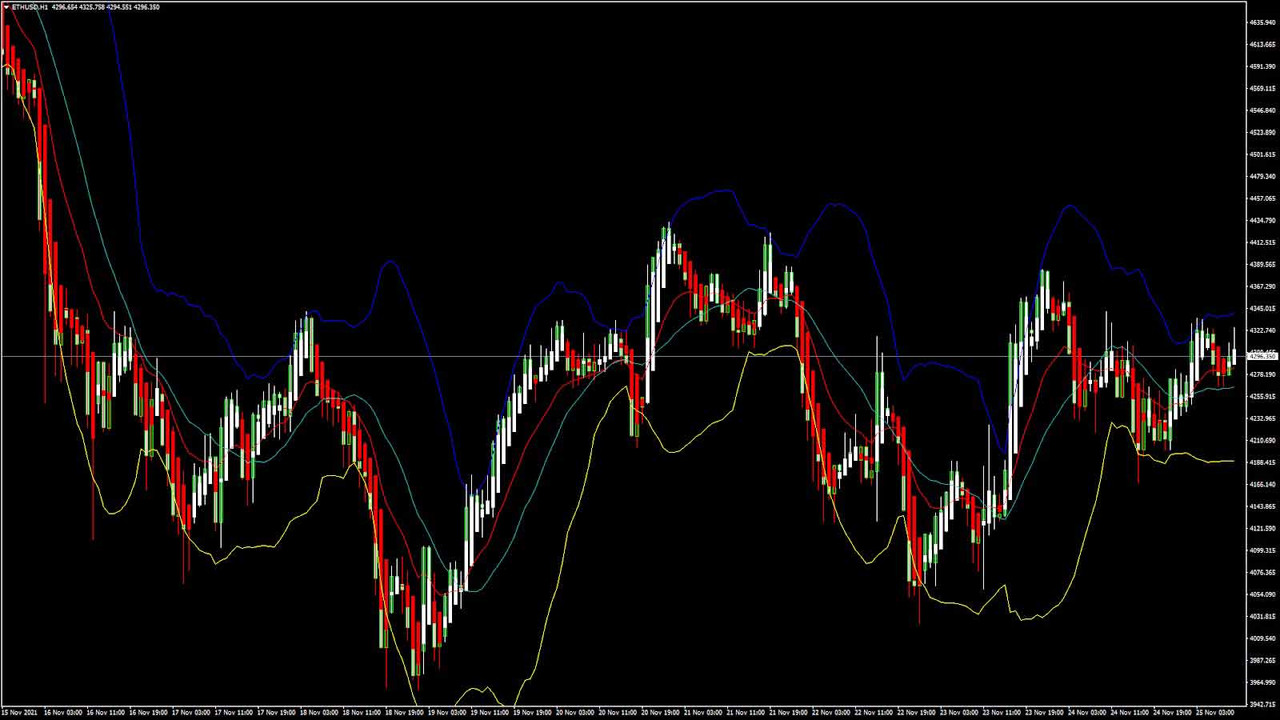
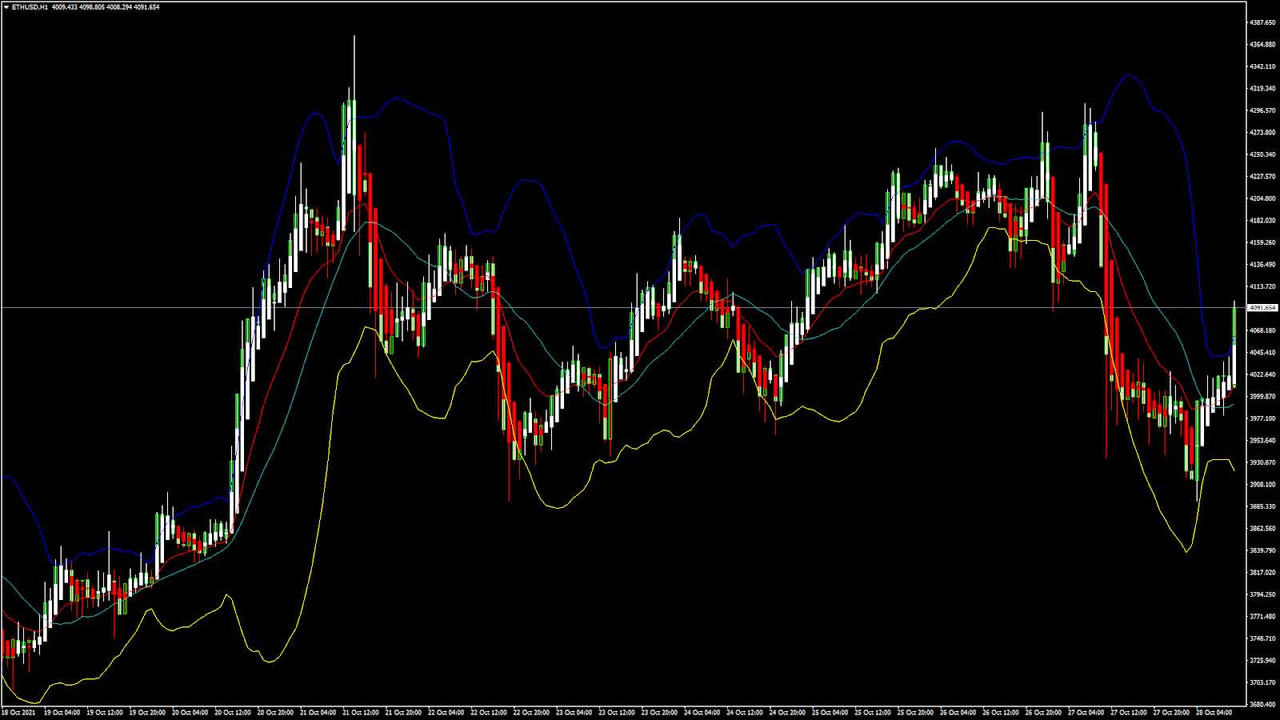
ETHUSD Consolidating Towards $4000

Ethereum had a major bearish correction yesterday breaking down below the $4000 level, after which the price has stabilized and is moving to a consolidation phase towards the $4000 handle.

ETHUSD touched an intraday high of $4298 on Wednesday, after which the prices saw a correction of more than 5%. The pair touched an intraday low of $3913 in today’s European trading session.

ETH is now trading just above its pivot level of $4018 and Camarilla resistance level of $4016. ETH is gaining bullish uptrend today and is about to break its classic resistance level of $4057.

Ether is expected to continue its uptrend move this week and reach the $4400 mark before this weekend. All the major technical indicators are giving a STRONG BUY signal.

ETH is now trading just above its 100 hourly simple moving averages. Moving averages crossover has been detected, signaling a potential change in trend towards $4400.

  • Ethereum recovered its losses and continues to trade above the $4000 level

  • Short-term to medium-term outlooks remain bullish for ETHUSD

  • Average true range indicates less market volatility

  • Moving averages crossover pattern seen in 5 hourly MA

Ether’s Straight Uptrend Towards $4400
https://i.postimg.cc/Wz6kRF4t/ethusdx.jpg

ETHUSD price declined heavily against the US Dollar yesterday, but the dips remained well supported pushing it back above the important psychological level of $4000. ETH price is now building a positive momentum, and we could see some fresh gains in the US trading session today.

ETH is now facing its next major resistance levels of $4100 and $4179 after which the path towards $4400 will get cleared.

The relative strength index is at 56 indicating more upside potential for ETHUSD in the coming days. ETH has gained 2.82% with a price change of +$113.79 in the past 24hrs and has a trading volume of 23.695 Billion USD.

Ethereum To Hit $6000 in 2021

The Ethereum blockchain is moving towards Ethereum 2.0, which is proposed to be a much greener and faster version of the current system. The Altair upgrade to Beacon chain will likely push the prices of ETHUSD further up.

Traders are now waiting for the release of the upgrade, and with renewed buying pressure the prices of Ethereum are expected to touch $6000 before the end of this year.

The Week Ahead

Ethereum price is moving in an uptrend from the starting of this month and the trend is expected to continue this week. We could witness a short-selling in the ETH for some time below the sub$4000 level as seen yesterday, but the dips will remain well supported marking the resumption of the bullish trend.

We have seen moving averages crossover patterns for 5 hourly MA, and also for 5 day MA suggesting that both in the short- to medium-range the bullish outlook will continue.

The price of ETHUSD has already broken 200 hourly simple and exponential moving averages and is on its way towards the $4400 handle this week.

Technical Indicators:

Average directional change (14-day): at 45.57 indicating a BUY

Bull/Bear power (13-day): at 221.075 indicating a BUY

Ultimate oscillator: at 62.62 indicating a BUY

Commodity channel index (14-day): at 282.79 indicating OVERBOUGHT levels

Read Full on FXOpen Company Blog...

Re: Technical Analysis by FXOpen

AUD/USD and NZD/USD Aim More Upsides
https://i.postimg.cc/bJKXHwcv/AUD-3.jpg

AUD/USD started a fresh increase above the 0.7500 resistance zone. NZD/USD also climbed higher and it might aim more upsides towards 0.7250.

Important Takeaways for AUD/USD and NZD/USD

  • The Aussie Dollar started a steady increase above the 0.7480 hurdle against the US Dollar.

  • There is a key bullish trend line forming with support near 0.7520 on the hourly chart of AUD/USD.

  • NZD/USD also gained pace after it broke the 0.7150 resistance.

  • There was a break above a major bearish trend line with resistance near 0.7175 on the hourly chart of NZD/USD.

AUD/USD Technical Analysis

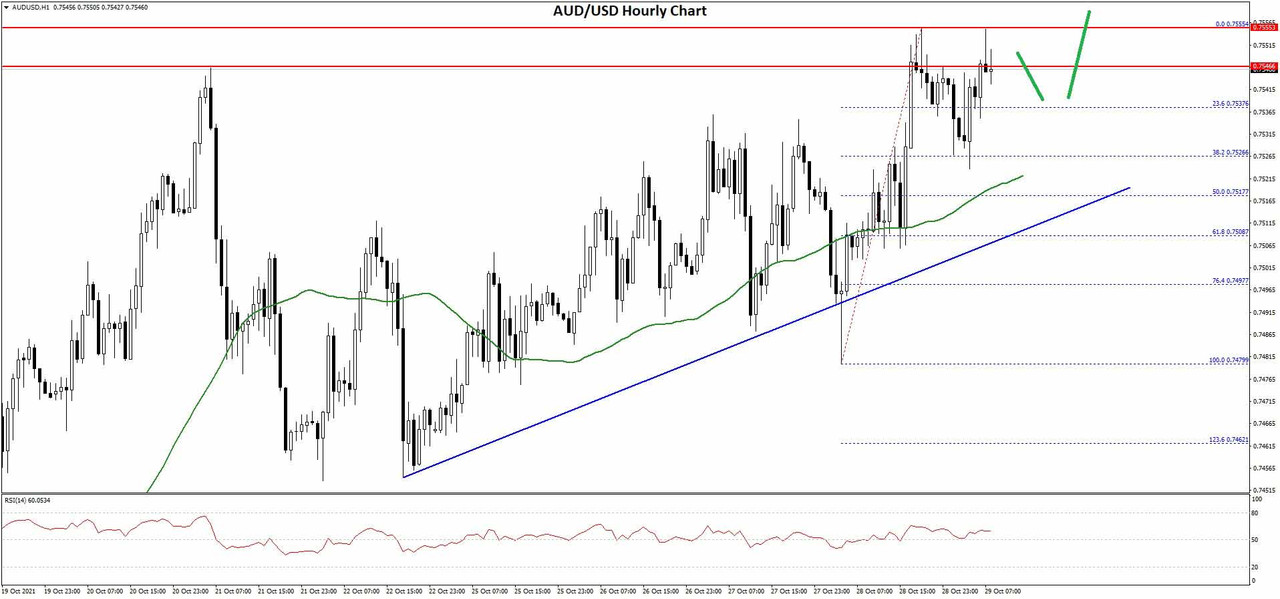
The Aussie Dollar found formed a base above the 0.7450 level and started a fresh increase against the US Dollar. The AUD/USD pair broke the 0.7480 and 0.7500 resistance levels to move into a positive zone.

The pair even broke the 0.7520 and 0.7540 resistance levels. It settled above the 0.7500 level and the 50 hourly simple moving average. A high was formed near 0.7554 on FXOpen and the pair is now consolidating gains.

AUD/USD Hourly Chart
https://i.postimg.cc/cCYpDG0B/AUDUSD-Chart-2x.jpg

It traded below the 23.6% Fib retracement level of the recent wave from the 0.7479 swing low to 0.7554 high. An initial support on the downside is near the 0.7525 level.

The next major support is near the 0.7515 level. It is close to the 50% Fib retracement level of the recent wave from the 0.7479 swing low to 0.7554 high. There is also a key bullish trend line forming with support near 0.7520 on the hourly chart of AUD/USD.

If there is a downside break below the 0.7515 support, the pair could extend its decline towards the 0.7480 level. An immediate resistance is near the 0.7550 level.

The next major resistance is near the 0.7580 level. A close above the 0.7580 level could start a steady increase in the near term. The next major resistance could be 0.7650.

Read Full on FXOpen Company Blog...

Re: Technical Analysis by FXOpen

GBP/USD and EUR/GBP Trade Near Key Support

https://i.postimg.cc/RZjSgjwd/Euro-Pound-Yen.jpg

GBP/USD started a fresh decline and tested the 1.3680 support. EUR/GBP is rising, but it must stay above the 0.8440 support zone to continue higher.

Important Takeaways for GBP/USD and EUR/GBP

  • The British Pound failed to gain pace above the 1.3800 and 1.3830 resistance levels.

  • There was a break below a major contracting triangle with support near 1.3760 on the hourly chart of GBP/USD.

  • EUR/GBP corrected lower from the 0.8475 resistance zone and declined below 0.8460.

  • There is a major bullish trend line forming with support 0.8440 on the hourly chart.

GBP/USD Technical Analysis

The British Pound attempted a key upside break above 1.3820 against the US Dollar. The GBP/USD pair failed to gain momentum and started a fresh decline below 1.3750.

The pair broke the 1.3720 support zone and the 50 hourly simple moving average. There was also a break below a major contracting triangle with support near 1.3760 on the hourly chart of GBP/USD.

GBP/USD Hourly Chart
https://i.postimg.cc/7L0xdmVk/GBPUSD-Chartx.jpg

The pair spiked below 1.3700 and traded as low as 1.3665. It is now consolidating losses above the 1.3665 level. On the upside, the pair is facing resistance near 1.3700. It is near the 23.6% Fib retracement level of the downward move from the 1.3814 swing high to 1.3665 low.

If there is an upside break above the 1.3700 resistance, the price could surpass 1.3720. The next main resistance is near the 1.3740 zone. It is close to the 50% Fib retracement level of the downward move from the 1.3814 swing high to 1.3665 low.

Any more gains could send the pair towards the 1.3800 level in the near term. An immediate support is near the 1.3665 level. A downside break below the 1.3665 support might even push the pair below the 1.3650 support zone.

The next major support is near the 1.3600 level. Any more downsides might call for a move towards the 1.3550 level.

Read Full on FXOpen Company Blog...

Re: Technical Analysis by FXOpen

BTCUSD and XRPUSD Technical Analysis – 02nd NOV, 2021
https://i.postimg.cc/Zq5071WB/cdxopt.jpg

BTCUSD: Bullish Ascending Channel Above $60,000

Bitcoin continues to trade steadily above $60,000 in the European trading session today. Yesterday, we saw the price of BTCUSD plummet below $60,000 but soon with renewed buying pressure it touched an intraday high of $62,443.

The price of bitcoin is now in the consolidation phase after recovering from its losses last week which saw the prices touching a low of $58,212.  This short-term bearish correction is a stepping stone towards its next leg of bull run towards $65,000.

Bitcoin is now moving above its both 100 hourly simple and exponential moving averages. Relative strength index appears to be neutral signifying sideways movements for the time being.

Medium to long term outlook remains bullish for BTCUSD with targets of $70,000 before the end of this month.

Bitcoin is slowly pulling back from the selloff that was seen last week, and is in the process of creating a bullish ascending channel this week.

  • Bitcoin recovered from its losses last week and is now trading above its pivot level of $61,632

  • Williams percent range is indicating OVERBOUGHT level

  • The price is now trading above its classic support level of $61,200

  • All the moving averages are giving a STRONG BUY signal at the current market level of $61,563

Bitcoin: Recovery From Weekend Losses, March Towards $61,500
https://i.postimg.cc/QdNzHbBk/chart.jpg

BTCUSD has gone down by 8% from its all-time high price of $66,987, and we saw that this price action was achieved after sub-bearish moves below $60,000. This is an indication of a fresh upwards move in bitcoin which can break its all-time high level soon.

The price of BTCUSD is now facing its Camarilla resistance level of $61,569 and Fibonacci resistance level of $61,891, after which the path towards $63,000 will get cleared.

In the last 24hrs BTCUSD has gone DOWN by -0.26% with the price change of +104$, and has a 24hr trading volume of USD 34.007 billion.

Bitcoin Volatility Index
https://i.postimg.cc/YqzVrVSC/vcx.jpg

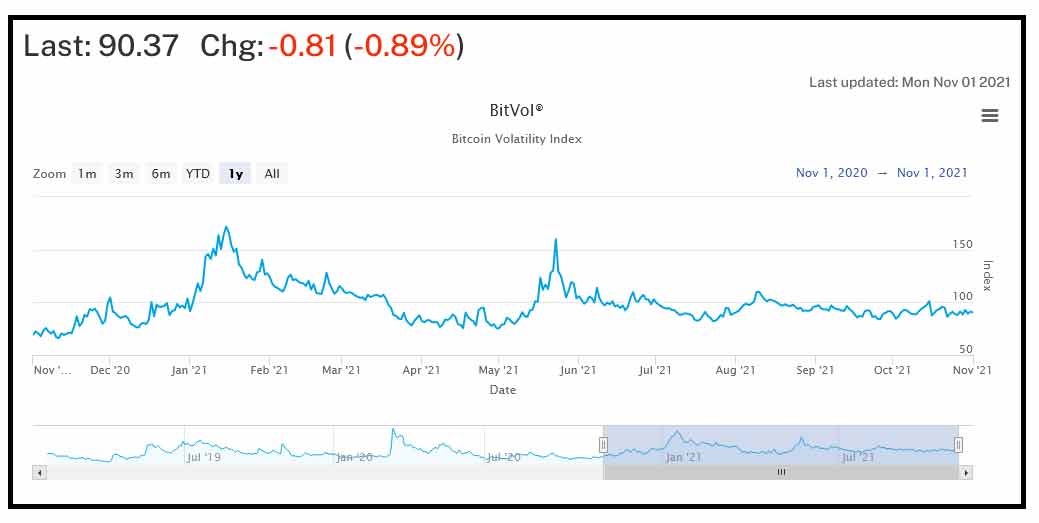
The volatility index of bitcoin shows the constant range of 85 to 95 in the preceding 3 months. This also has a significance since the value of holdings in bitcoin for the investors needs to remain stable.

With the introduction of the bitcoin ETFs, we should expect stable price movement, continued appreciation in the form of attracting more cash investments, and increased total market capitalization.

At present, the TMC of bitcoin is at $1,160 billion USD.

The Week Ahead

The price of BTCUSD is holding above the important psychological level of $60,000 and a positive momentum is seen in the short term range. It is crucial for the price to hold above the $60,000 handle for the next bitcoin rally towards $63,000.

This week, BTCUSD is expected to cross $64,000, and aim for upsides of $66,000 to $68,500 the next week. Both the medium term and long term outlooks remain positive. Next week, we could witness BTC printing above the $65,000 mark.

Technical Indicators:

Bull/Bear power (13-day): at 183.82 indicating a BUY

Commodity channel index (14-day): at 96.86 indicating a BUY

Moving averages convergence divergence (12,26): at 140.50 indicating a BUY

Ultimate oscillator: at 56.51 indicating a BUY

Read Full on FXOpen Company Blog...

Re: Technical Analysis by FXOpen

EUR/USD Faces Hurdle, USD/JPY Remains At Risk
https://i.postimg.cc/W39x8X9T/Euro-EUR-USD.jpg

EUR/USD started a fresh decline from well above 1.1650. USD/JPY is facing resistance near 114.00 and it might start a fresh decline in the near term.

Important Takeaways for EUR/USD and USD/JPY

  • The Euro started a major decline below the 1.1650 and 1.1620 support levels.

  • There was a break below a key bullish trend line with support near 1.1590 on the hourly chart of EUR/USD.

  • USD/JPY is facing a major resistance near the 114.00 and 114.20 levels.

  • There was a break below a key bullish trend line with support near 113.95 on the hourly chart.

EUR/USD Technical Analysis

This past week, the Euro started a major decline from the 1.1690 zone against the US Dollar. The EUR/USD pair traded below the 1.1650 support to move into a bearish zone.

The pair even broke the 1.1620 level and settled below the 50 hourly simple moving average. A low is formed

EUR/USD Hourly Chart
https://i.postimg.cc/Y0hZsYVg/EURUSD-Chartx.jpg

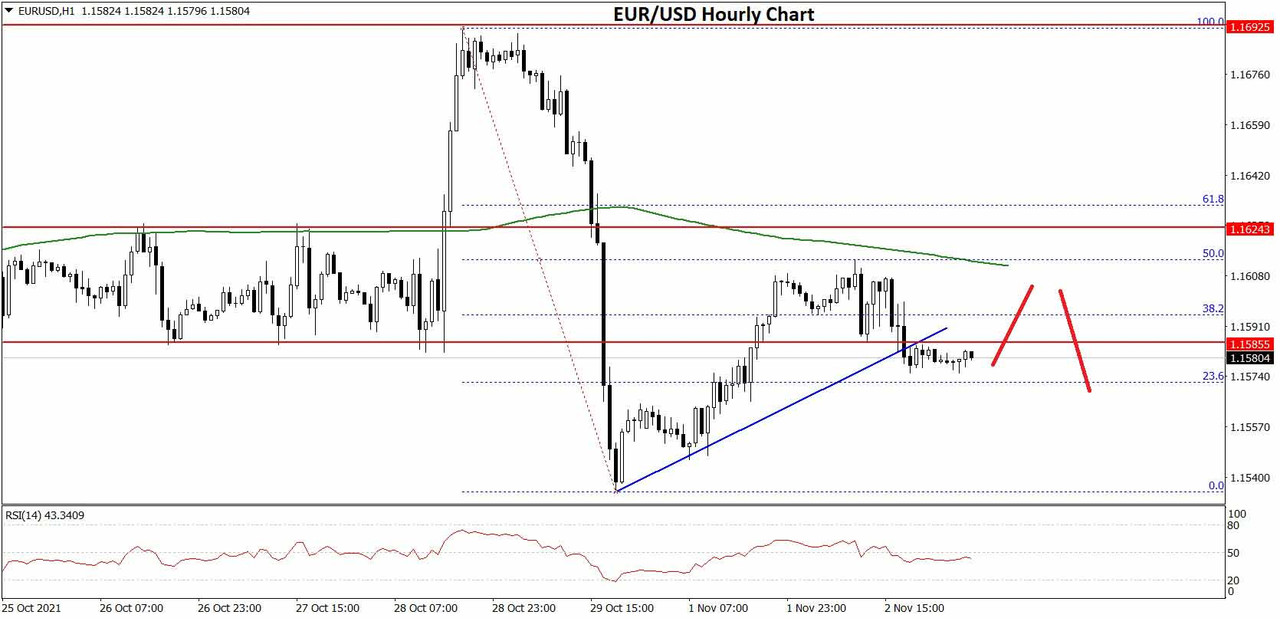
There was a break above the 23.6% Fib retracement level of the recent decline from the 1.1691 swing high to 1.1535 low. It is now facing resistance near the 1.1600 level.

The pair failed to clear the 1.1600 resistance and the 50 hourly SMA. There was also a failure near the 50% Fib retracement level of the recent decline from the 1.1691 swing high to 1.1535 low. As a result, the pair started a fresh decline below 1.1580.

There was a break below a key bullish trend line with support near 1.1590 on the hourly chart of EUR/USD. An immediate support is near the 1.1575.

The next major support is near 1.1550, below which the pair could drop towards the 1.1525 support in the near term. Any more losses may perhaps push the pair towards 1.1500. An immediate resistance is near the 1.1595 level.

The next major resistance is near the 1.1600 level. A clear break above the 1.1600 zone could open the doors

Read Full on FXOpen Company Blog...

Re: Technical Analysis by FXOpen

ETHUSD and LTCUSD Technical Analysis – 04th NOV, 2021
https://i.postimg.cc/Ss3T028M/dc1.jpg

ETHUSD: Bearish Engulfing Pattern Below $4,600

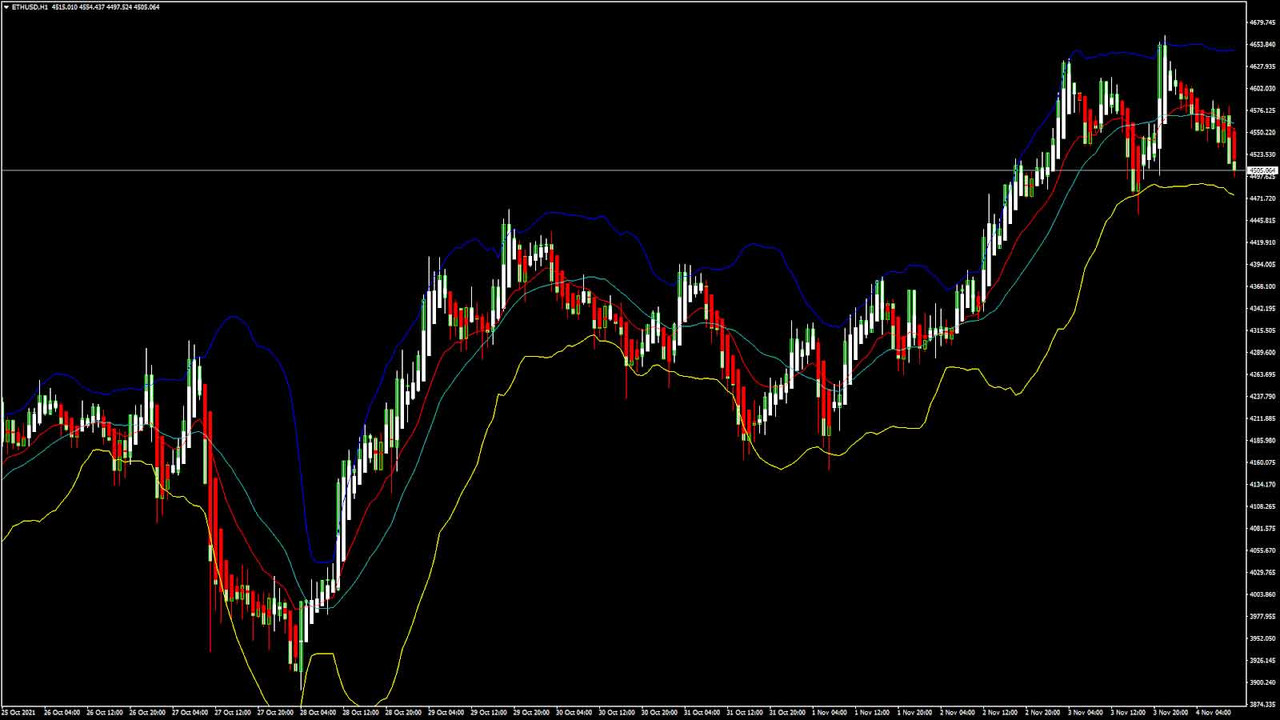
Ethereum has started bearish correction today in the Asian trading session, and the prices continue to break down below the $4,550 level with more downsides. We can see a bearish engulfing pattern below the $4,600 handle which signifies a bearing short-term trend reversal.

ETHUSD touched an intraday high of $4,661 yesterday in the US trading session after which the prices saw a downward correction of more than 4%, touching an intraday low of $4,509 today in the European trading session.

ETH is now trading below its classic support level of $4,544 and Camarilla support level of $4,564. ETH is gaining a bearish downtrend today and is about to break its classic resistance level of $4,057.

Ether is following a bearish path below $4,600 against the US dollar. No recovery seen today as the upsides remain limited and more selling pressure is seen below the $4,550 level.

The bearish correction is expected to continue, and the prices can break the important support levels of $42,00 in the coming days.

All the major technical indicators are giving a STRONG SELL signal.

ETH is now trading just above its 100 hourly simple and exponential moving averages.

  • Ethereum extends its losses below $4,600 with more downsides

  • Short-term range appears to be bearish for ETHUSD

  • Average true range indicates less market volatility

  • Relative strength index is NEUTRAL

Ether Could Extend Losses Below $4,400
https://i.postimg.cc/2yWHCkFX/dc2x.jpg

ETHUSD made an unsuccessful attempt towards the $4,700 level, after which ETH started its decline below $4,550. The selling pressure has increased  today in the ETHUSD, and the next support levels of $4,400 and $4,350 will be tested in the coming week.

We will need to wait for the prices to enter into a consolidation phase after which the trend reversal is possible in the short-term range.

We can see a bearish trend line formation which is expected to touch sub-$4,300 level this week.

The relative strength index is at 45, indicating a NEUTRAL market, and we could see a range bound movement in the prices of ETHUSD in the US trading session today.

ETH lost 1.80% with a price change of +$74.12 in the past 24hrs, and has a trading volume of 20.477 billion USD.

The Week Ahead

Ethereum price has been moving in a downtrend since yesterday, and a short-term trend reversal is seen which is pushing the prices of ETHUSD down. ETHUSD may continue to extend its losses or enter into a consolidation phase at any time.

StochRSI is OVERSOLD which indicates that markets are going to enter into a consolidation phase soon.

We would need to wait before entering the markets at these levels in the short-term range.

The price of ETHUSD has already broken its pivot level of 4,559 and is now about to break its Woodie’s support level of 4,510.

Technical Indicators:

StochRSI (9,6): at 26.63 indicating a BUY

Average directional change (14-day): at 27.75 indicating a NEUTRAL level

Ultimate oscillator: at 40.03 indicating a BUY

Commodity channel index (14-day): at -101.59 indicating an OVERBOUGHT level

Read Full on FXOpen Company Blog...

Re: Technical Analysis by FXOpen

AUD/USD and NZD/USD At Risk of More Downsides
https://i.postimg.cc/RhFzKKgy/AUD-2.jpg

AUD/USD started a fresh decline from well above the 0.7500 zone. NZD/USD accelerated lower and it is now consolidating near the 0.7080 zone.

Important Takeaways for AUD/USD and NZD/USD

  • The Aussie Dollar started a fresh decline from well above 0.7500 against the US Dollar.

  • There is a key bearish trend line forming with resistance near 0.7470 on the hourly chart of AUD/USD.

  • NZD/USD also declined after it failed to clear the 0.7200 resistance.

  • There is a major bearish trend line forming with resistance near 0.7160 on the hourly chart of NZD/USD.

AUD/USD Technical Analysis

The Aussie Dollar failed to stay above 0.7500 and started a major decline against the US Dollar. The AUD/USD pair broke the 0.7450 and 0.7420 support levels to move into a bearish zone.

The pair even broke the 0.7400 support level and the 50 hourly simple moving average. The pair traded as low as 0.7378 on FXOpen and it is now consolidating losses. An immediate resistance is near the 0.7400 level.

AUD/USD Hourly Chart
https://i.postimg.cc/Tw28vnv1/AUDUSD-Chartx.jpg

It is near the 23.6% Fib retracement level of the downward move from the 0.7470 swing high to 0.7378 low. The next major resistance is near the 0.7420 level.

The 50% Fib retracement level of the downward move from the 0.7470 swing high to 0.7378 low is also near the 0.7420 level. A close above the 0.7420 level could start a steady increase in the near term. The next major resistance could be 0.7450.

An initial support on the downside is near the 0.7380 level. The next major support is near the 0.7350 level. If there is a downside break below the 0.7350 support, the pair could extend its decline towards the 0.7320 level. The next major support is near 0.7300, below which the pair could accelerate lower in the near term.

Read Full on FXOpen Company Blog...

Re: Technical Analysis by FXOpen

GBP/USD and GBP/JPY Could Struggle To Recover
https://i.postimg.cc/wjrYTMhg/GBP-1.jpg

GBP/USD declined heavily below the 1.3600 and 1.3550 support levels. GBP/JPY also declined below 154.00 and is currently struggling to recover.

Important Takeaways for GBP/USD and GBP/JPY

  • The British Pound started a major decline below the 1.3600 support against the US Dollar.

  • There is a major bearish trend line forming with resistance near 1.3625 on the hourly chart of GBP/USD.

  • GBP/JPY declined heavily below the 154.60 and 154.00 support levels.

  • There is a key declining channel forming with resistance near 153.20 on the hourly chart.

GBP/USD Technical Analysis

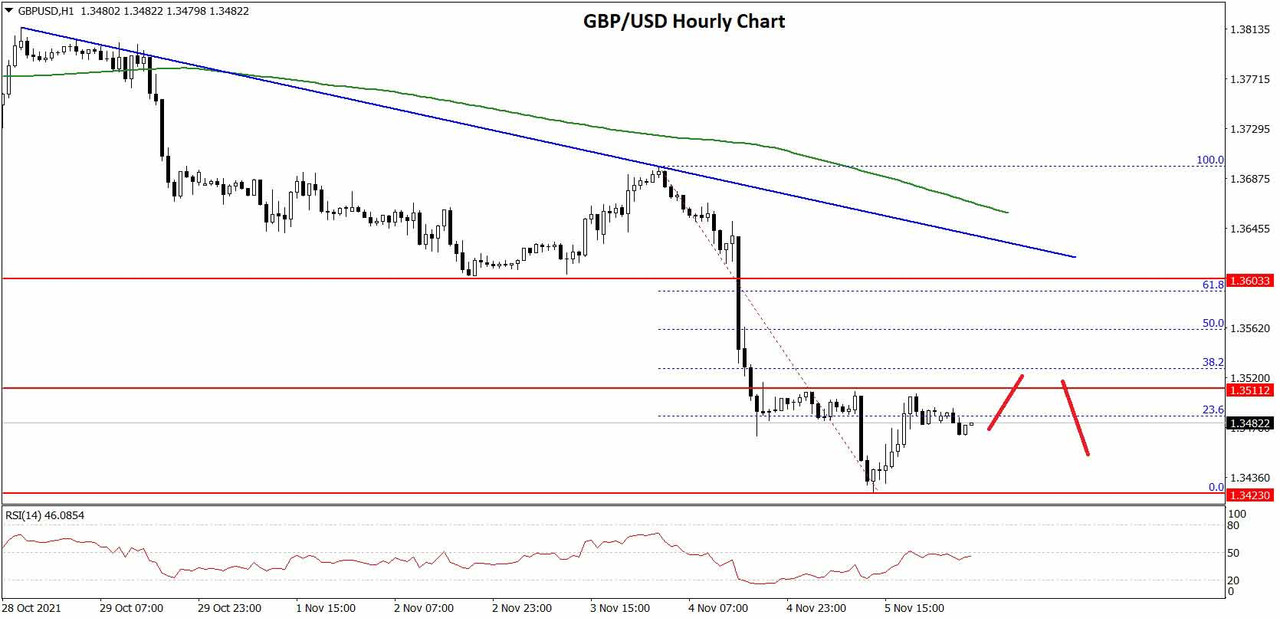
This past week, the British Pound started a major decline from well above 1.3650 against the US Dollar. The GBP/USD pair broke the 1.3620 and 1.3600 support levels.

The pair even settled below the 1.3550 level and the 50 hourly simple moving average. Finally, there was a spike below the 1.3500 support zone. It traded as low as 1.3423 on FXOpen and is currently consolidating losses.

GBP/USD Hourly Chart
https://i.postimg.cc/1zNhgSH6/GBPUSD-Chart-1.jpg

The pair is now facing resistance near 1.3485. It is near the 23.6% Fib retracement level of the recent decline from the 1.3697 swing high to 1.3423 low.

The first key resistance is near the 1.3500 zone. The next major resistance is near the 1.3550 level. It is near the 50% Fib retracement level of the recent decline from the 1.3697 swing high to 1.3423 low.

There is also a major bearish trend line forming with resistance near 1.3625 on the hourly chart of GBP/USD. A close above the 1.3625 level could open the doors for more gains. The next major hurdle is near 1.3660 and the 50 hourly SMA, above which the pair could surge towards 1.3700.

On the downside, an immediate support is near the 1.3450 level. The next major support is near the 1.3425 level. If there is a break below the 1.3425 support, the pair could test the 1.3400 support. If there are additional losses, the pair could decline towards the 1.3350 level.

Read Full on FXOpen Company Blog...

Re: Technical Analysis by FXOpen

Gold Regains $1,800 On Inflation Fears. What’s Next?
https://i.postimg.cc/9fjqKLK5/gold.jpg

Gold has spent the year consolidating. But, curiously enough for market participants, all this time, inflation has been on the rise in the advanced economies all this time.

Most recently, inflation reached levels not seen in decades, running hot in the United States and Europe, two regions where central banks have a hard time generating inflation according to their price stability mandate. But despite the ongoing rise in the prices of goods and services, gold, a traditional hedge against inflation, is powerless. Just the opposite, one may say: it has traded with a bearish tone all year. However, it found important support in the $1,680 area where buyers stepped in.

Last month, gold gained +1.5%, but still ended October down by a little over -6%. Gold equities rallied last month, up by more than +7%, and yet, for the year, they are down close to -12%.

One explanation for gold-related equities and gold’s poor performance is the US dollar index. By the end of October, the dollar index was up by +4.65% on the year, putting pressure on the price of gold.

This is another oddity because the dollar gained while inflation rose, and typically things work the other way around. What will the rest of the trading year bring for gold?

Technical Picture Remains Bullish
https://i.postimg.cc/zfSRrnYL/gold-chart.jpg

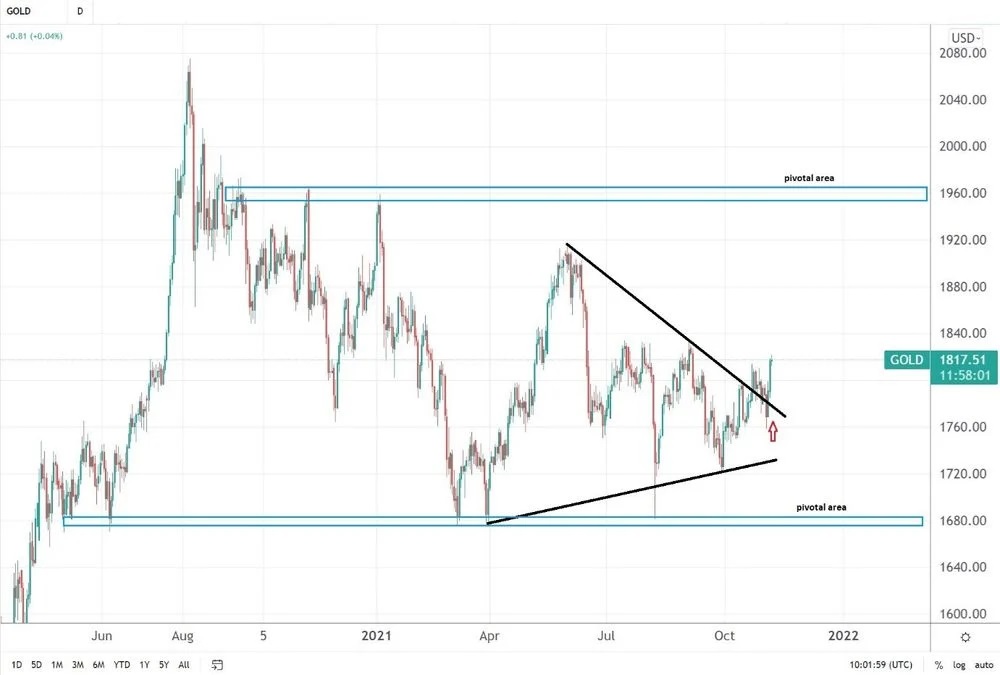
From a technical analysis perspective, the price of gold remains bullish. Two pivotal areas should be mentioned here.

On the one hand, in 2021, the price found strong support at the $1,680 level and has since bounced three times from. On the other hand, the $1,960 is a pivotal area on any move higher. While in between, the price of gold continues to consolidate.

However, judging by the triangular consolidation that just ended, the recent move higher above the upper edge of the triangle indicates more strength ahead. On a daily close above $1,850, traders will push for another run to $1,900.

One thing is clear. If inflation does not cool down in the months ahead, gold will have a hard time remaining at the current level. As such, traders should focus on the bigger picture and adjust their positions accordingly.

FXOpen Blog

Re: Technical Analysis by FXOpen

BTCUSD and XRPUSD Technical Analysis – 09th NOV, 2021
https://i.imgur.com/p0rvooV.jpg

BTCUSD: Bullish Ascending Channel Above $65,000
Bitcoin is moving in a strong bullish ascending channel above the $65,000 handle, and the continuous demand is pushing the prices of BTCUSD higher today in the European trading session. Bitcoin has already crossed its previous all-time high of $67,700 and is now trading above it.

This bitcoin rally is a result of continuous buying pressure and demand for BTC ETFs. The current trend is expected to continue with the immediate targets of $70,000 this week.

We have seen a moving averages crossover for the 5 hourly MA signifying that in the short-term, a downward correction in the levels of bitcoin is expected.

StochRSI is indicating OVERBOUGHT levels signifying that the markets can enter into a consolidation or price recovery phase at any time. Those who are looking to buy at current market levels will have to wait for the downward correction of prices to get an attractive entry for long-term holdings.
Bitcoin is now moving above its both 100 hourly simple and exponential moving averages.

Medium to long term outlook remains bullish for BTCUSD with targets of $70,000 before the end of this month.

Bitcoin is slowly consolidating its gains without any significant drop in its levels today.

  • Average true range indicates less market volatility

  • Williams percent range is indicating an OVERBOUGHT level

  • The price is now trading just below its pivot level of $67,989

  • All the moving averages are giving a STRONG BUY signal at the current market level of $67,860

Bitcoin Rally Towards $70,000 Confirmed
https://i.imgur.com/7tvRupF.png

BTCUSD has already crossed its major resistance level of $64,129 and continues to trade above the important psychological support level of $65,000.

The price of BTCUSD is now facing its Fibonacci resistance level of $67,844 and Camarilla resistance level of $67,914, after which the path towards $70,000 will get cleared.

In the last 24hrs, BTCUSD has gone UP by +3.36% with the price change of +2215$ and has a 24hr trading volume of USD 40.583 billion.

Bitcoin Touches Record Highs on Inflation Fears

Since last week, Bitcoin has witnessed heavy inflow of cash investments with a total value of $95 million USD on US inflation fears. Leading investment firm JPMorgan has already revised its upwards projection for the BTC stating that bitcoin is going to cross $146,000 in the year 2022, and hit the level of $73,000 before the end of 2021.

Next week, bitcoin is also expected to roll out its biggest software update known as Taproot, which will enable increased transaction efficiency and privacy for its users.

Since last week, this news has led to an increase in the total market capitalization of bitcoin by $120 billion USD.

The Week Ahead

If the price of bitcoin continues to hold above the $65,000 handle, we can witness another rally in the markets next week which will eventually push the prices of BTCUSD towards $70,000.

A short-term correction is also expected, pushing the BTCUSD down below the $65,000 mark and also giving more opportunities to fresh buyers in the market. Since the dips in bitcoin remain well supported, there is no possibility of a trend reversal, and the uptrend is expected to continue in the next week.

This week, BTCUSD is expected to cross the $68,000 line and aim for upsides of $69,000 to $69,500 the next week. Both the medium term and long term outlooks remain positive, and next week, we could witness BTC printing at above the $68,000 mark.

Technical Indicators:

Relative strength index (14-day): at 70.04 indicating a BUY

Rate of price change: at 2.835 indicating a BUY

Moving averages convergence divergence (12,26): at 990.80 indicating a BUY

Ultimate oscillator: at 66.44 indicating a BUY

Read Full on FXOpen Company Blog...

Re: Technical Analysis by FXOpen

EUR/USD and EUR/JPY: Euro Could Extend Losses
https://i.postimg.cc/xT6Vb9hF/Euro-Pound-Yen-1.jpg

EUR/USD is struggling to recover above the 1.1600 resistance. EUR/JPY is diving, and it could extend losses below the 130.50 support.

Important Takeaways for EUR/USD and EUR/JPY

  • The Euro started a recovery wave above the 1.1550 and 1.1560 levels.

  • There is a key contracting triangle forming with support near 1.1580 on the hourly chart.

  • EUR/JPY is declining and is trading below the 131.20 level.

  • There is a key bearish trend line forming with resistance near 131.00 on the hourly chart.

EUR/USD Technical Analysis

The Euro started another decline after it struggled to clear the 1.1620 resistance against the US Dollar. The EUR/USD pair broke the 1.1550 support zone to move into a bearish zone.

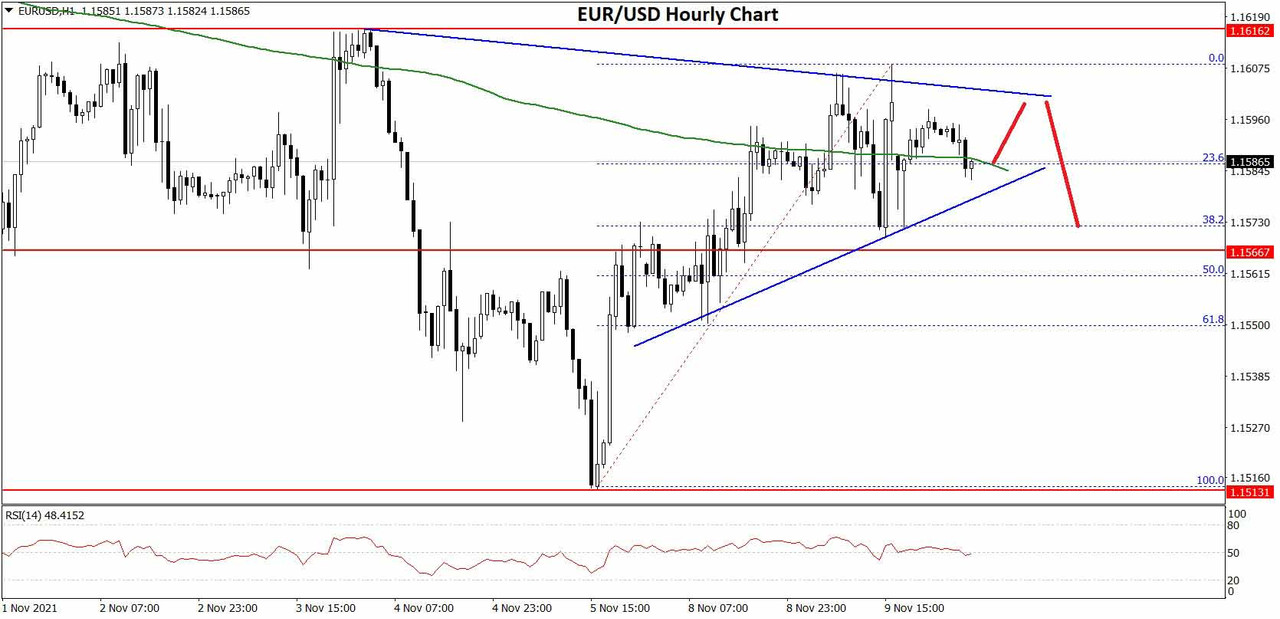
The pair even traded below the 1.1520 support and settled below the 50 hourly simple moving average. A low was formed near 1.1513 on FXOpen and the pair is now correcting losses. There was a break above the 1.1550 and 1.1560 resistance levels.

EUR/USD Hourly Chart
https://i.postimg.cc/sg1dYtRf/EURUSD-Chart-1x.jpg

The pair even spiked above 1.1600 and the 50 hourly simple moving average. However, it is facing hurdles near the 1.1620 level. The pair is now correcting lower and trading near the 23.6% Fib retracement level of the upward move from the 1.1513 swing low to 1.1607 high.

On the downside, the 1.1580 level is a major support. There is also a key contracting triangle forming with support near 1.1580 on the hourly chart.

Any more losses might lead EUR/USD towards the 1.1525 support zone in the near term. The next major support sits near the 1.1500 level. On the upside, the first major resistance is near the 1.1600 level.

The main resistance is near the 1.1620 level. A clear break above the 1.1620 resistance could push EUR/USD towards 1.1665.

Read Full on FXOpen Company Blog...

Re: Technical Analysis by FXOpen

ETHUSD and LTCUSD Technical Analysis – 11th NOV, 2021
https://i.postimg.cc/2yMksWwc/pbx.jpg

ETHUSD: Evening Star Pattern Above $4,500

We observed Ethereum moving in a bearish channel after it touched an all-time high of $4,865, continuing with a sharp drop in profit-taking seen across all the major cryptocurrency exchanges.

The price dynamics of Ethereum has shown an Evening Star pattern above the $4,500 handle, signifying a potential reversal of the bearish trend and the continuation of the medium to long-term bullish trend.

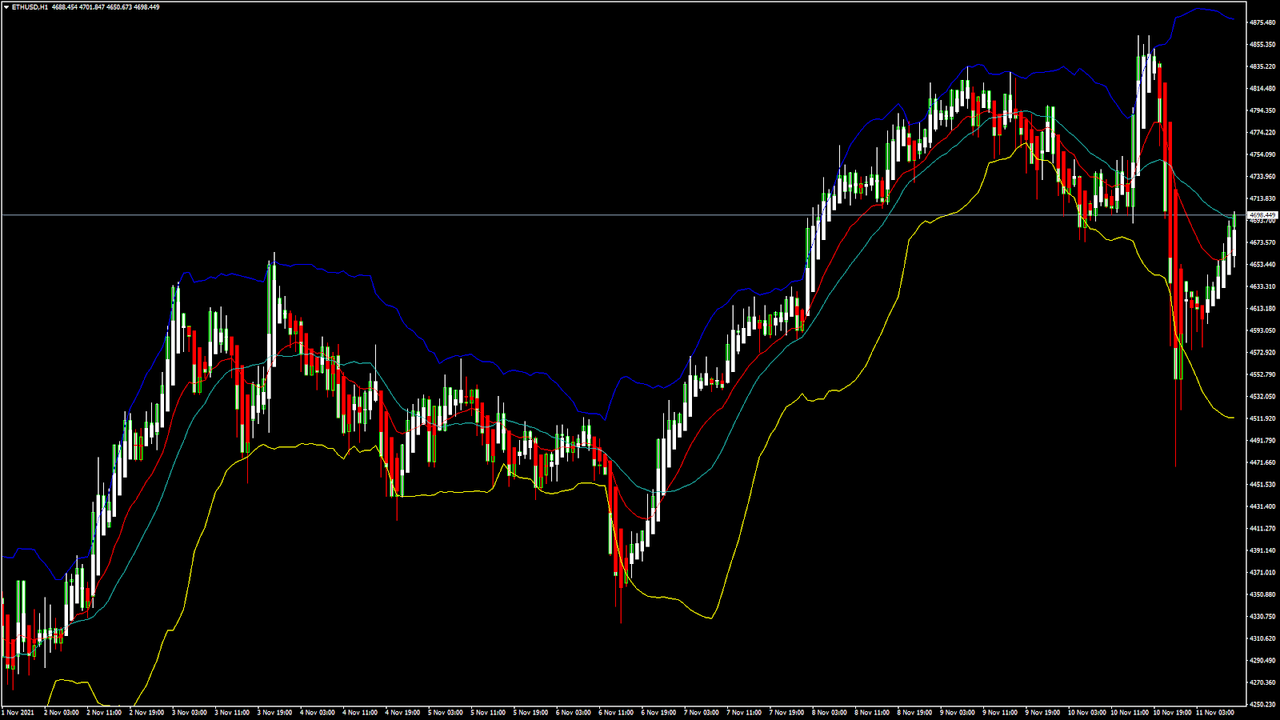
ETHUSD touched an intraday high of $4,847 in yesterday’s US trading session, after which the price saw a downward correction of more than 7%, dropping to an intraday low of $4,471. A consolidation wave towards the level of $4,600 followed next.

ETH is now trading above its classic support level of $4,647 and Fibonacci support level of $4,675. In today’s US trading sessions, it is forming a bearish trend reversal pattern and is about to enter the bullish channel once again.

The bearish correction occurred due to profit taking seen at higher levels, but the dips remain well supported. The price of Ethereum continues to trade above the $4,600 handle in the European trading session.

All the major technical indicators are giving a STRONG BUY signal.

ETH is now trading just above its 200 hourly simple and exponential moving averages.

  • Ethereum trend reversal pattern is seen above the level of $4,500

  • Mid-term range appears to be bullish for ETHUSD

  • Average true range indicates less market volatility

  • Relative strength index is NEUTRAL

Ether Bearish Trend Reversal Above $4,500 Confirmed
https://i.postimg.cc/J0G7YxbH/etx.png

ETHUSD has been surging in a steep trend line since 20th Jul, 2021 when it was ranging at the level of $1,700, yielding its long-term investors profits on a continuous basis.

The uptrend rally is not yet over, and we are still awaiting for Ether to cross the $5,000 handle, after which more upsides will be seen towards the $5,200 to $5,500 range in the coming months.

At present, the price of Ethereum is in a aub-consolidation phase, forming a bearish trend reversal pattern since yesterday.

The relative strength index is at 45, indicating a NEUTRAL market; we could see a range bound movement in the prices of ETHUSD in the US trading session today.

ETH has lost 0.22% with a price change of -$10.33 in the past 24hrs, and has a trading volume of 23.638 billion USD.

The Week Ahead

We have seen a moving averages crossover in the 5-hour range, which signifies a short-term potential trend reversal. ETHUSD will need to remain above the $4,700 handle for the bullish trend confirmation, and this week, we are looking for levels of $4,800 to $4,950.

StochRSI is OVERBOUGHT which indicates that the prices are going to REVERSE very soon.

The current levels are very attractive for entering into the markets with the target of $5,000.

The price of ETHUSD has already broken its pivot level of $4,674 and Fibonacci resistance level of $4,700. We should see the prices of ETHUSD touching an all-time high again next week, printing at above the $5,000 handle.

Technical Indicators:

Stoch (9,6): at 74.34 indicating a BUY

Average directional change (14-day): at 21.96 indicating a BUY

Ultimate oscillator: at 68.83 indicating a BUY

Commodity channel index (14-day): at 60.54 indicating BUY

Read Full on FXOpen Company Blog...

Re: Technical Analysis by FXOpen

Gold Price Gains Momentum While Crude Oil Price Faces Hurdle
https://i.postimg.cc/y6MXLgHW/Gold-price-oil-price.jpg

Gold price is trading in a positive zone above the $1,825 support. Crude oil price is facing hurdles near $82.20 and $83.00.

Important Takeaways for Gold and Oil

  • Gold price started a decent increase above the $1,820 resistance against the US Dollar.

  • There is a key bullish trend line forming with support near $1,842 on the hourly chart of gold.

  • Crude oil price is struggling to gain pace for a move above the $82.20 level.

  • There was a break below a major bullish trend line with support near $81.65 on the hourly chart of XTI/USD.

Gold Price Technical Analysis

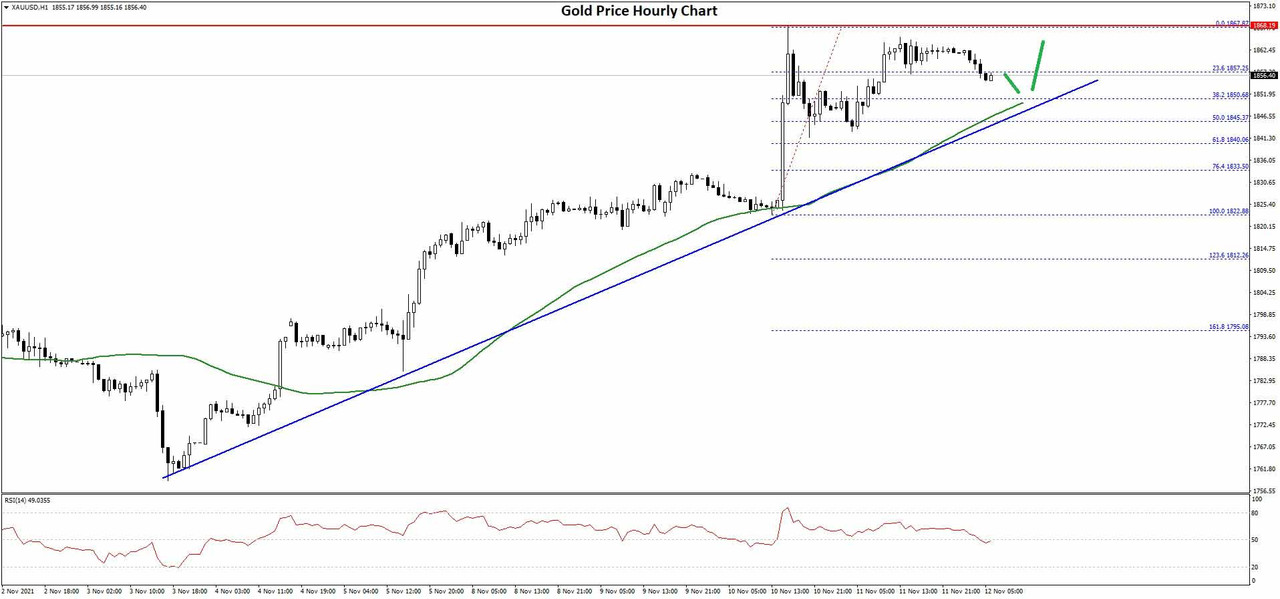
Gold price started a fresh increase above the $1,800 pivot level against the US Dollar. The price gained pace and it was able to settle above the $1,820 resistance zone.

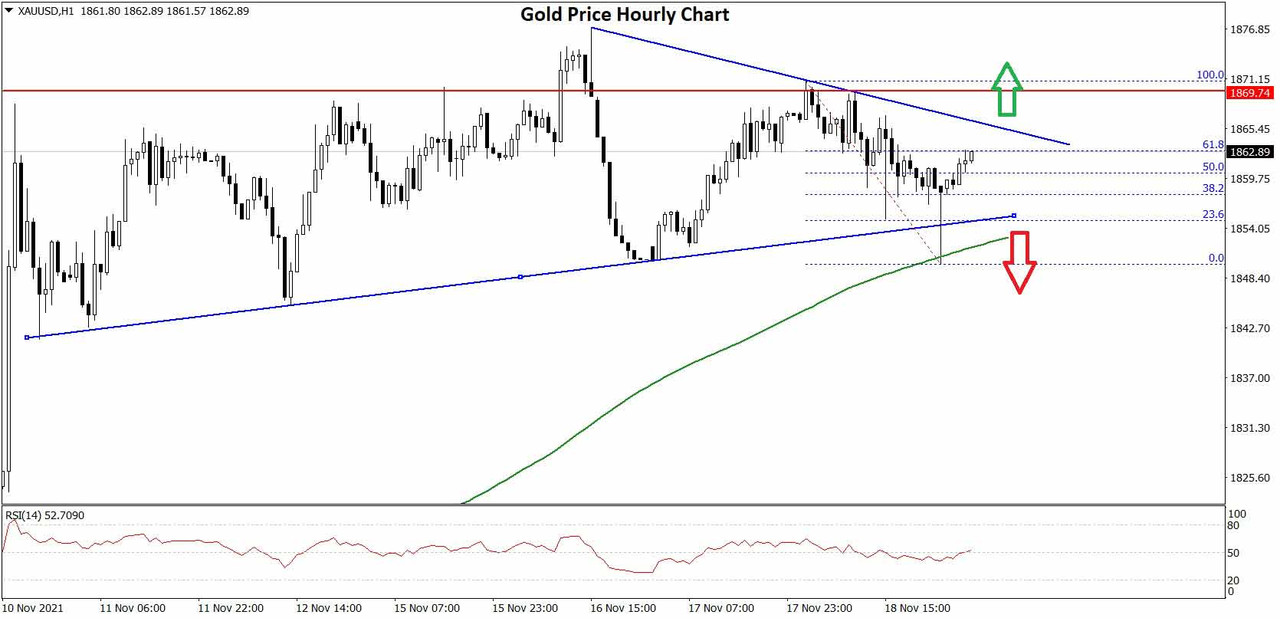
The price even settled above the $1,820 level and the 50 hourly simple moving average. Finally, there was a break above the $1,850 level. A high was formed near $1,867 on FXOpen and the price corrected lower. There was a break below the $1,860 level and the $1,855 support.

Gold Price Hourly Chart
https://i.postimg.cc/xjJ3GGBW/Gold-Price-Chartx.jpg

The price even traded below the 50% Fib retracement level of the upward move from the $1,822 swing low to $1,867 high.

However, the bulls remained active near $1,842. The price is also stable above the 61.8% Fib retracement level of the upward move from the $1,822 swing low to $1,867 high. Besides, there is a key bullish trend line forming with support near $1,842 on the hourly chart of gold.

The price is back above the $1,855 level and the 50 hourly simple moving average. An immediate resistance on the upside is near the $1,862 level.

The main resistance is near the $1,870 level. A close above the $1,870 level could open the doors for a steady increase towards $1,885. The next major resistance sits near the $1,900 level. On the downside, an initial support is near the $1,855 level.

The first major support is near the $1,850 level. A downside break below the $1,850 support zone may possibly spark a steady decline. In the stated case, the price could test the $1,820 support.

Read Full on FXOpen Company Blog...

Re: Technical Analysis by FXOpen

EURO AT MULTI-MONTH LOW
https://i.postimg.cc/9MbgfcXs/eur1.png

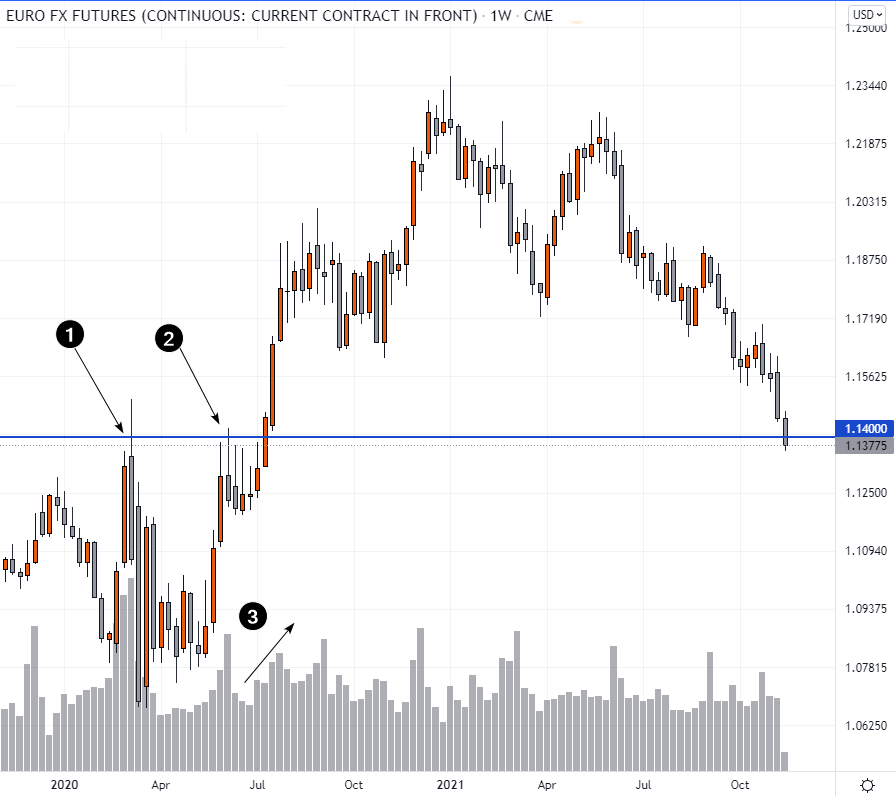
This Tuesday morning, the euro futures on the CME are trading below the psychological level of 1.14. Compared with the May 25 high of 1.227, the drop has already amounted to more than 7%. The last time the euro traded below 1.14 was in July 2020.

One of the drivers that pushed the euro below the 1.14 level was European Central Bank President Christine Lagarde’s Monday comments. She positioned that inflation would remain high in the Eurozone for longer than previously expected. “Despite the current inflation surge, the outlook for inflation over the medium term remains subdued,” she said.

But it is too early to raise the interest rate. Given the time lag characteristic of monetary policy implementation, tightening measures would do more harm than good, Lagarde added.

This means that the euro emission policy will continue, so the EURUSD rate has reasonably decreased, but from a technical point of view, we can expect a rebound.

The 1.14 mark served as a strong resistance (1) in stormy March 2020. In June, this level proved its significance once again (2), but was broken through upwards against growing volumes (3) in July 2020. Now we may see 1.14 acting as support and being effective at least to some degree, which, however, may prove to be sufficient for speculation on the short-term horizon.

FXOpen Telegram Channel

Re: Technical Analysis by FXOpen

SATOSHI NAKAMOTO'S IDENTITY COULD BE REVEALED IN COURT

The identity of bitcoin creator Satoshi Nakamoto, who had appeared exclusively online before vanishing in 2011, remains a mystery. The glory of the creator of the world’s principal cryptocurrency and alleged holder of 1.1 million bitcoins haunts many a crypto enthusiast.

Various versions suggest that the bitcoin creator hiding under the pseudonym is Dorian Nakamoto, Nick Szabo, or Hal Finney, but these theories have not been confirmed.

Today, the person in the media spotlight is Craig Wright, a programmer who, for several years now, has been claiming he is the notorious Satoshi Nakamoto. While the general public considers the evidence he’s presented to be inconclusive, his story has taken an unexpected turn.

The family of Dave Kleiman, a programmer who contributed to bitcoin’s creation but died in 2013, sued Wright in Florida, demanding that he share the 1.1 million bitcoins. The family's lawyer claims to possess evidence that Kleiman had mined the coins that are stored in Satoshi's wallet.

It is up to the court to rule out whether Wright is who he claims to be and whether he should share his stash of bitcoin. One important thing is that if Satoshi's identity is confirmed, Wright will become the most authoritative personality in the crypto world, dramatically affecting the BTCUSD rate.

So far, bitcoin has been weakening, which we talked about in our earlier publications.

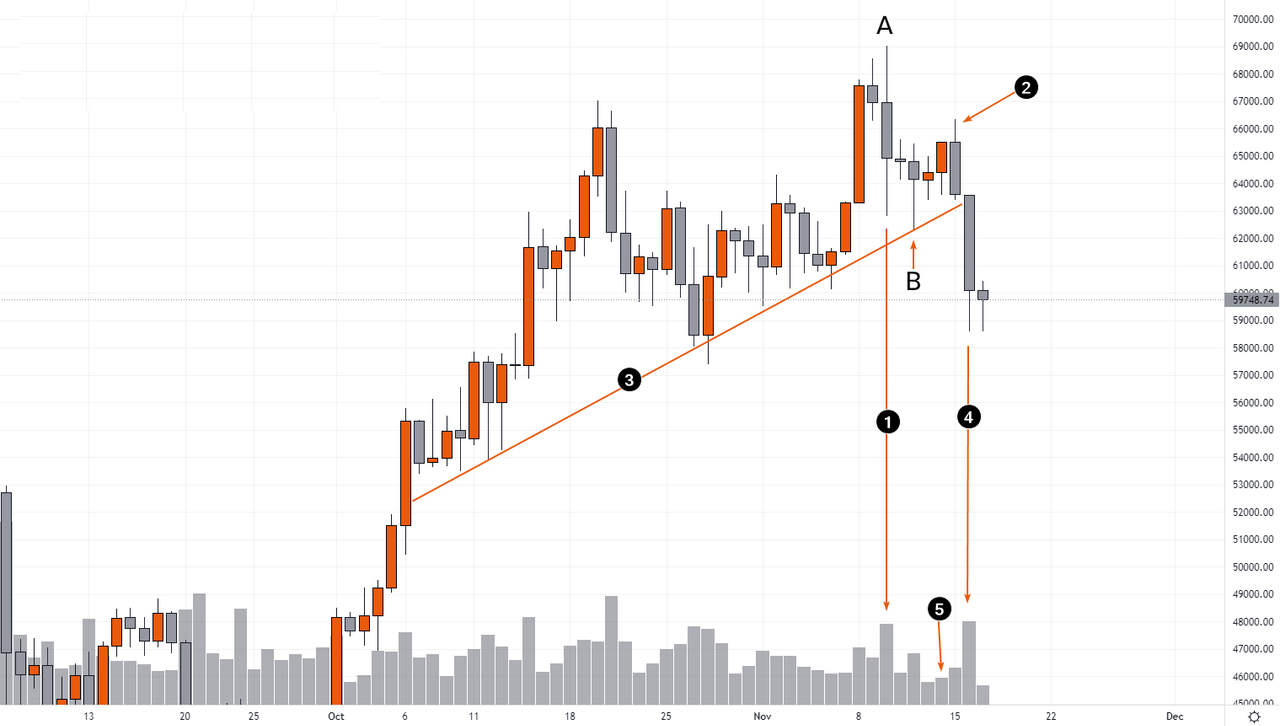
November 10 (1) saw high sales volumes. They held back the upside attempt on November 14-15 (2) and jeopardized the trendline (3), which has now been broken. Note that the November 15 high (2) is 50% of the AB decline, while the November 14 bullish candlestick has low volume (5), implying weak demand. All of this paints a bearish picture. We expect an attempt to test the breakdown of line (3).
https://i.postimg.cc/YqyF2y5X/bt1.png

FXOpen Telegram Channel

Re: Technical Analysis by FXOpen

Rivian Doubles in Price In Less Than One Week Since Its IPO
https://i.postimg.cc/KvYQXwgq/rivianx.jpg

Rivian (NASDAQ:RIVN) is an electric vehicle startup backed by Jeff Bezos, the CEO of Amazon. It listed its shares last week on NASDAQ at an IPO (initial public offering) price of $78. To the surprise of many market participants, the stock price has doubled in just one week since then, trading close to $170/share, resulting in a market capitalization larger than that of some well-established companies such as Volkswagen.

Investors still bet big on renewable energy solutions, as many governments in the developed world plan to phase out the combustion engine in the next decade or so. As such, electric vehicle companies have surged on the world's stock exchanges, even though they are not manufacturing that many vehicles.

Take Rivian — founded in 2009, it currently employs about 6,000 people. In the first trading week, the stock market performance propelled the company above Ford's market capitalization, despite Ford employing 178,000 people and delivering far more cars.

Other Electric Vehicle Makers Have Seen Stock Price Surge in 2021
https://i.postimg.cc/fWC5rDkS/12-1.jpg

Rivian's performance in the first trading week since it became a publicly listed company should not come as a surprise. While impressive, its stock price performance follows closely in the footsteps of other similar companies that have outperformed the market in 2021.

Lucid Group (NASDAQ:LCID) is one of them. It develops electric vehicle technologies such as full cars as well as battery systems. The stock price has gone up over +340% this year alone.

Tesla is another such company, only this time, it needs no introduction. Tesla is one of the world's biggest brands, and its charismatic CEO, Elon Musk, is constantly in the papers. Most recently, Musk held a Twitter poll asking if he should sell 10% of Tesla shares. Millions of voters urged him to do so — so he did. Yet, despite the massive selling, Tesla shares have rallied over +145% in the last twelve months, and more than +2,600% in the last five years. TSLA currently trades above $1,000 a share, as buyers emerged on every dip.

All in all, the electric vehicle industry is popular among investors as governments fight to tackle climate change. Sky-high valuations seem to not matter for retail investors who want to get exposure to the industry and are willing to pay multiple times their current earnings.

FXOpen Blog

Re: Technical Analysis by FXOpen

ETHUSD and LTCUSD Technical Analysis – 18th NOV, 2021
https://i.postimg.cc/66yMCZ6b/dcx.jpg

ETHUSD: Descending Triangle Pattern Below $4,300

Ethereum failed to continue its bullish momentum this week and after touching an intraday high of $4,765 on 16th Nov, started a steep decline towards the $4,300 handle.

We can see a descending triangle pattern below $4,300 which signifies that the downtrend is expected to continue as more and more traders are entering short positions in Ethereum in hopes of making profit from a falling market.

ETHUSD touched an intraday low of $4,118 in the European trading session today, after which the prices stabilized and continue to trade above the $4,200 level.

StochRSI is indicating OVERSOLD level, which means that the market is in a position to enter into a consolidation phase, and the prices will continue to move in a narrow range between $4,200 and $4,400.

ETH is now trading below its pivot level of $4,243 and moving in continuation of a bearish trend. The price of ETHUSD is now testing its classic support level of $4,197 and its Fibonacci support level of $4,213. After this, the path towards $4,000 will get cleared.

ETHUSD is facing heavy downwards pressure and has already broken its key support level of $4,240 today.

All the major technical indicators are giving a STRONG SELL signal.

ETH is now trading below both the 100 hourly and 200 hourly simple moving averages.

  • Ethereum is in continuation of a bearish channel

  • Short-term range appears to be bearish for ETHUSD

  • All the moving averages are giving a STRONG SELL signal

  • Williams percent range is indicating OVERSOLD markets

Ether Bearish Trend Continuation Below $4,300
https://i.postimg.cc/CMXm7Kzh/eth.png

ETHUSD has been moving in a steep downturn since yesterday, and this is a short-term bearish reversal of the market. The medium to long-term outlook for ETH remains bullish.

The present market condition offers short-term traders to enter into SELL positions, with the immediate targets of $4,100 and $4,000.

The price of ETHUSD will need to remain above the important psychological support level of $4,000 this week to mark the reversal of this bearish channel.

The average true range is indicating low market volatility as we can see a drop of 26% in the trading volume as compared to yesterday. This means that fresh buyers are not willing to enter the markets given the bearish nature of the trend.

ETH has gained +1.15% with a price change of +47.70$ in the past 24hrs and has a trading volume of 18.471 billion USD.

The Week Ahead

Ether is expected to continue this downtrend this week and touch the level of $4,100 or even break the $4,000 handle. Since the long-term bullish tone is still present, the dips below $4,000 will remain well supported and will continue to push the prices higher.

StochRSI is OVERSOLD which indicates that the prices are going to REVERSE very soon.

The current level is very attractive for entering into the markets with short-term position and the target of $4,000.

The price of ETHUSD has already broken its Camarilla support level of $4,234 and further downsides are expected below $4,200 in the coming days. Next week, we can expect a reversal of this bearish trend.

Technical Indicators:

Stoch (9,6): at 26.571 indicating a SELL

Relative strength index (14-day): at 43.318 indicating a SELL

Ultimate oscillator: at 39.654 indicating a SELL

Rate of price change: at -0.687 indicating a SELL

Read Full on FXOpen Company Blog...

Re: Technical Analysis by FXOpen

Gold Price and Crude Oil Price Could Start Fresh Increase
https://i.postimg.cc/6Qrq9t8d/gold.jpg

Gold price is trading in a positive zone above the $1,850 support. Crude oil price must clear $80.00 to start a fresh increase in the near term.

Important Takeaways for Gold and Oil

  • Gold price started a decent increase above the $1,850 resistance against the US Dollar.

  • There is a key contracting triangle forming with resistance near $1,865 on the hourly chart of gold.

  • Crude oil price corrected lower below $80.00 and tested the $76.50 zone.

  • There was a break above a key bearish trend line with resistance near $78.50 on the hourly chart of XTI/USD.

Gold Price Technical Analysis
https://i.postimg.cc/NMb0HD7F/Gold-Chartx.jpg

Gold price started a fresh increase above the $1,820 resistance level against the US Dollar. The price gained pace and it was able to settle above the $1,842 resistance zone.

The price even settled above the $1,850 level and the 50 hourly simple moving average. Finally, there was a break above the $1,870 level. A high was formed near $1,877 on FXOpen and the price corrected lower. There was a break below the $1,865 level, but the bulls remained active near $1,850.

A low is formed near $1,850 and the price is now rising. The price is back above the $1,860 level and the 50 hourly simple moving average. It also surpassed the 50% Fib retracement level of the recent decline from the $1,871 swing high to $1,850 low.

An immediate resistance on the upside is near the $1,863 level. It is near the 61.8% Fib retracement level of the recent decline from the $1,871 swing high to $1,850 low. The first major resistance is near the $1,865 level.

There is also a key contracting triangle forming with resistance near $1,865 on the hourly chart of gold. The main resistance is near the $1,870 level. A close above the $1,870 level could open the doors for a steady increase towards $1,885.

The next major resistance sits near the $1,900 level. On the downside, an initial support is near the $1,855 level. The first major support is near the $1,850 level. A downside break below the $1,850 support zone may possibly spark a steady decline. In the stated case, the price could test the $1,820 support.

Read Full on FXOpen Company Blog...

Re: Technical Analysis by FXOpen

GBP/USD and EUR/GBP At Risk of More Losses
https://i.postimg.cc/YC1sV8Pr/GBPUSD-British-Pound.jpg

GBP/USD is struggling to clear the 1.3500 resistance zone. EUR/GBP is declining and remains at a risk of more losses below the 0.8380 support.

Important Takeaways for GBP/USD and EUR/GBP

  • The British Pound is facing resistance near the 1.3500 and 1.3510 levels.

  • There was a break below a key bullish trend line with support near 1.3460 on the hourly chart of GBP/USD.

  • EUR/GBP started a fresh decline from well above the 0.8550 pivot level.

  • There is a major bearish trend line forming with resistance near 0.8420 on the hourly chart.

GBP/USD Technical Analysis

The British Pound found support near 1.3350 and started a decent recovery the US Dollar. The GBP/USD pair climbed higher above the 1.3400 and 1.3450 levels.

The pair even spiked above the 1.3500 level, but there was no upside continuation. A high is formed near 1.3512 on FXOpen and the pair is now declining. The pair traded below the 1.3480 and 1.3450 support levels to enter a bearish zone.

GBP/USD Hourly Chart
https://i.postimg.cc/DznMKLVq/GBPUSD-Chart-2x.jpg

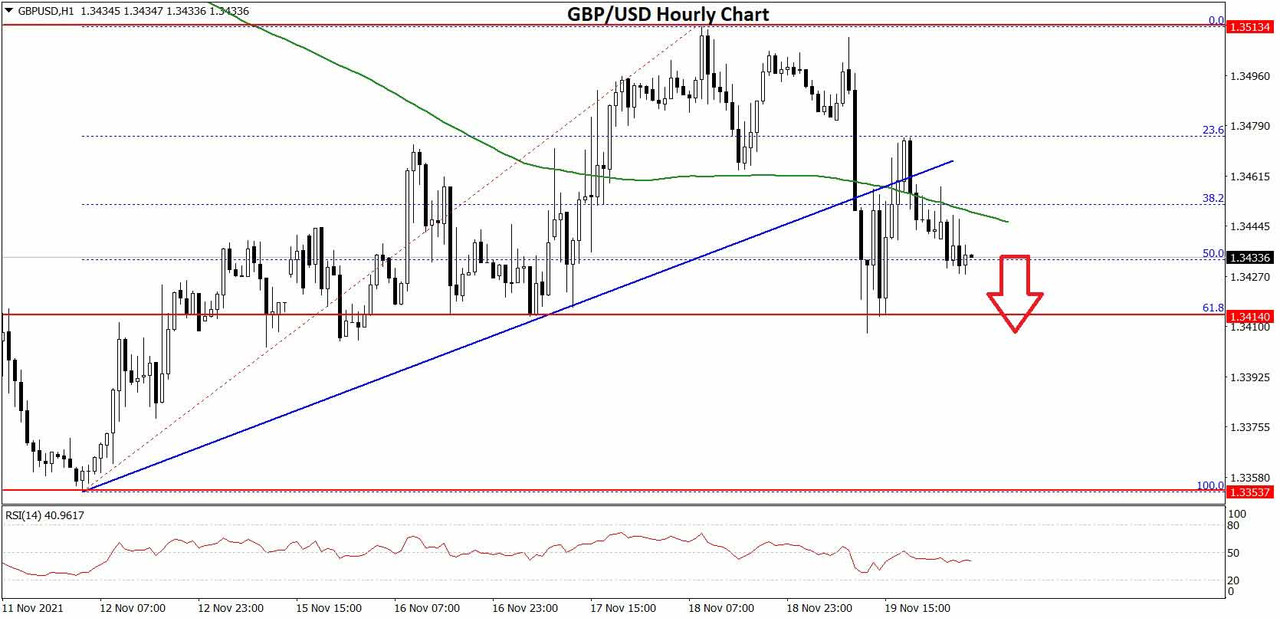
There was a break below a key bullish trend line with support near 1.3460 on the hourly chart of GBP/USD. The pair declined below the 50% Fib retracement level of the upward move from the 1.3353 swing low to 1.3512 high.

The pair is now trading below the 1.3450 and the 50 hourly simple moving average. On the upside, an initial resistance is near the 1.3450 level.

If there is an upside break above the 1.3450 resistance and the 50 hourly SMA, the price could surpass 1.3480. The main resistance is near the 1.3500 zone. Therefore, a proper break above the 1.3500 resistance could open the doors for a steady increase. The next major resistance for the bulls could be 1.3600.

If not, the pair could extend losses below 1.3425. An immediate support is near the 1.3415 level. It is near the 61.8% Fib retracement level of the upward move from the 1.3353 swing low to 1.3512 high.

The first key support is near the 1.3400 level. Any more losses could lead the pair towards the 1.3350 support zone. The next major support sits near the 1.3250 level.

Read Full on FXOpen Company Blog...

Re: Technical Analysis by FXOpen

Euro Under Pressure as COVID Cases Mount

https://i.postimg.cc/3RLpjHwq/dcx.jpg

Winter has arrived in Europe and, with it, a new wave of COVID-19 infections. Despite Europe doing a relatively good job at vaccinating the population, the current vaccination rate is not substantial enough to curb the infection in some countries.

COVID-19 infections are mounting once again, thus putting pressure on economies. Austria, for example, announced a new three-week lockdown in a desperate attempt to stop the virus and also to save the ski season (that has just started), as the tourism industry contributes in no small measure to the Austrian GDP.

Moreover, the country announced that vaccination will become compulsory starting from February next year. The development has triggered a decline in euro pairs, with the EURUSD exchange rate trading below 1.13, and the EURJPY below 129.

Fed Turns Hawkish

https://i.postimg.cc/0jbScHMy/fed.jpg

The Federal Reserve of the United States announced the tapering of its quantitative easing and a gradual phase-out of the bond-buying program. However, last week, some Fed members argued for a faster reduction to tapering and signaled at least one rate hike to come in 2022. As such, the divergence with other central banks will support the dollar in the period ahead.

On the other hand, the European Central Bank clearly has no intentions of hiking the interest rate next year. As such, from a monetary policy perspective, the euro has no reason to rise anytime soon.

All euro pairs have come under pressure, not only the EURUSD. The EURJPY, for instance, traded with a bid tone all year but failed at the 133 level. In a matter of just a few days, it declined below 129 despite the USDJPY holding above 114.

EURGBP is another pair reflecting the euro’s weakness. In addition, the Bank of England has voiced some concerns about the rising inflation rate, which could mean it following in the Fed’s footsteps sooner rather than later. Therefore, further declines in the cross pair should be expected.

All in all, the euro looks weak here ahead of Thanksgiving and at the start of the winter season. As COVID-19 puts pressure on the European economies again, traders have no incentives to buy the common currency.

FXOpen Blog

Re: Technical Analysis by FXOpen

EUR/USD Extends Decline, USD/CHF Gains Momentum
https://i.postimg.cc/fWHMLt0Z/Euro.jpg

EUR/USD started a fresh decline from well above the 1.1350 pivot zone. USD/CHF is rising, and it might extend gains above the 0.9350 level.

Important Takeaways for EUR/USD and USD/CHF

  • The Euro failed to gain strength and declined below 1.1300 against the US Dollar.

  • There is a key bearish trend line forming with resistance near 1.1255 on the hourly chart of EUR/USD.

  • USD/CHF started a decent increase from the 0.9250 support zone.

  • There is a connecting bullish trend line forming with support near 0.9310 on the hourly chart.

EUR/USD Technical Analysis

The Euro attempted an upside break above the 1.1400 resistance zone against the US Dollar. The EUR/USD pair failed to gain strength and started a fresh decline.

There was a clear break below the 1.1350 and 1.1300 support levels. The pair even broke the 1.1250 support and the 50 hourly simple moving average. Finally, there was a move below the 1.1230 level and a low is formed near 1.1226 on FXOpen.

EUR/USD Hourly Chart
https://i.postimg.cc/c4r08xQ3/EURUSD-Chart-2x.jpg

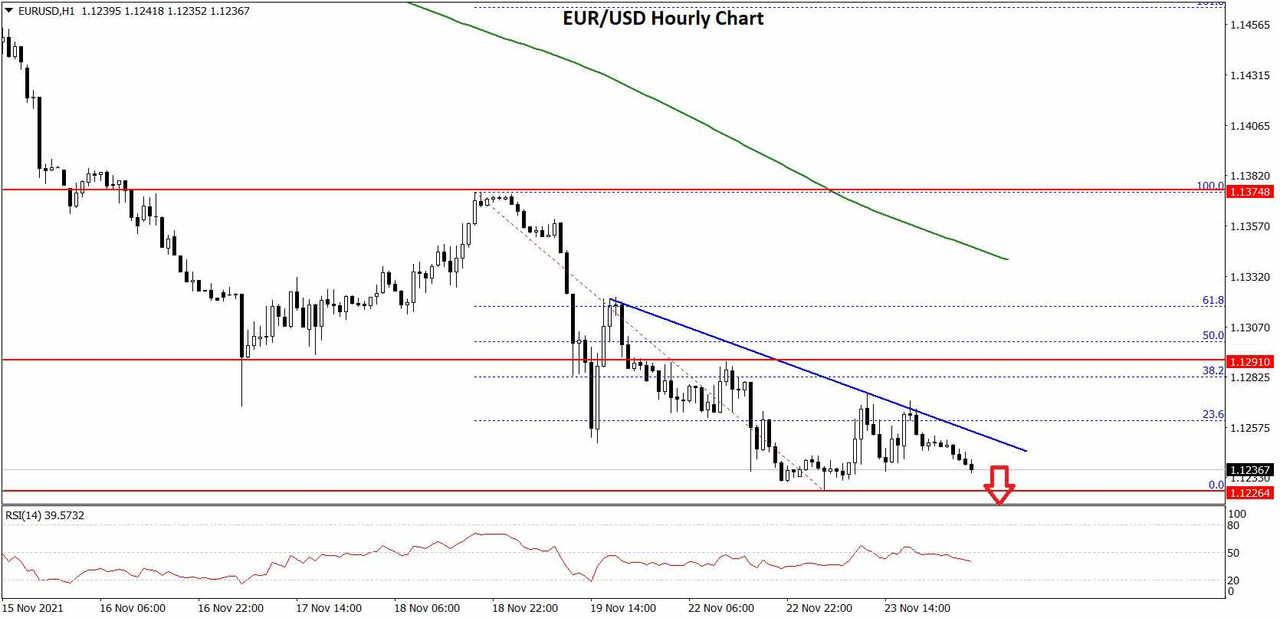
The pair is now consolidating losses near the 1.1230 level. On the upside, an initial resistance is near the 1.1255 level. The 23.6% Fib retracement level of the recent decline from the 1.1373 swing high to 1.1226 low is also near 1.1255.

There is also a key bearish trend line forming with resistance near 1.1255 on the hourly chart of EUR/USD. The next major resistance is near the 1.1300 zone.

The 50% Fib retracement level of the recent decline from the 1.1373 swing high to 1.1226 low is also near the 1.1300 zone. A clear upside break above the 1.1300 zone could open the doors for a steady move.

The next major resistance sits near the 1.1350 level. On the downside, an immediate support is near the 1.1225 level. The next major support is near the 1.1200 level.

A downside break below the 1.1200 support could start another decline. The next major support sits near 1.1120.

Read Full on FXOpen Company Blog...

Re: Technical Analysis by FXOpen

BTCUSD and XRPUSD Technical Analysis – 23rd NOV, 2021
https://i.postimg.cc/v8vwhskP/dcx.jpg

BTCUSD: Head and Shoulders Pattern Below $60,000

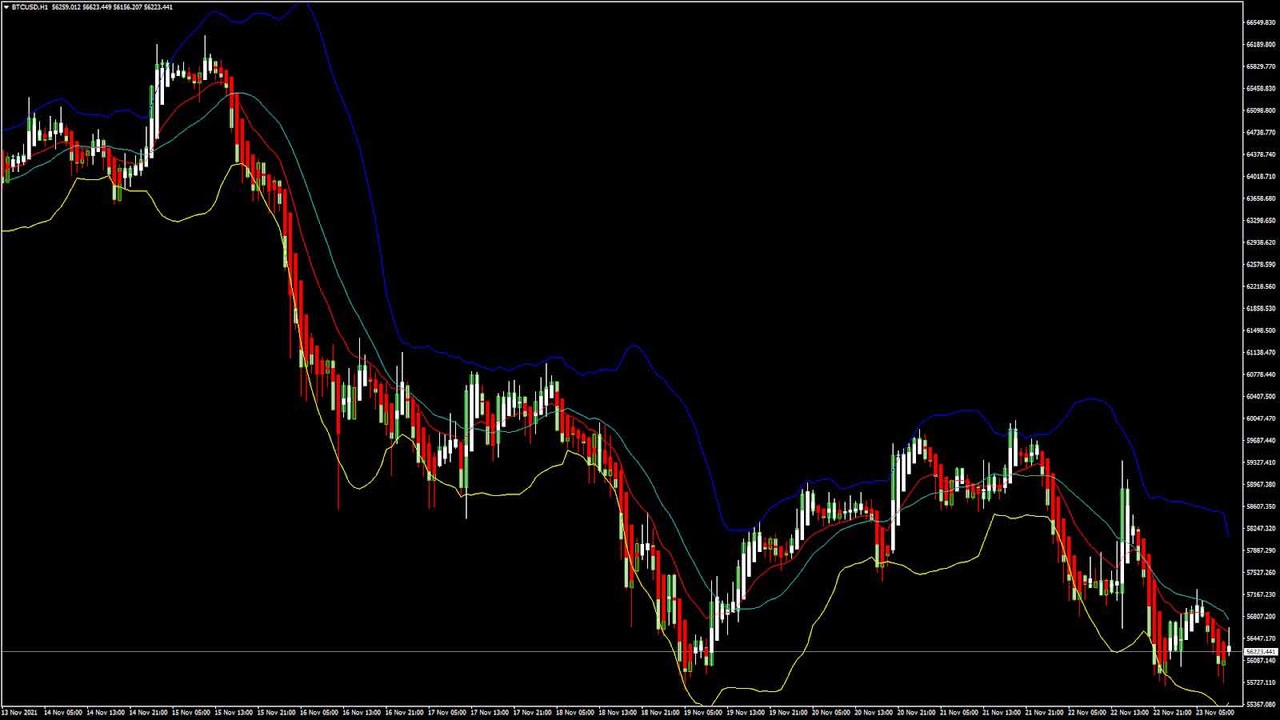
Bitcoin is moving in continuation of a strong bearish trend this week, and any attempts towards a bullish reversal failed. This is the reason we see BTCUSD trading below the $60,000 handle in the European trading session today.

We can clearly see a head-and-shoulders pattern below the $60,000 level which signifies that we are in a confirmed downtrend.

Yesterday, we saw yesterday BTCUSD touching an intraday high of $59,965 after which the prices started to decline and touched an intraday low of $55,676, with today’s intraday low of $55,864.

We can see a continuous downwards selling pressure in bitcoin today, and more losses are expected in the coming days.

The immediate short-term outlook for bitcoin turned bearish, and now we are looking at levels of $55,000 and $52,000.

Williams percent range is overbought which signifies that more selling is expected today in the US trading session which will push the prices of BTCUSD below the $55,000 handle.

Bitcoin is now moving below both the 100 hourly simple and exponential moving averages.

The average true range is indicating less market volatility which means that markets are due to enter a consolidation phase soon.

  • Bitcoin’s downtrend continues aiming for downsides below $55,000

  • Stoch is indicating OVERBOUGHT levels
  • The price is now trading just below its pivot level of $56,080

  • All moving averages are giving a STRONG SELL signal at current market levels of $56,278
Bitcoin: Strong Bearish Trend Towards $55,000
https://i.postimg.cc/brLXwx1X/btcx.jpg

BTCUSD has already broken its support level of $56,500 and is now about to break its important psychological support level of $55,000.

The price of BTCUSD is trading above its classic support level of $55,242 and Fibonacci support level of $55,874 in the European trading session.

In the last 24hrs, BTCUSD has gone DOWN by -2.21% with a price change of -1271$ and has a 24hr trading volume of USD 35.677 billion.

Bitcoin Bonds

El Salvador has become the first country to issue a $1 billion bitcoin bond with a 10-year maturity on the Liquid Network.

The new bitcoin-linked bond appears to be the highest-yielding fixed income instrument globally. This bond will yield a 6.5% rate of annual interest payments to its investors.

The credit rating for this bitcoin bond is negative due to the distressed-debt situation of El Salvador.

El Salvador adopted bitcoin as legal tender in  June 2021, after which Moody's Investors Service downgraded the long-term foreign-currency issuer and senior unsecured ratings to Caa1 from B3.

The Week Ahead

The downward selling pressure seen in Bitcoin is expected to push its prices to the $52,000 range, after which a fresh wave of consolidation and an uptrend move is expected.

The bearish trend formation continues and is expected to push the prices below the level of $54,000 this week. After touching a low of $52,000, a potential bullish trend reversal is expected for which we will have to wait until next week.

The prices will need to remain above the important support level of $52,682 for a bullish reversal of the markets.

Technical Indicators:

Relative strength index (14-day): at 35.28 indicating a SELL

Average directional change (14-day): at 40.639 indicating a SELL

Moving averages convergence divergence (12,26): at -442.90 indicating a SELL

Ultimate oscillator: at 40.127 indicating a SELL

Read Full on FXOpen Company Blog...

Re: Technical Analysis by FXOpen

ETHUSD and LTCUSD Technical Analysis – 25th NOV, 2021
https://i.postimg.cc/zBCx1zSQ/pbx.jpg

ETHUSD: Double Bottom Pattern Above $4,000

On Nov 23rd, Ethereum touched a low of $4,030, after which the prices stabilized and, as of yesterday, entered into a consolidation phase.

In today’s Asian trading session, ETHUSD touched an intraday high of $4,334.

We can see a double bottom pattern above $4,000 which signifies a bullish reversal, end of a downtrend and a shift towards an uptrend.

In today’s European trading session, the price of Ethereum continues to rise slowly and is aiming for upsides of $4,400 and $4,500.

The fall in the levels of ETH seen last week occurred due to profit-taking; the bullish tone is back in the markets. The pair is gaining a bullish momentum and is also poised for a rally upwards of $4,500 that can happen any time now.
ETH is trading above its pivot level of $4,276 and moving in a bullish trend. The price of ETHUSD has already broken its classic resistance level of $4,298 and its Fibonacci resistance level of $4,290. In the US trading session, it is aiming towards the $4,400 handle.

All the major technical indicators are giving a STRONG BUY signal.

ETH is now trading above both the 100 hourly and 200 hourly simple moving averages.

  • Ethereum is in continuation of bullish channel

  • Short-term range appears to be bullish for ETHUSD

  • All the moving averages are giving a STRONG BUY signal

  • Average true range is indicating LESS market volatility

Ether: Bullish Trend Towards $4,500 Confirmed
https://i.postimg.cc/wv8wPyJJ/ethx.jpg

ETHUSD was moving in a consolidation channel in the early Asian trading session today after which a bullish momentum started pushing the price above the $4,300 handle.

We can see that last week’s heavy-selling pressure has exhausted, and now buyers are returning to the markets.

The relative strength index is NEUTRAL which signifies a potential trend reversal today.

It is best to enter into long positions in Ethereum at the present market level of $4,300 with targets of $5,000 the next month.

The average true range is indicating low market volatility as we can see a 12% drop in the trading volume as compared to yesterday. This is because the market was in a consolidation phase and the buyers were waiting for a bullish pattern which is clearly visible now.

ETH has gained +0.63% with a price change of +26.94$ in the past 24hrs and has a trading volume of 18.729 billion USD.

The Week Ahead

Ether is printing above $4,300 today, and we could see $4,500 this week.

The medium-to-long term outlook for Ether remains bullish, targeting $5,000 and above in the next month.

We can already see an increase in Ethereum’s market capitalization which currently stands at $510 billion.

The price of ETHUSD has already broken its key resistance level of $4,270 and is about to break its next resistance level of $4,335.

We could see Ether printing at above $4,500 next week and aim upsides towards the $5,000 handle.

At present, the market is offering a good buying opportunity for long-term traders who can hold till it reaches $10,000 in 2022.

Technical Indicators:

The commodity channel index (14-day): at 56.55 indicating a BUY

Moving averages convergence divergence (14-day): at 11.85 indicating a BUY

StochRSI (14-day): at 69.83 indicating a BUY

Rate of price change: at 2.121 indicating a BUY

Read Full on FXOpen Company Blog...

Re: Technical Analysis by FXOpen

AUD/USD and NZD/USD Turn Red, Risk of More Losses
https://i.postimg.cc/fTtBk17D/AUD-2.jpg

AUD/USD started a fresh decline from well above 0.7250. NZD/USD is also declining, and it might accelerate lower below the 0.6800 level.

Important Takeaways for AUD/USD and NZD/USD

  • The Aussie Dollar started a major decline from the 0.7300 resistance against the US Dollar.

  • There was a break below a connecting support trend line at 0.7170 on the hourly chart of AUD/USD.

  • NZD/USD also started a major decline from well above the 0.7000 level.

  • There is a key bearish trend line forming with resistance near 0.6855 on the hourly chart of NZD/USD.

AUD/USD Technical Analysis

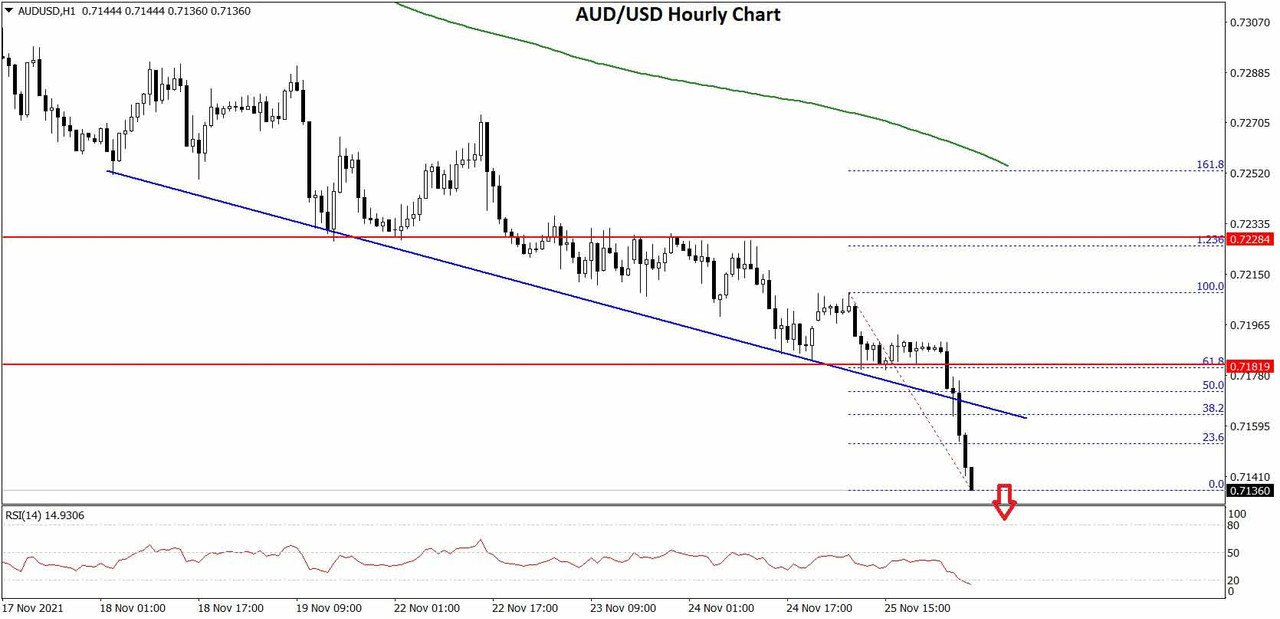
The Aussie Dollar started a major decline after it failed to clear 0.7300 against the US Dollar. The AUD/USD pair traded below the 0.7250 and 0.7200 support levels to move into a bearish zone.
The pair even broke the 0.7150 support and the 50 hourly simple moving average. Besides, there was a break below a connecting support trend line at 0.7170 on the hourly chart of AUD/USD. The pair is now accelerating lower below the 0.7150 level.
AUD/USD Hourly Chart
https://i.postimg.cc/K8tfDLsW/AUDUSD-Chart-1x.jpg

An initial support on the downside is near the 0.7120 level. The next major support is near the 0.7100 level. If there is a downside break below the 0.7100 support, the pair could extend its decline towards the 0.7050 level.

On the upside, an immediate resistance is near the 0.7150 level. It is near the 23.6% Fib retracement level of the recent decline from the 0.7208 swing high (formed on FXOpen) to 0.7136 low.

The next major resistance is near the 0.7175 level. It is near the 50% Fib retracement level of the recent decline from the 0.7208 swing high to 0.7136 low. A close above the 0.7175 level could start a steady increase in the near term. The next major resistance could be 0.7250.

Read Full on FXOpen Company Blog...

Re: Technical Analysis by FXOpen

GBP/USD Faces Hurdle, USD/CAD Remains In Uptrend
https://i.postimg.cc/Pq9223ST/GBPUSD-Cable-Sterling.jpg

GBP/USD is attempting a recovery wave from the 1.3280 zone. USD/CAD is rising and is showing positive signs above the 1.2700 support.

Important Takeaways for GBP/USD and USD/CAD

  • The British Pound found support near 1.3280 and started an upside correction.

  • There was a break above a key bearish trend line with resistance near 1.3330 on the hourly chart of GBP/USD.

  • USD/CAD started a major increase above the 1.2650 and 1.2700 resistance levels.

  • There is a crucial rising channel forming with support near 1.2685 on the hourly chart.

GBP/USD Technical Analysis

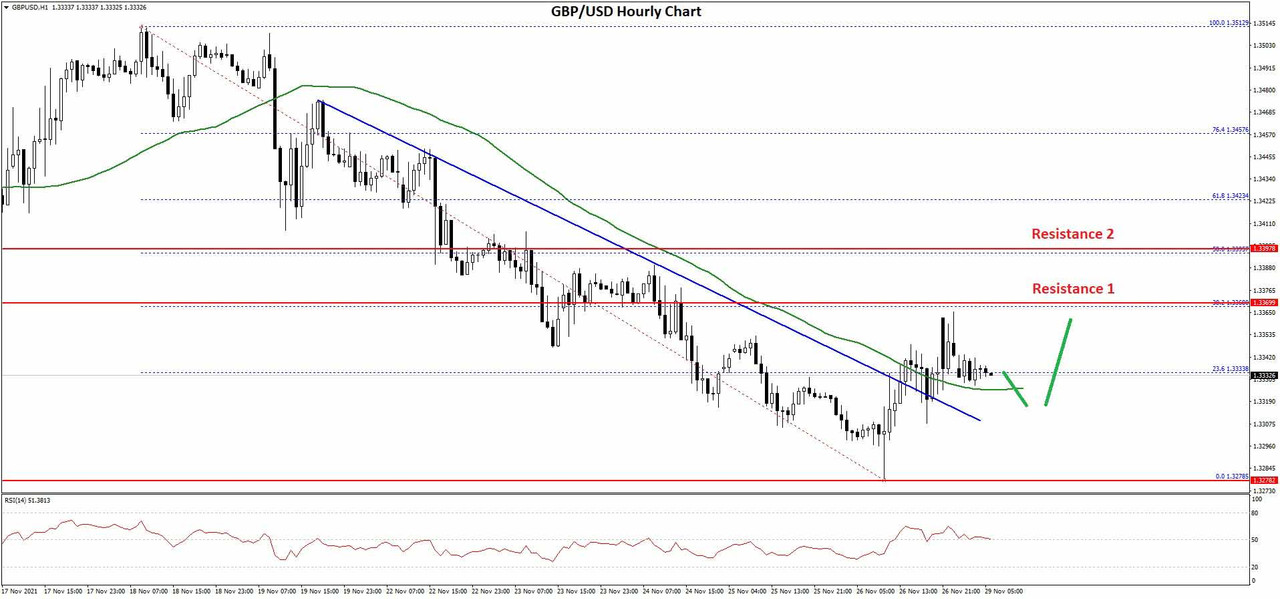
After a major decline, the British Pound found support above 1.3250 against the US Dollar. GBP/USD traded as low as 1.3278 on FXOpen and recently started an upside correction.

The pair broke the 1.3320 resistance to move into a short-term positive zone. There was a break above the 23.6% Fib retracement level of the downward move from the 1.3512 swing high to 1.3278 low. Besides, there a break above a key bearish trend line with resistance near 1.3330 on the hourly chart of GBP/USD.

GBP/USD Hourly Chart
https://i.postimg.cc/WzPSPDRy/GBPUSD-Chart-3x.jpg

It is now trading above the 1.3330 level and the 50 hourly simple moving average. An immediate resistance is near the 1.3370 level.

The first major resistance is near the 1.3400 level. It is near the 50% Fib retracement level of the downward move from the 1.3512 swing high to 1.3278 low. If there is an upside break above the 1.3400 zone, the pair could rise towards 1.3500.

The next key resistance could be 1.3550, above which the pair could gain strength. On the downside, the first key support is near the 1.3320 area.

If there is a break below 1.3320, the pair could decline extend its decline. The next key support is near the 1.3280 level. Any more losses might call for a test of the 1.3200 support.

Read Full on FXOpen Company Blog...

Posts: 451 to 475 of 1,778

Pages Previous 1 17 18 19 20 21 72 Next

You must login or register to post a reply

Forex Software → Market Analysis → Technical Analysis by FXOpen

Similar topics in this forum