Topic: Balance Line Deviation incorrect?

Hi Dr. Popov,

please see the attached screenshot... How can such a straight equity curve have a balance line deviation of 40%? This seems impossible and can only be the case if this is being calculated based on the 100.000 initial deposit, in which case this metric would be rather useless. Can you adjust the "balance line deviation" to work on the actual net profit curve instead of a % figure of the inital deposit? This would make a lot more sense, since for example this equity curve is almost perfect, but would be filtered out by EA Studio because it has a deviation higher than 40% (which is right in terms of initial deposit, but makes few sense to calculate it like that, don´t you think?).

Thank you :-)

https://s14.postimg.org/dze8ym3dd/bal-line.jpg

Post's attachments

bal-line.jpg 519.87 kb, file has never been downloaded. 

You don't have the permssions to download the attachments of this post.

2 (edited by geektrader 2018-03-21 01:36:31)

Re: Balance Line Deviation incorrect?

I just checked this in-depth, and indeed, the balance line deviation is calculated based on the initial deposit, which makes it prefer strategies with less profit out of the box (because their balance line deviation will always be lower than strategies with big profits). This makes this metric rather useless, as it will always prefer lower profit strategies with higher deviations on the actual net profit curve, and punish strategies with big profits and a very smooth equity curve).

Because of this, how about replacing it with a correlation coefficient of only the equity curve instead? Then it would just measure the slope (and it´s deviations from an ideal line, but only based on the equity curve, not initial balance related!) of the actual trading systems equity curve and would not tend to prefer low-profit strategies and punish the ones with high profits like in my picture above (although that equity line is superb).

3 (edited by geektrader 2018-03-21 01:53:32)

Re: Balance Line Deviation incorrect?

Here are 2 examples of why exactly the "balance line deviation" is not good the way it is calculated right now.

See this strategy. According to EA Studio, this has a balance line deviation of only 0.97%, but the equity curve looks terrible as you surely agree:


https://s14.postimg.org/5c5myf78h/bal-line-ex01.jpg


Now look at this strategy, the equity curve (while not perfect), obviously looks much better than the one of the first strategy, yet the balance line deviation that EA Studio calculated is much higher than for strategy one (which clearly has the worse equity curve of these two):

https://s14.postimg.org/o4hi2167l/bal-line-ex02.jpg

What this means is that EA Studio would prefer the equity curve strategy #1 over the equity curve of strategy #2, which makes no sense at all, as you might agree. The balance line deviation should be replaced by a meaningful value like correlation coefficient, solely based on the equity curve slope. Only then EA Studio would start to prefer strategy #2. Right now, balance line deviation is a useless and misleading metric as you can see in the examples above, unfortunately.

Re: Balance Line Deviation incorrect?

The stats are calculated correctly, however they may not work as you expect.

See this strategy. According to EA Studio, this has a balance line deviation of only 0.97%, but the equity curve looks terrible as you surely agree:

This doesn't change the fact that the actual deviation is exactly 0.97 %

The deviation % is calculated according to the current value.

Se more details here: https://forexsb.com/wiki/eas-guide/acce … _deviation

You should not relay on a single stats value when evaluate your strategies.

Re: Balance Line Deviation incorrect?

What this means is that EA Studio would prefer the equity curve strategy #1 over the equity curve of strategy #2,

EA Studio is simply a computer application. It has no preferences. Probably it is only a subject of the Principle of Increase of Entropy.

6 (edited by geektrader 2018-03-21 08:22:07)

Re: Balance Line Deviation incorrect?

Thanks for your reply. I am using several measures, no worries (been trading full time since 2011 and own all the major strategy building systems out there). What I wanted to say is this: can you please add a new metric which just measures the correlation coefficient of the actual net profit curve (100% = straight line between start and end of net profit curve)? I am close to purchasing EA Studio (really, really impressed), but not having a proper stability measure as per my definition, is a no-go for me (and balance line deviation doesn´t do what I need). So, if you possibly could add the net profit curve stability as a new metric, that would be great! You can have a look at StrategyQuant / Adaptrade Builder how to calculate it, but basically it is not complicated, I have even implemented it in my MQ4 EAs. Here is the code, then you surely understand what I mean and can adapt it to EA Studio:

double EquityCurveStdDev()
{
    double OrderHistoryArray[];
    double VirtualHistoryArray[];
    double DifferencesArray[];
    double TotalProfitCounted;
    double Result;
    int    cnt2;

    TradesTotal = 0;
    NetProfit   = 0;

    for (int cnt3 = OrdersHistoryTotal() - 1; cnt3 >= 0; cnt3--)
    {
        if (OrderSelect(cnt3, SELECT_BY_POS, MODE_HISTORY) && (OrderType() == OP_BUY || OrderType() == OP_SELL) && (StrategySelectorForStdDev == 0 || OrderMagicNumber() == BaseMagicNumber + StrategySelectorForStdDev))
        {
            TradesTotal++;
            NetProfit = NetProfit + OrderProfit() + OrderCommission() + OrderSwap();
        }
    }


    ArrayResize(OrderHistoryArray, TradesTotal);
    ArrayResize(VirtualHistoryArray, TradesTotal);
    ArrayResize(DifferencesArray, TradesTotal);

    for (int cnt = OrdersHistoryTotal() - 1; cnt >= 0; cnt--)
    {
        cnt2++;
        if (OrderSelect(cnt, SELECT_BY_POS, MODE_HISTORY) && (OrderType() == OP_BUY || OrderType() == OP_SELL) && (StrategySelectorForStdDev == 0 || OrderMagicNumber() == BaseMagicNumber + StrategySelectorForStdDev))
        {
            TotalProfitCounted = TotalProfitCounted + OrderProfit() + OrderCommission() + OrderSwap();

            OrderHistoryArray[cnt]   = TotalProfitCounted;
            VirtualHistoryArray[cnt] = (NetProfit / TradesTotal) * cnt2;
            DifferencesArray[cnt]    = VirtualHistoryArray[cnt] - OrderHistoryArray[cnt];
        }
    }

    Result = MathStdev(DifferencesArray);
    if (Result != 0)
        return(Result);

    return(0.000001);
}


double MathStdev(double &array[])
{
    int    size = ArraySize(array);
    double sum,
           stdev,
           mean = MathAvg(array);
    for (int i = 0; i < size; i++)
        sum += MathPow((array[i] - mean), 2);
    stdev = MathSqrt(sum / (size - 1));
    return(stdev);
}


double MathAvg(double &array[])
{
    int    size = ArraySize(array);
    double sum,
           mean;
    for (int i = 0; i < size; i++)
        sum += array[i];
    mean = sum / size;
    return(mean);
}

7 (edited by geektrader 2018-03-22 04:07:46)

Re: Balance Line Deviation incorrect?

Just that you understand what exactly the above code does:

It creates 2 arrays, one representing the real trades (the real net profit curve), trade by trade, and a second "ideal line" array, also trade by trade, where it simply takes the total net profit of the strategy, divided by the total amount of trades, creating the "ideal version" of the underlying strategies net profit curve. In the end, both arrays are being compared by standard deviation and the closer the net profit curve of the real trades is to the idealized profit curve (straight line), the lower the resulting total deviations will be (which are calculated at the end of the code, once it processed all trades). Hope you can add that to EA Studio soon too, really would love to buy it once it has such a feature.

Thanks.

Re: Balance Line Deviation incorrect?

Thank you for the code!

I'll see if it can be applied in EA Studio. I'm adding it in my ToDo.

9 (edited by geektrader 2018-03-22 09:20:33)

Re: Balance Line Deviation incorrect?

That would be "super-duper" :-) Do you know how it is supposed to work logically? If not, just let me know, I will try to explain it better - my English is not perfect and sometimes I cannot exactly express what I have in my head in words, LOL ;-)

Ideally though, the above function should output a % value rather than a $ amount for the deviation. % would make a lot more sense as it would make things easier to compare. Basically all that needs to be done is to take the systems trade curve and compare the deviations along the net profit line (points on that line = the amount of trades the system made, or possibly a fixed amount like 100 to 200 etc.) with the idealized straight line (which would equal 100% "stability"). So for example, a value of "98% stability", would mean that the net profit curve of the system is very close to a straight line.

Actually it´s not much different from the "balance line deviation", just that we do not take into account the actual initial balance as the reference, which stops favoring systems with low profit and a bad curve against systems that make a lot of profit but with a good curve (like in my example in the pictures that I had posted above).

Thank you smile

Re: Balance Line Deviation incorrect?

Thank you. The code is clear enough.

It can be optimized.

Instead of keeping three arrays it can use only one.

            TotalProfitCounted = TotalProfitCounted + OrderProfit() + OrderCommission() + OrderSwap();
            const double referenceProfit = (NetProfit / TradesTotal) * cnt2;
            DifferencesArray[cnt] = referenceProfit - TotalProfitCounted;

Re: Balance Line Deviation incorrect?

Thanks, but if using just one array, how do you keep track of the various points of the "virtual order array" (idealized equity curve) that later on make the deviation points that compared to the real equity curve? If you use summarize it like that, you are not really counting all the little deviations at the several points (each trade) of the equity curve and it would not serve the intended purpose anymore then.

Right now, each time a trade is closed, the net profit at that time is saved in an array. The "virtual array" saves an additional point at exactly the same point, just with the "idealized trade size" ((NetProfit / TradesTotal) * cnt2), hence creating a completely straight equity curve, but exactly at the time the real trades / equity curve occured. In the end, the array that holds all the differences, gets checked for the total deviation of all these points in the real equity curve and the virtual (idealized) equity curve. I don´t think you can achieve that with just one array.

Or am I missing something?

Re: Balance Line Deviation incorrect?

Right now, each time a trade is closed, the net profit at that time is saved in an array.

I'm looking at it from the backtesting angle. I need to calculate that stats param only once for the complete backtest.

Anyway, the formula above initializes and re-fills the arrays and every call, so the optimization you mean doesn't work. However, you are right. It is not my job to comment other's code.

Re: Balance Line Deviation incorrect?

Oh no no, it´s good if you comment my code, I always look for input as well my friend, no worries, please keep it coming :-) If you found another way to do it with the same results, that is great! Thanks a lot.

14 (edited by geektrader 2018-03-22 19:32:32)

Re: Balance Line Deviation incorrect?

Here is one more example why "balance line deviation" does not "help" me right now, see these both strategies (ignore the one in the middle):

https://s18.postimg.org/6siassvw9/exmple.jpg

You see that the first one has a much higher deviation from it´s ideal equity curve line than the last one, yet EA Studio calculates a "balance line deviation" of about 8% for both(!) (which, per your definition, is not wrong of course, because the first one has a lower total profit combined with the initial deposit of 100000 and hence the balance line deviation comes out at about the same for both). However, with my formula (which is just looking at the actual net profit curve (without taking the deposit into account), the last one would have a lot(!) lower % deviation than the first one - and that´s the metric that I´d need (and I guess that is what most people need too) to filter out strategies like the first one from the portfolio. It´s impossible with "balance line deviation" as both strategies have the same % deviation by it´s calculations.

It would also be ideal, if you´d implement the new "Stability" (or however you will be calling it) feature as "% deviation from ideal equity line" instead of a $ amount (like my formula does it). This way it will be independent from different lot-sizes.

Re: Balance Line Deviation incorrect?

Hello it will be available soon, only on ea-studio enterprise*.

I'm big fan of this metric also. A long time ago I've requested it too (check it out to understand the enterprise joke)

Who uses it knows the powers it will bring to your strategy toolbox, you can set to the program "find strategy with slope > 0.9" and it will find strategy with very good slope. It would be great to have on ea-studio.

An official mt5 article about it: R-SQUARED AS AN ESTIMATION OF QUALITY OF THE STRATEGY BALANCE CURVE

Suggest readings for everyone who uses mt5 tester and want a very good custom metric.


geektrader keep it going! great contributions man, let's make this software great.

16 (edited by geektrader 2018-03-22 19:51:08)

Re: Balance Line Deviation incorrect?

ViniQ: ah, THAT was the word I was looking for "Slope" and "R-Squared" (that´s how it is called sometimes). Yes, the article you´ve linked is exactly what I am looking for, thanks a lot for the contribution too, now Mr. Popov can easily add it for sure :-)

Mr. Popov: https://www.mql5.com/en/articles/2358 *that* is exactly what I would like to see in EA Studio, couldn´t have explained it better, haha ;-)

Re: Balance Line Deviation incorrect?

@Mr. Popov once again: I see that under https://forexsb.com/forum/post/41852/#p41852 you´ve said that it "is the same as the balance line deviation", but it really is not, because your implementation takes into account the initial deposit too, which gives flawed results, basically all you´d need to do to "correct" this, is to not use the initial balance, but ONLY the actual profits of the trading system itself. Then "balance line deviation" would equal "R-Squared" and it would really just focus on the equity curve, not relating to the initial balance / deposit. If I find the time, I will show you how to calculate it the way it´s meant to be by adjusting the formula in FSB Pro (accounstatistics.cs). Thank you smile

18 (edited by geektrader 2018-03-22 22:03:37)

Re: Balance Line Deviation incorrect?

On a quick look I think the only thing that needs a change in FSB Pro to achieve what we are looking for is this:

       private double CalculateMaxSmoothBalanceDeviationPercent(IBacktester backtester)
        {
            var firstBar = backtester.Strategy.FirstBar;
            var bars = backtester.DataSet.Bars;
            const int checkPoints = 100;
            var netBalance = NetMoneyBalance;
            double startBalance = backtester.Profile.InitialAccount;
            double maxDeviationPercent = 0;

            for (var i = 1; i <= checkPoints; i++)
            {
                var bar = (int)(firstBar + i * ((bars - firstBar) / (checkPoints + 1.0)));
                var checkPointBalance = backtester.MoneyBalance(bar);
                var targetBalance = startBalance + i * (netBalance - startBalance) / (checkPoints + 1.0);
                var deviationPercent = Math.Abs((targetBalance - checkPointBalance) / targetBalance);
                if (maxDeviationPercent < deviationPercent)
                    maxDeviationPercent = deviationPercent;
            }

            return maxDeviationPercent;
        }
    }
}

Changed to:


       private double CalculateMaxSmoothBalanceDeviationPercent(IBacktester backtester)
        {
            var firstBar = backtester.Strategy.FirstBar;
            var bars = backtester.DataSet.Bars;
            const int checkPoints = 100;
            var netBalance = NetMoneyBalance;
            double startBalance = 0;
            double maxDeviationPercent = 0;

            for (var i = 1; i <= checkPoints; i++)
            {
                var bar = (int)(firstBar + i * ((bars - firstBar) / (checkPoints + 1.0)));
                var checkPointBalance = backtester.MoneyBalance(bar);
                var targetBalance = startBalance + i * (netBalance - startBalance) / (checkPoints + 1.0);
                var deviationPercent = Math.Abs((targetBalance - checkPointBalance) / targetBalance);
                if (maxDeviationPercent < deviationPercent)
                    maxDeviationPercent = deviationPercent;
            }

            return maxDeviationPercent;
        }
    }
}

That should already to the trick, as we then only count the net profit of the trading system, without the initial balance which "messes things up". I will check this in-depth tonight once again, but I think that should be it, and hence should be easily adapted to EA Studio too? As a little trick: you could change the "checkpoints" amount to the amount of actual trades of the system, so that it would adapt a bit "finer" to system with many trades and would measure the curve at a few more points.

Thank you :-)

Re: Balance Line Deviation incorrect?

I may use formula similar to the one I use for the Correlation analysis. Than we can have 100% if the balance line is a straight line.

Re: Balance Line Deviation incorrect?

https://sc.mogicons.com/c/192.jpg

Re: Balance Line Deviation incorrect?

Popov wrote:

I may use formula similar to the one I use for the Correlation analysis. Than we can have 100% if the balance line is a straight line.

Any news about that new metric already? It would be fantastic to have it just the way you´ve described it there (100% if straight, etc......). Would really love to have this one ASAP :-) :-)

22 (edited by geektrader 2018-04-12 09:23:47)

Re: Balance Line Deviation incorrect?

Hi Guys,

I´ve finally gotten around to implement this in the way that I need it (almost). Please try the attached "AccountStatistics.cs" file. The "Filter non-linear balance pattern" in the Acceptance Criterias now uses the average % deviation from a perfect straight line taken from ALL trades the system made and WITHOUT taking the initial balance into account (like it was before).

The "checkpoints" it uses for that are automatically adjusted to the amount of total trades within each system instead of a previously fixed amount of 100. So this metric will now always be independent from the starting balance and lot-size that the system trades (if fixed lots are being used). Give it a try and use a value of "30" for the "Filter non-linear balance pattern" and you will only get systems with a very straight net profit growth-line.  Of course you can tighten this further (or relax it), if needed. Just give it a try and you´ll see how this is different to how it was implemented before (no more bias to prefer systems with few profit but high stability, starting balance makes no more difference, lot-size makes no more difference either) ...

While at it, I noticed that FSB Pro does not display the Total Trades in the Account Statistics, but only the Executed Orders. I´ve added that in my opinion very important missing metric to the Account Statistics as well.

Good luck creating stable systems ;-)

Post's attachments

AccountStatistics.cs 22.49 kb, 34 downloads since 2018-04-12 

You don't have the permssions to download the attachments of this post.

Re: Balance Line Deviation incorrect?

All,

I put Geektrader's AccountStatistics.cs file in this folder (C:\Program Files\Forex Strategy Builder Pro\User Files\Code) and restarted FSB but have not noticed a change.  Is there something else I must do?

Should I see a change in the Account Statistics section or the Acceptance Criteria, or somewhere else?

This is my first time tweaking this.  I'm only a 2 month FSB user.

Thanks.

Re: Balance Line Deviation incorrect?

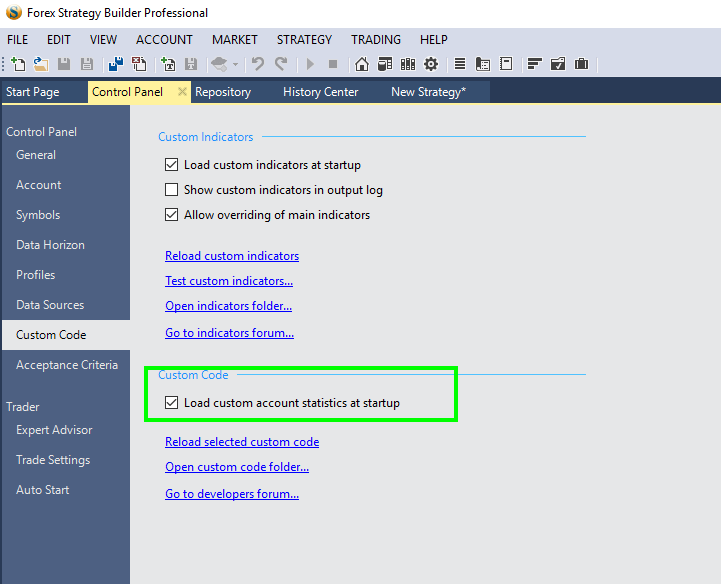
Check if the "Load custom account stats" is enabled.

https://s7.postimg.cc/itooswnkr/screenshot_217.png

Re: Balance Line Deviation incorrect?

I saved the original .cs file with a new name and gave the new file the original file name.  Is this the correct procedure?