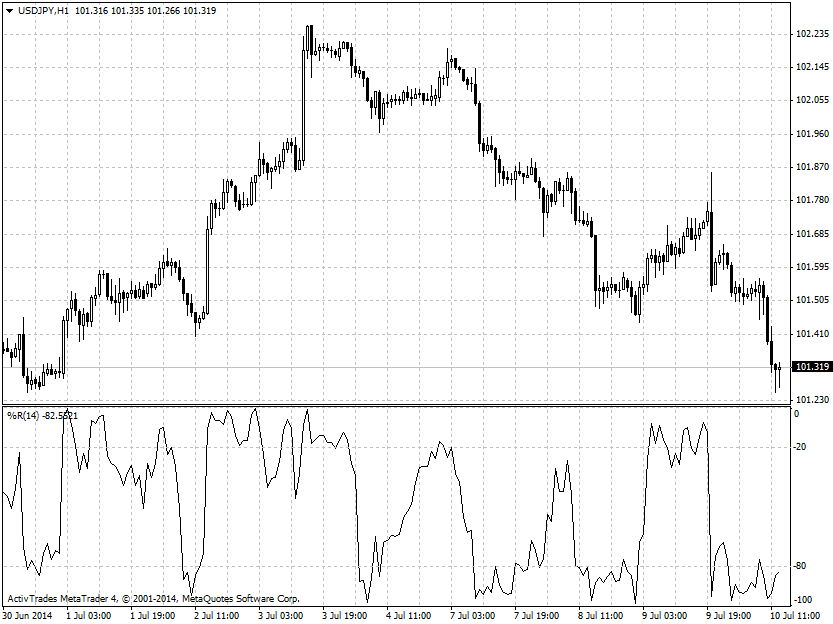
Williams %R
Williams %R is a momentum indicator, developed by Larry Williams, that reflects the level of the close relative to the highest high for the selected period. This indicator is similar to the Stochastics oscillator and is used to identify overbought and oversold market conditions. Williams %R is calculated by the following formula:
%R = (Highest High - Close)/(Highest High - Lowest Low) * -100
The indicator is plotted on a negative scale, from -100 (lowest value) up to 0 (highest value). Readings over 80 usually indicate that the market is in oversold condition, while readings below 20 suggests that the market is in overbought condition. The central line, -50, is also an important level. Values above this central line suggest that the bulls control the market, while the values below it, suggest that the bears are stronger.
Williams used a 10 trading day period and suggested the following rules for trading
Buy signal:
- %R reaches -100%.
- Five trading days pass since -100% was last reached
- %R rises above -95% or -85%
Sell signal:
- %R reaches 0%.
- Five trading days pass since 0% was last reached
- %R falls below -5% or -15%
