Support and Resistance Levels
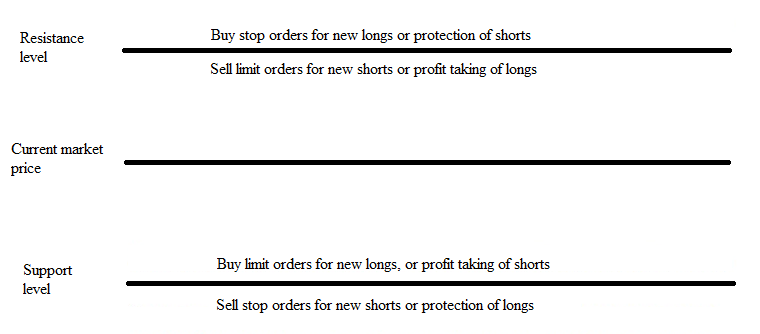
Support and resistance levels are points on the chart where the price move is expected to stop at least for a while or reverse. I will not waste your time with unnecessary definitions, because their names say everything there is to say. Resistance levels are above the current market price and are capping the upward price movement. Support levels are below the current market price and are stopping the downward price moves. In an uptrend, it could be expected that the levels of support will withstand testing and the price will break easier through resistance levels. The opposite is valid for the downtrends - at resistance levels it is easier to stop the price move, and the levels of support are usually broken. When a resistance level is penetrated, it usually becomes a support level and vice versa. Support and resistance levels could be dynamic and static. The main reason why we have to know the support and resistance levels is the fact that market participants usually place their orders around them. On the chart below you can see what types of orders could be expected around these levels.
Orders around support and resistance levels
The most important support and resistance levels are:
- Swing highs and lows
- Trend lines
- Moving averages
- Pivot points
- Fibonacci levels
- Psychological levels
- Bollinger bands
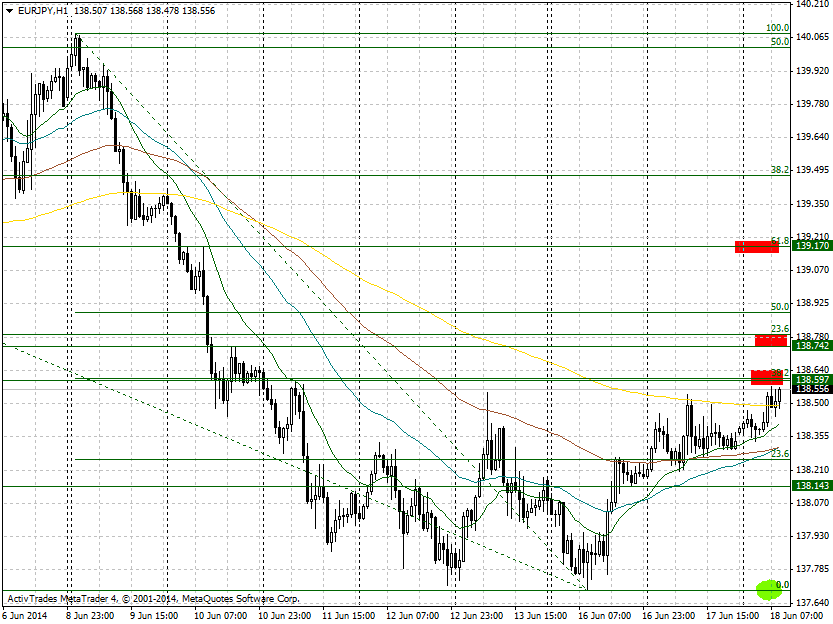
Your first job every morning should be drawing the trend lines and price channels and determining the closest levels of support and resistance. I call this my road map. This road map helps me to determine possible entry points and price levels where large bids or offers could be placed.
EUR/JPY road map