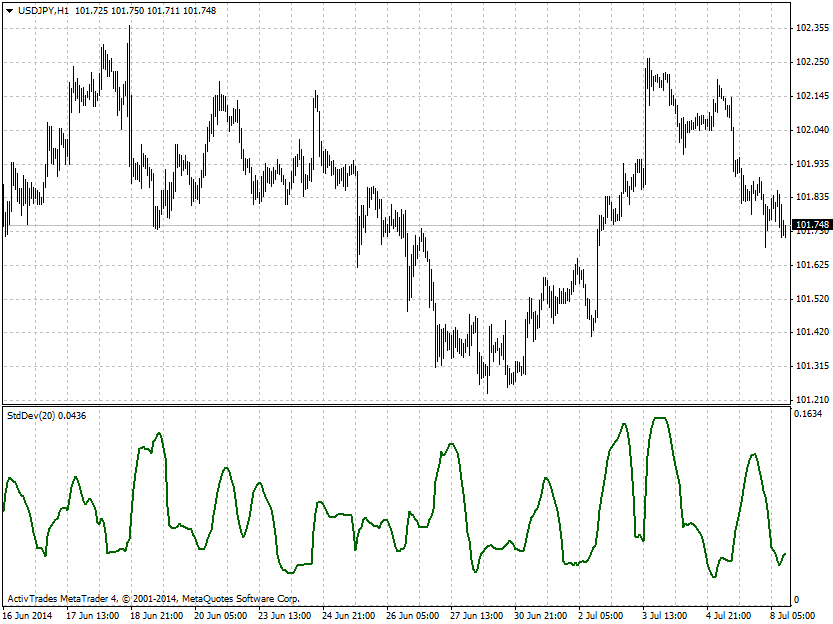
Standard Deviation
Standard deviation (σ) measures the amount of variation or dispersion from the average. Low values of the standard deviation mean that the data points are close to the average and volatility is low. High values of the standard deviation mean that the data points are at various distances from the average and volatility is high.
Standard deviation is calculated by the following formula:
 , where
μ is the average (mean) of the time series
In statistics, there is the so called 68–95–99.7 rule, which states that nearly all values lie within three standard deviations of the mean in a normal distribution. 68.27% of the values lie within one standard deviation of the mean,while 95.45% of the values lie within two standard deviations. Volatility is cyclical and we can use the standard deviation to identify periods when it is very low or high and trade it via options (plain vanilla or binaries). This is much easier than trading of the price trends.
