Table of Contents
Filed under Forex Strategy Builder - Overview » Articles and Tutorials
Reliable Backtesting
Ambiguous bars
Forex Strategy Builder tests a strategy by following each data bars one by one. For each bar the program analysis the strategy and gives the necessary orders. Another part of the program follows the fluctuations of the price and when reaching an order, performs a certain transaction. A problem arises when the testing algorithm does not have the necessary information about the exact route of the price. This occurs when interpolating a single bar of the loaded data.
The steady information, which the program has, is as follows:
- Opening price – this is the starting point of the interpolation
- Top price
- Bottom price
- Closing price – this is the point where the interpolation of the bar ends
These are the four points which need to be visited. What we know for sure is that the going round begins at Opening price and ends at Closing price. What we don’t know is the succession in which the top and the bottom prices for a bar are reached. Statistics show that with increasing bars, in 80% of the cases, the bottom of the bar is reached first, while with decreasing bars, it is the top that is reached first.
The question of the volatility of the price is a major one. It is actually the question of whether the price goes back to a value that has already been reached during the same bar.
This lack of sufficient information leads to ambiguity at interpolating the price in a bar which contains more than one order. Such a bar is viewed as ambiguous.
Forex Strategy Builder marks the ambiguous bars and lists their number in the statistical information. Decreasing their number leads to obtaining more-accurate results by the back test.
Algorithm fitting
Fitting the algorithm consists in exploiting the testing algorithm so that it leads to better results.
This can be tested when we change the scenario used by Forex Strategy Builder to go round the points in the bar data and the change of the result will be evident. Of course, the change of the interpolation methods concerns the ambiguous bars only.
There are five interpolating algorithms and each one follows a given scenario. We will assume that the real, historical development is in between. We emphasize the fact that none of these algorithms, taken alone, guarantees reliable results.
The average chart of the Method Comparator is assumed to be closest to the real one.
One example of fitting the algorithm is the Stop Limit exit strategy, within the limits of a single bar. The optimistic scenario will show strongly overstated results, while the pessimistic one will show unrealistically understated results. The truth is somewhere in between.
Over-optimization
Over-optimization (curve fitting) is a process of optimization of the indicator parameters to particular data. Computer technologies can be easily used for the purposes of over-optimization of a trading system to produce a seemingly fine result. The optimizer tests thousands of parameters values and can find the exact numbers, making this strategy very “profitable” for the data used. The problem is that such a “profitable” strategy is only profitable when applied to this particular data. However, it is most likely that it will be used in the real world.
The indicator parameters that work over a wide range are steadfast.
If a small change in the parameter value changes the strategy result dramatically, you should be careful.
For example, if a given system works well at MA(20) but does not work at MA(19) or MA(21), your parameters are over-optimized. On the other hand, if it works at Moving Average with a range of 15 to 25, your system is much steadier and more reliable.
Multiple signals within the same bar
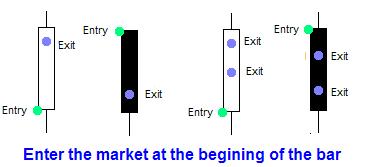
Entering the market at the beginning of the bar guarantees that the closing price is reachable after the position has been opened. This helps avoid ambiguity as to which point was the first to reach.
If there is more than one closing price for a given position, Forex Strategy Builder will close all lots at the first reached level and will cancel all other orders. A safe situation will be when the two out coming prices are, simultaneously, either above the opening price or below it.
If one of the closing prices is above the Opening price, and the other one is below it, it is impossible for the tester to tell which price has been reached first (intrabar scanning can clarify the situation).
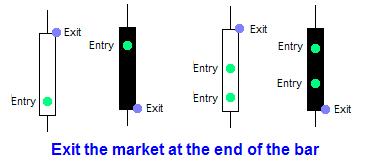
It is safe to close the position not earlier than the end of the bar. Thus, we make sure that the price has first gone through the point of opening and the back test is correct.
When Forex Strategy Builder meets the next incoming order, it acts following the logic of Same Direction Signal and Opposite Direction Signal. Depending on the chosen values, the position can be brought to average, closed, or the signal can be ignored.
Some strategies uses entry and exit point different than Open price and Close price. For example, a strategy may open a position at MA and close it at some other indicator or at a Stop Loss or a Take Profit level. In that case, the program first interpolates the bar and if reaches the entry point, it opens a position. After the position was open, FSB places the corresponding exit orders.
Tricky indicators
It may sound strange, but there are indicators which change the previous signals. This behaviour of theirs is not of vital importance for the historical test, but it is disastrous for real time trading.
The Fibonacci indicator is one of them. It is based on the Zig-Zag indicator and determines the respective Fibonacci levels between the defined tops and bottoms. With static data they are strictly fixed; with real time data, however, it is possible for the price of some bars to fall and, afterward, rise sharply. This results in a change in Zig-Zag's “opinion” of the previous peak values; consequently, it can change them. There follows a change in the Fibonacci levels between the last bottom - top. Forex Strategy Builder testing algorithm will take into account these changed values which best reflect the price movement. The problem arises in real trade, where we cannot change the level at which we have concluded a deal.
The difference between the forex strategy back test and the real trade, depending on the chosen logic, may consist in either overstated or understated results.
Practice shows that this is quite tricky. In cases when the result is unrealistically understated, we simply ignore this strategy. In the opposite situation, however, the overstated result can lead to real financial loss.
The only indicator, exhibiting such behaviour at Forex Strategy Builder is the Fibonacci indicator. We have marked it with For Demo Only!
Please, be extremely careful when using it.
More information is available in the forum.

