forex software

Create and Test Forex Strategies

forex software

Skip to forum content

Forex Software

Create and Test Forex Strategies

You are not logged in. Please login or register.


(Page 9 of 9)

Forex Software → Market Analysis → Daily Analysis By FXGlory

Pages Previous 1 7 8 9

You must login or register to post a reply

RSS topic feed

Posts: 201 to 209 of 209

Re: Daily Analysis By FXGlory

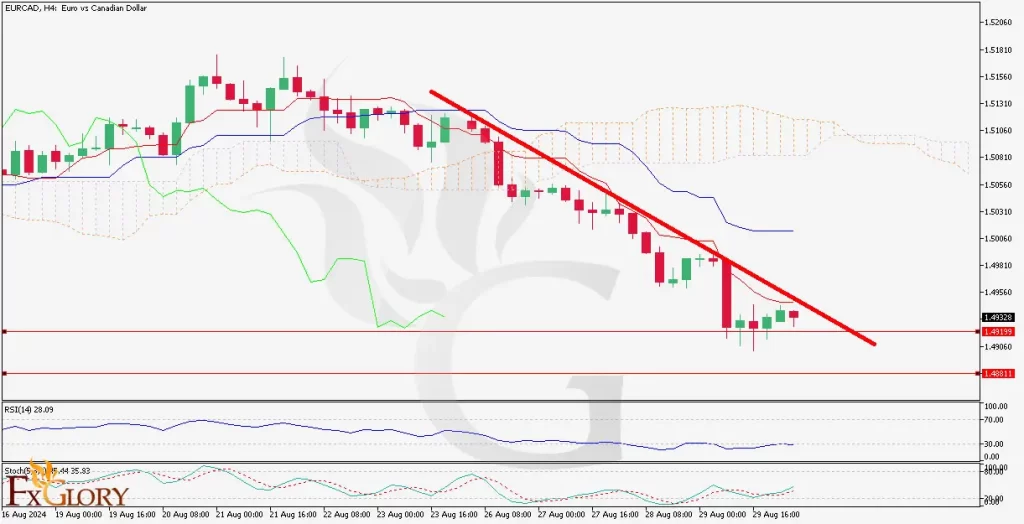
EUR/CAD H4 Technical and Fundamental Analysis for 08.30.2024


https://fxglory.com/wp-content/uploads/2024/08/EURCADH4-1-1024x524.webp


Time Zone: GMT +3
Time Frame: 4 Hours (H4)


Fundamental Analysis:
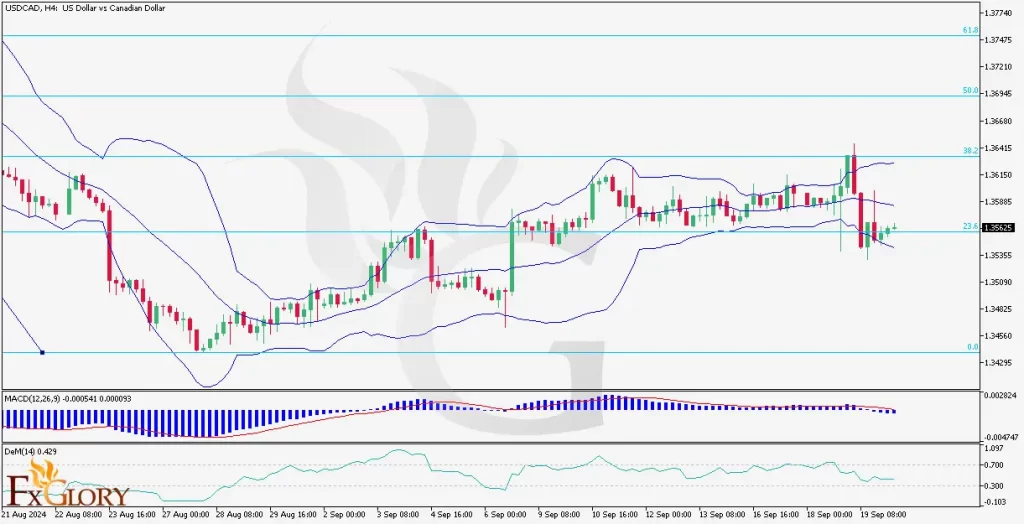
The upcoming economic data releases from both the US and Japan are set to influence the USD/JPY pair's direction prediction. In the US, key indicators such as the S&P/CS Composite-20 HPI y/y, HPI m/m, CB Consumer Confidence, and Richmond Manufacturing Index will be released. The S&P/CS Composite-20 HPI y/y is expected to show a slight decrease from 6.8% to 6.2%, indicating a cooling in the housing market. Meanwhile, the CB Consumer Confidence index is expected to rise to 100.9 from a previous 100.3, suggesting improved consumer sentiment. The Richmond Manufacturing Index is projected to show an improvement from -17 to -14, which still indicates contraction but at a slower pace. These mixed data points could create a volatile trading environment for the USD.
On the Japanese side, the Services Producer Price Index (SPPI) y/y is forecasted to slightly decrease from 3.0% to 2.9%, signaling a potential slowdown in price pressures; which stands as an important forecast element for this fore pair. The BOJ Core CPI y/y is expected to remain stable at 2.1%, suggesting persistent inflation concerns within Japan. The stable inflation rate and the recent dovish stance of the Bank of Japan could continue to exert downward pressure on the JPY.

Price Action:
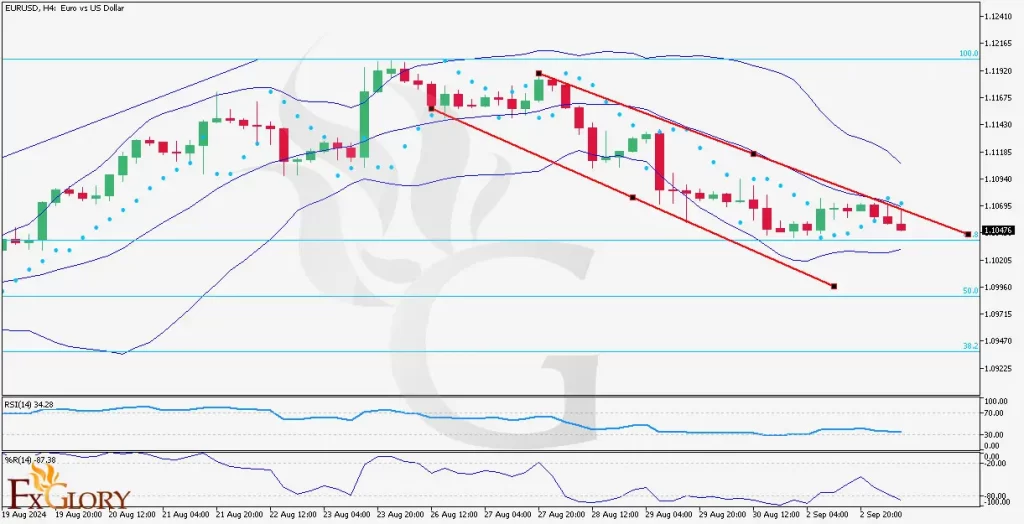
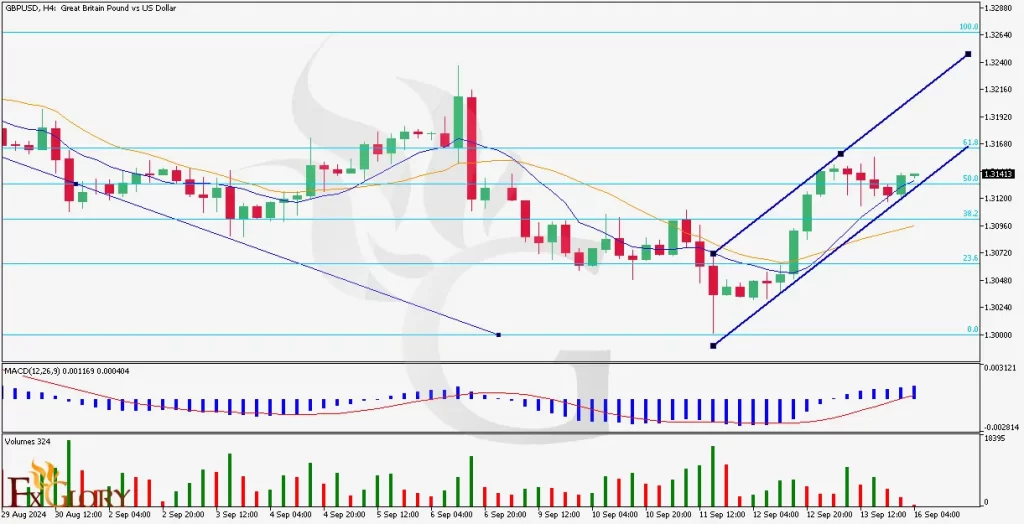
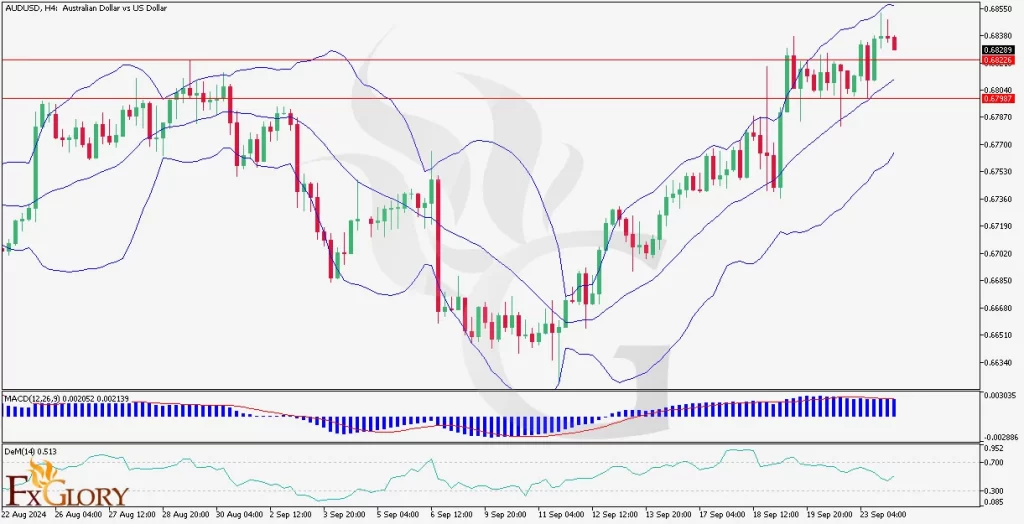
The USD/JPY pair is forming a bearish flag pattern on the H4 chart after a significant bearish wave, which suggests a potential continuation of the downward trend. The price is currently consolidating within this pattern, and a breakout to the downside could accelerate the bearish momentum. However, the presence of bullish technical indicators points to a possible short-term corrective wave.


Key Technical Indicators:
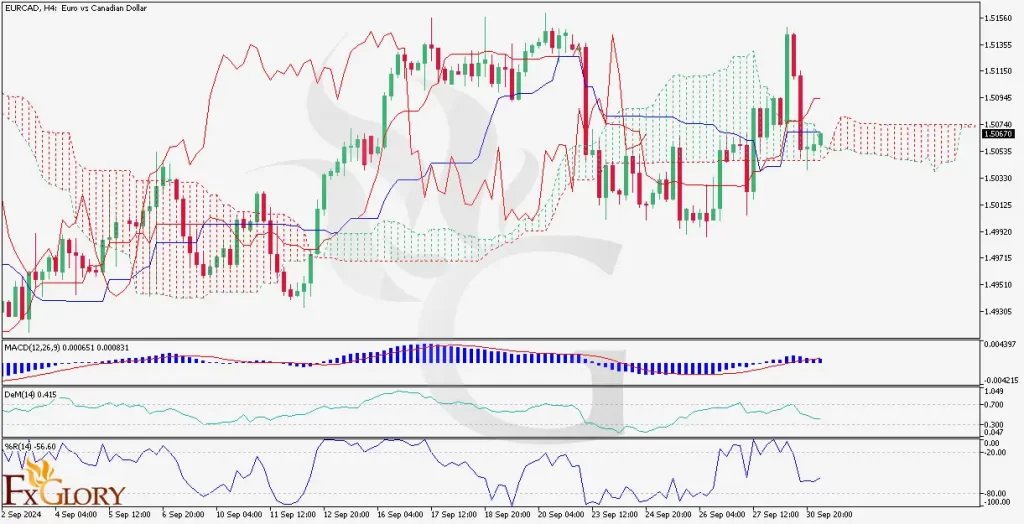
Support Levels: The immediate support is at 1.4881. A break below this level could see the pair testing lower support zones, which may align with historical lows.
Resistance Levels: The immediate resistance is the descending trend line. A successful breakout above this line, confirmed with a close above 1.4932, could indicate a shift to a bullish phase, targeting higher resistance areas.

Support and Resistance:
Support Levels: The nearest support is at the lower trendline of the bearish flag pattern, around 144.00. A break below this level could see the pair testing the next support near 142.50, which aligns with previous lows.
Resistance Levels: Immediate resistance is at the upper trendline of the bearish flag, around 145.00. A break above this level could target the next resistance at 146.50, potentially invalidating the bearish flag pattern and signaling a bullish reversal.

Conclusion and Consideration:
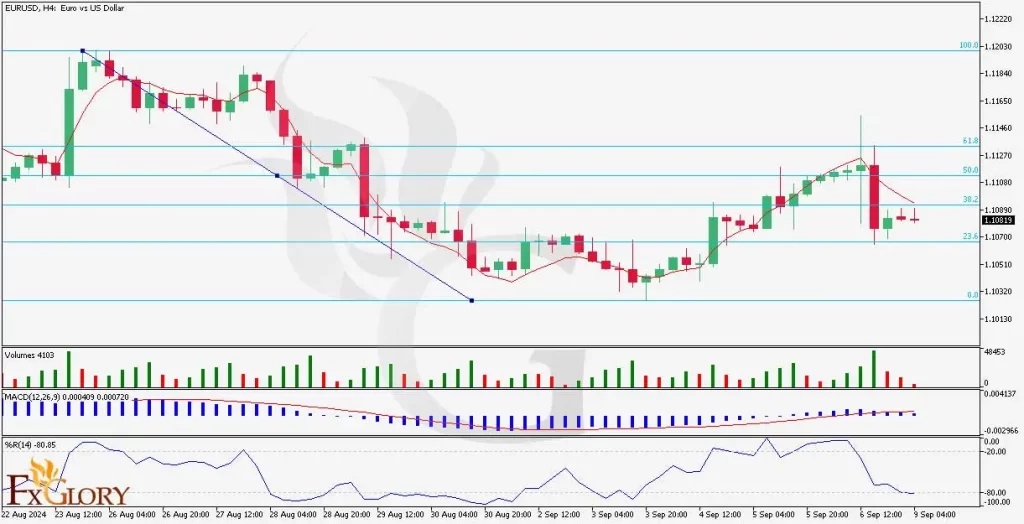
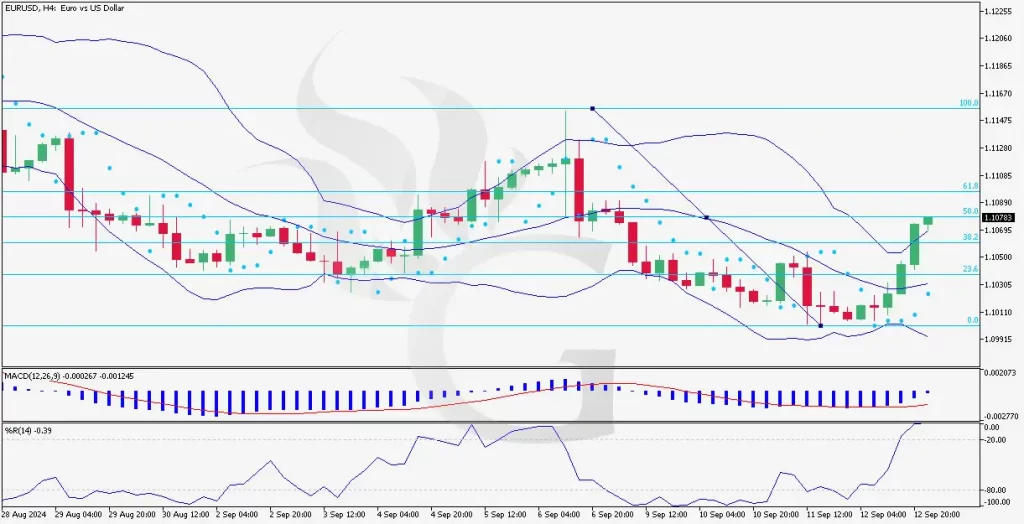
The EUR/CAD H4 chart suggests that while the pair is in a bearish trend, technical indicators are showing signs of a potential short-term reversal due to bullish divergence and oversold conditions. Fundamental factors, including weaker-than-expected Eurozone inflation data and slightly weaker Canadian GDP figures, could provide mixed influences on the pair. Traders should closely monitor the price action around the descending trend line for potential breakout opportunities, either to the upside for a buy signal or to the downside below the support level for a sell signal.

Disclaimer: The provided analysis is for informational purposes only and does not constitute investment advice. Traders should conduct their own research and analysis before making any trading decisions.

FXGlory
08.30.2024

Re: Daily Analysis By FXGlory

EUR/USD H4 Technical and Fundamental Analysis for 09.03.2024


https://fxglory.com/wp-content/uploads/2024/09/EURUSDH4-Daily-technical-and-fundamental-analysis-on-09.03.2024-1024x524.webp


Time Zone: GMT +3
Time Frame: 4 Hours (H4)


Fundamental Analysis:
The EUR/USD currency pair is experiencing notable fluctuations influenced by a mix of European economic data and US market dynamics. Today's EURUSD calendar includes significant releases like the Real Retail Sales from Germany and the French General Budget Outcome, both pivotal in shaping the Euro's trajectory. Concurrently, the speech by Deutsche Bundesbank President Joachim Nagel is highly anticipated, with potential implications on the Euro's strength depending on the tone and content regarding future monetary policy. Across the Atlantic, the US market awaits the PMI data, which is a critical economic health indicator. Such data can directly impact the USD's strength against a backdrop of global economic uncertainties.


Price Action:
The EUR/USD Price Action has shown a consistent bearish trend on the H4 chart, marked by a descending channel pattern. Recent sessions have recorded a narrow oscillation between the middle and lower Bollinger Bands, indicative of bearish momentum with intermittent stability. The last three candles, specifically bearish, reinforce the downtrend, hinting at potential continued bearish pressure if the upper resistance of the channel holds.


Key Technical Indicators:
Bollinger Bands:
The EUR/USD's price movement within the Bollinger Bands displays a bearish trend, as it hovers between the middle and lower bands. The narrowing of the bands slightly suggests a decrease in market volatility and a potential consolidation phase could be nearing.
Parabolic SAR: Indicative dots positioned above the candles signal continued bearish dominance, aligning with the overall downtrend observed in the price channel.
RSI (Relative Strength Index): With an RSI value at 34.28, the market is nearing oversold territory, suggesting a potential slowdown in the bearish momentum or a forthcoming bullish correction.
%R (Williams Percent Range): The %R indicator at -87.38 further corroborates the strong bearish momentum, as it lies close to the extreme end of its range, signaling that the market might be oversold.


Support and Resistance Levels:
Support:
The nearest significant support level is observed around 1.09470, which aligns with historical lows and the lower Bollinger Band.
Resistance: Resistance can be found at approximately 1.11095, coinciding with the channel's upper boundary and the middle Bollinger Band.


Conclusion and Considerations:
The EUR/USD pair is currently in a bearish phase, indicated by both price action and key technical indicators within the H4 timeframe. Investors should remain cautious, as the upcoming economic announcements from both Europe and the United States could inject significant volatility and potentially alter the currency pair's direction. Traders are advised to watch for any breakout above the channel resistance or a bounce from support levels as key signals for short-term trading opportunities.


Disclaimer: The EUR/USD H4 analysis is provided as a general market commentary and does not constitute investment advice. Financial trading involves risks, including the potential loss of principal. Investors should conduct their own research or consult a professional advisor before making any investment decisions. Changes in market conditions can occur rapidly, requiring constant review and adaptation of strategies.


FXGlory
09.03.2024

Re: Daily Analysis By FXGlory

Silver/USD (XAGUSD) H4 Technical and Fundamental Analysis for 09.05.2024


https://fxglory.com/wp-content/uploads/2024/09/SILVER-H4-Technical-And-Fundamental-Analysis-On-09.05.2024--1024x524.webp


Time Zone: GMT +3
Time Frame: 4 Hours (H4)


Fundamental Analysis:
As of the latest market insights, Silver trading against the US Dollar (XAGUSD) on the H4 timeframe shows nuanced movements ahead of significant economic data releases. Today, US economic indicators such as job cut announcements, ADP employment change, and initial jobless claims could sway the USD strength significantly. Favorable reports are expected to bolster the USD, exerting downward pressure on Silver prices. Conversely, weaker data may enhance Silver's appeal as a hedge, pushing prices upward. Investors and traders should remain vigilant to these updates to gauge potential market directions effectively.


Price Action:
On the H4 chart, Silver has been navigating a challenging terrain marked by a descending channel, showcasing a bearish trend that recently attempted a reversal. The Silver USD price action near the middle Bollinger Band indicates a struggle between bears and bulls, with recent candles attempting to break above this resistance. The near-touch of the Fibonacci 50% retracement level suggests a potential shift in momentum if sustained buying pressure continues, pointing to an upcoming test of higher resistance levels.


Key Technical Indicators:
Bollinger Bands: The Silver price has been predominantly in the lower half of the bands but recently rebounded from the lower band towards the middle. This movement indicates a possible alleviation of the selling pressure, with the current Silver price attempting to breach the middle band—a crucial pivot for further bullish signals.
Parabolic SAR: Recent dots positioned below the candles signify a potential reversal from the prior downtrend. This indicator suggests that the downtrend momentum is losing strength, and a bullish sentiment might be developing, especially as the price approaches the middle Bollinger Band and the Fib 50% level.
RSI (Relative Strength Index): With a reading of 41.93, the RSI indicates that the market is neither oversold nor overbought, leaving room for potential upward movement if buying pressure increases.
MACD (Moving Average Convergence Divergence): The MACD line remains below the signal line, indicating ongoing bearish momentum. However, the decreasing histogram bars may suggest that the bearish momentum is weakening, aligning with the potential shift suggested by other indicators.


Support and Resistance Levels:
Support Levels: Immediate support is found at the 23.6% Fibonacci retracement level, around $27.322, where previous lows have consolidated.
Resistance Levels: Initial resistance is observed at the 38.2% Fibonacci level, near $28.018. A breach above this could test the 50% level at approximately $28.710, which aligns with the middle Bollinger Band.


Conclusion and Consideration:
The Silver/ XAGUSD market on the H4 chart presents a complex scenario, balancing between bearish trends and emerging bullish signals. The approaching economic data from the US could serve as a catalyst for significant price movements. Traders should monitor these indicators closely, considering both the technical setups and external economic factors influencing market dynamics.


Disclaimer: This Silver USD analysis is provided for informational purposes only and does not constitute investment advice. Investors should conduct their due diligence and consider their financial position before engaging in trades based on this analysis.


FXGlory
09.05.2024

Re: Daily Analysis By FXGlory

USDCAD H4 Technical and Fundamental Analysis for 09.06.2024


https://fxglory.com/wp-content/uploads/2024/09/USDCADH4-Technical-Analysis-for-09.06.2024-1024x524.webp


Time Zone: GMT +3
Time Frame: 4 Hours (H4)


Fundamental Analysis:
The USDCAD pair remains sensitive to key economic releases from both the U.S. and Canada. On the U.S. side, today’s Non-Farm Payrolls (NFP) and unemployment data will have a major impact on the U.S. Dollar’s strength. Positive employment data can strengthen the Dollar as it signals economic growth and could lead to further interest rate hikes by the Federal Reserve. Additionally, any hawkish commentary from Federal Reserve officials, including John Williams and Christopher Waller, will be closely watched for clues on monetary policy direction. On the Canadian side, the upcoming employment and unemployment data are key drivers for the Canadian Dollar. Better-than-expected employment figures can boost the CAD, indicating stronger economic activity in Canada. These releases will likely bring increased volatility to the USD/CAD forex pair.


Price Action:
On the H4 chart, the USD CAD is currently in a bearish trend, trading below the 50% Fibonacci retracement level. Over the last few sessions, the price has been consolidating between the 1.34827 support and the 1.35562 resistance level. The pair briefly attempted to recover but has since retraced and is now hovering near the lower Bollinger Band. The bearish pressure is strong, though a potential bullish correction could be on the horizon if key support levels hold.


Technical Indicators:
Bollinger Bands:
The USD-CAD price is in the lower half of the Bollinger Bands, indicating bearish pressure. It is trying to move closer to the middle band, signaling a possible consolidation phase. The bands have widened recently, indicating increased volatility, which may precede a breakout in either direction.
Parabolic SAR: The Parabolic SAR dots have recently flipped above the candles, indicating that the current trend is bearish. Traders should watch for any reversal signals that could emerge if the price moves above key levels.
RSI (Relative Strength Index): The RSI is at 45.55, which is below the 50 neutral mark but far from the oversold territory. This suggests that while the bearish momentum is intact, there may still be room for further downside before the market becomes oversold.
MACD (Moving Average Convergence Divergence): The MACD histogram is slightly below the zero line, showing weak bearish momentum. The MACD line remains below the signal line, but any potential crossover could indicate the beginning of a bullish correction.


Support and Resistance Levels:
Support:
The immediate support is located at 1.34827. A break below this level could open the door for further downside, potentially targeting the next key support at 1.34000.
Resistance: The nearest resistance is at 1.35562. If the price manages to break above this level, it could trigger a bullish correction towards the next resistance at 1.36300.


Conclusion and Consideration:
The USDCAD H4 chart shows a clear bearish bias, with key indicators like the Bollinger Bands, Parabolic SAR, and MACD signaling downward momentum. However, upcoming fundamental data, especially from the U.S. labor market and Canadian employment figures, will likely play a critical role in determining the pair's next move. Traders should remain cautious and monitor support and resistance levels closely, as a break could signal a shift in momentum. Additionally, news from Federal Reserve officials may provide further insight into the USD’s potential strength.


Disclaimer: The analysis provided here is for informational purposes only and does not constitute financial advice. Trading Forex involves significant risk, and traders should conduct their own research or consult with a professional before making any trading decisions. Always stay updated on the latest market conditions, as they can change rapidly.


FXGlory
09.06.2024

Re: Daily Analysis By FXGlory

EURUSD Daily Technical and Fundamental Analysis for 09.09.2024

https://fxglory.com/wp-content/uploads/2024/09/EURUSDH4-technical-and-fundamental-analysis-for-09.09.2024-1024x524.webp


Time Zone: GMT +3
Time Frame: 4 Hours (H4)


Fundamental Analysis:
The EUR/USD currency pair is currently influenced by key economic releases from both the Eurozone and the United States. From the USD side, the upcoming Wholesale Inventories report from the Census Bureau will be closely watched. A figure lower than forecast could signal inventory depletion and boost future purchasing power, benefiting the USD. Additionally, the Federal Reserve's Consumer Credit data, which reflects consumer spending confidence, could strengthen the USD if it shows an increase, as rising credit often correlates with consumer optimism. For the Euro, the Sentix Investor Confidence index will be critical. A higher-than-expected figure would indicate optimism in the Eurozone, potentially supporting the EUR. However, a negative result could reflect investor pessimism, putting further pressure on the Euro. These data releases will influence market sentiment and are likely to drive volatility in the EUR/USD pair.


Price Action:
The price action on the EUR/USD H4 chart shows a bearish trend, with the pair experiencing significant downward movement since August 23, 2024. After reaching a low around 1.1032, the pair retraced upwards, but the recovery was halted near the 61.8% Fibonacci retracement at 1.1184. The most recent candles indicate renewed bearish momentum as the pair failed to hold above the 50% Fibonacci retracement at 1.1108, suggesting that sellers are still in control. The price is currently consolidating around the 38.2% Fibonacci level at 1.1089. A further decline could push the pair back toward the 23.6% retracement level at 1.1067, and a break below this would likely lead to a retest of the recent low at 1.1032. However, if buyers regain control, a push above 1.1108 could lead to a test of the 61.8% level at 1.1184.


Key Technical Indicators:
Triple Exponential Moving Average (TEMA):
The TEMA is indicating a bearish bias, with the price trading below the short-term moving average, signaling continued downward momentum. As the price hovers near key support levels, traders should watch for a potential bounce or further downside acceleration if the price remains below the TEMA.
Volumes: Volume analysis reveals that sellers have dominated recent sessions, as higher volumes were recorded during the downtrend. However, volumes have started to decrease slightly as the price approaches key support levels, suggesting that bearish momentum may be weakening. A resurgence in volume during the next price movement will be crucial in confirming the direction of the next trend.
MACD (Moving Average Convergence Divergence): The MACD histogram is currently below the zero line, confirming the bearish trend. Although the histogram bars are shrinking, indicating waning downward momentum, the MACD line remains below the signal line, suggesting that the market sentiment is still bearish. A bullish crossover of the MACD and signal lines would be needed to signal a potential trend reversal.
%R Indicator (Williams Percent Range): The %R indicator is in the oversold zone, currently around -80.85. This suggests that the market could be nearing a point of exhaustion in the current bearish move. While oversold conditions often precede a reversal, strong trends can keep the %R indicator in this zone for some time, so traders should look for confirmation before taking long positions.


Support and Resistance Levels:
Support Levels:
The first key support level is at 1.1067, aligned with the 23.6% Fibonacci retracement. A break below this level could open the door to further downside, targeting the recent low at 1.1032, which has provided significant support in recent sessions. If this level is breached, the next psychological support is at 1.1015, where buyers may attempt to step in to prevent further declines.
Resistance Levels: Immediate resistance is at 1.1108, the 50% Fibonacci retracement level, where the price has previously stalled. A breakout above this level would suggest a possible shift in sentiment, targeting the next resistance at 1.1130. The most significant resistance is at 1.1184, the 61.8% Fibonacci retracement level, where sellers are likely to re-enter the market. A close above this level could signal a potential bullish reversal.


Conclusion and Consideration:
The EUR/USD pair remains in a bearish trend on the H4 chart, supported by key technical indicators such as the TEMA and MACD, despite signals of weakening momentum. The upcoming economic releases, particularly from the U.S. Census Bureau and Federal Reserve, as well as the Sentix Investor Confidence report from the Eurozone, will play a pivotal role in determining the next significant price movement. Traders should watch closely for price action around key support and resistance levels, as a break below 1.1067 would indicate continued bearish pressure, while a move above 1.1108 could signal the start of a bullish recovery.


Disclaimer: The analysis provided for EUR/USD is for informational purposes only and does not constitute financial advice. Traders should conduct their own analysis and consider their risk tolerance before making any trading decisions. The forex market can be highly volatile, and unexpected news or events may lead to rapid changes in market conditions.


FXGlory
09.09.2024

Re: Daily Analysis By FXGlory

GBPAUD H4 Technical and Fundamental Analysis for 09.10.2024


https://fxglory.com/wp-content/uploads/2024/09/GBPAUDH4-technical-and-fundamental-analysis-for-09.10.2024-1024x524.webp


Time Zone: GMT +3
Time Frame: 4 Hours (H4)


Fundamental Analysis:
Upcoming economic data releases from both the UK and Australia will play a crucial role in predicting the direction of the GBP/AUD pair. Key releases for the GBP currency include Claimant Count Change, Average Earnings Index 3m/y, and the Unemployment Rate. The Claimant Count Change is expected to show an improvement from 135K to 95.5K, suggesting a slight improvement in the UK labor market. Average Earnings Index 3m/y is forecasted to dip from 4.5% to 4.1%, indicating weaker wage growth. The Unemployment Rate is projected to hold steady at 4.1%, which may keep investor confidence intact but limits any significant bullish move in the GBP.
On the Australian side, the Westpac Consumer Sentiment data, along with the NAB Business Confidence report, is expected to provide insights into the current economic outlook. If both data sets show improving confidence, it could strengthen the AUD in the short term.


Price Action:
The GBP/AUD price line has entered a correction phase after a strong bullish wave. Currently, the price is consolidating above the Ichimoku cloud, which suggests that bullish sentiment may remain dominant in the near future. RSI (Relative Strength Index) is not yet in the overbought area, and the stochastic indicator shows that the bearish momentum is nearly exhausted. Traders should keep an eye on the bearish trend line within this correction phase, as a breakout above this area could signal the continuation of the bullish trend.


Key Technical Indicators:
RSI: The RSI is hovering below the overbought level, suggesting more room for upward movement before reaching overextended conditions.
Stochastic: The stochastic oscillator is showing signs of reaching the end of a bearish run, hinting at a potential bullish crossover.
Ichimoku Cloud: The price has broken above the cloud, which is a bullish signal, and could indicate further upside if the price sustains above this area.


Support and Resistance:
Support Levels: The nearest support is at 1.9500, just above the lower boundary of the Ichimoku cloud. A break below this level could signal further bearish correction toward 1.9450.
Resistance Levels: Immediate resistance is at the descending trend line formed in the current correction phase. A breakout above 1.9600 could confirm a continuation of the bullish trend, targeting the next resistance around 1.9700.


Conclusion and Consideration:
The GBP/AUD H4 chart suggests that while the pair is undergoing a corrective phase, the overall sentiment remains bullish due to the price holding above the Ichimoku cloud. If the price breaks above the current descending trend line during this correction, bulls are likely to take over the market again. Traders should also pay close attention to upcoming GBP and AUD economic data releases, as these can highly influence the pair’s movement in the short term.


Disclaimer: The provided analysis is for informational purposes only and does not constitute investment advice. Traders should conduct their own research and analysis before making any trading decisions.


FXGlory
09.10.2024

Re: Daily Analysis By FXGlory

NZDUSD H4 Technical and Fundamental Analysis for 09.11.2024


https://fxglory.com/wp-content/uploads/2024/09/nzdusd-chart-analysis-09-11-2024-1024x524.webp


Time Zone: GMT +3
Time Frame: 4 Hours (H4)


Fundamental Analysis:

Upcoming economic data releases from both the U.S. and New Zealand will play a crucial role in determining the future direction of the NZD/USD pair. On the U.S. side, the most anticipated releases include the Core CPI m/m, which is expected to remain steady at 0.2%, and the overall CPI y/y, expected to dip slightly from 2.9% to 2.5%. These inflation figures are significant in shaping the Federal Reserve's monetary policy outlook and could strengthen or weaken the USD depending on the outcome. Crude Oil Inventories and the 10-y Bond Auction are also on the calendar, with lower oil inventories potentially lifting crude prices, which could influence inflationary expectations.
For New Zealand, the Food Price Index (FPI) is expected to show a modest increase of 0.4%. Although not a major economic indicator, any significant deviation could impact the NZD slightly, especially in the absence of other major economic data. Overall, the combination of U.S. inflation data and New Zealand’s FPI may contribute to a period of volatility for the NZD/USD pair.


Price Action:

The NZD/USD price line recently broke below the Ichimoku cloud, indicating a shift to bearish sentiment on the H4 chart. The price action has been forming lower highs and lower lows, a typical characteristic of a downtrend. With the RSI hovering below the 40 level and the stochastic oscillator nearing oversold territory, there is strong potential for continued bearish momentum. Traders should watch for further declines as the bearish structure remains intact, especially if the price fails to break back above the Ichimoku cloud.


Key Technical Indicators:

RSI: The RSI is currently at 38.90, indicating bearish sentiment but not yet oversold. There is room for the pair to continue its downward move before a reversal is likely.

Stochastic: The stochastic oscillator is reading at 29.54 and 41.98, showing potential for a bearish crossover, which could signal continued selling pressure.

Ichimoku Cloud: The price has broken below the Ichimoku cloud, suggesting that the pair is firmly in a bearish trend. A failure to break back above the cloud could lead to further downside.


Support and Resistance:

Support Levels: The nearest support is at 0.6100, which could act as a crucial level to watch for any bearish continuation. A break below this level may see the price heading toward the 0.6050 region.

Resistance Levels: Immediate resistance is at 0.6175, near the lower boundary of the Ichimoku cloud. A break above this level would signal a potential end to the bearish phase, targeting the next resistance at 0.6200.


Conclusion and Consideration:

The NZD/USD H4 chart signals a clear bearish trend with the price breaking below the Ichimoku cloud and forming lower highs and lower lows. Traders should watch the upcoming U.S. CPI data closely, as any surprises could significantly impact the USD and further drive the pair’s movement. On the technical side, as long as the price remains below the cloud, bearish momentum is expected to continue. A break below the support at 0.6100 could accelerate the decline, while a move back above the resistance at 0.6175 would signal a potential shift in sentiment.

Disclaimer: The provided analysis is for informational purposes only and does not constitute investment advice. Traders should conduct their own research and analysis before making any trading decisions.

FXGlory
09.11.2024

Re: Daily Analysis By FXGlory

USDCAD H4 Technical and Fundamental Analysis for 09.12.2024


https://fxglory.com/wp-content/uploads/2024/09/USDCADH4-Daily-technical-and-Fundamental-Analysis-for-09.12.2024--1024x524.webp


Time Zone: GMT +3
Time Frame: 4 Hours (H4)


Fundamental Analysis:

The USD/CAD forex pair represents the exchange rate between the U.S. dollar and the Canadian dollar, with both economies being heavily influenced by commodity prices, particularly oil. Recently, the U.S. dollar has experienced some fluctuations due to upcoming U.S. economic reports, such as unemployment claims and the Producer Price Index (PPI), both of which are crucial for gauging inflation and labor market conditions. For Canada, today’s focus is on oil inventories and the performance of the Canadian economy, heavily tied to global oil prices. Any unexpected movements in oil prices can have a direct impact on the Canadian dollar. As of now, the pair is in a tight range as traders await these key economic releases, with cautious sentiment dominating the market.


Price Action:

In terms of price action, the USD CAD pair has shown an upward trend over the past few sessions but is currently consolidating. It recently retraced from the upper Bollinger Band and has now touched the middle band, which appears to act as support. The last two candles are bullish, indicating potential upward momentum. However, the presence of the Parabolic SAR dots above the price suggests caution, as this can indicate selling pressure. The price is fluctuating between the 38.2% and 23.6% Fibonacci retracement levels, with resistance near the 23.6% level. A break above this level could signal a continuation of the upward trend.


Key Technical Indicators:

Bollinger Bands: The price has moved from the upper band towards the middle band, which is acting as a dynamic support. Currently, the price is showing signs of a potential bounce as the last two candles have turned bullish, indicating that the middle Bollinger Band has provided temporary support.
Parabolic SAR: The last three Parabolic SAR points are positioned above the candles, which signals potential downward pressure. However, since the price is still holding above key support levels, traders should watch for a reversal signal if the dots shift below the price.
MACD: The MACD indicator is currently showing weakening bullish momentum. The histogram is positive but shrinking, indicating that while the uptrend remains, momentum has slowed. A potential bearish crossover could occur if this trend continues, signaling a potential downside move.
%R (Williams %R): The %R is currently around -61, indicating that the market is neither overbought nor oversold. This neutral level suggests there is still room for price action to go either way, depending on market sentiment and upcoming fundamental factors.


Support and Resistance Levels:

Support: Immediate support can be seen near the 38.2% Fibonacci retracement level around 1.3550, followed by more substantial support near the 50% Fibonacci level at 1.3520.
Resistance: The nearest resistance is the 23.6% Fibonacci level at 1.3590. A successful breach of this level could pave the way toward the next resistance at 1.3630, which coincides with the recent swing highs.


Conclusion and Consideration:
The USD-CAD pair is showing mixed signals on the H4 chart. While the price action indicates a possible continuation of the upward trend after bouncing off the middle Bollinger Band, the technical indicators such as the Parabolic SAR and weakening MACD suggest caution. Traders should closely monitor the price’s behavior around the 23.6% Fibonacci level for a potential breakout, while also keeping an eye on upcoming economic releases for both the U.S. and Canada. With upcoming news such as U.S. unemployment claims and Canadian oil inventories, volatility can be expected, which could further influence the pair's direction.


Disclaimer:
This analysis is intended for informational purposes only and should not be considered as financial advice. Always conduct your own research before making trading decisions. Market conditions can change rapidly, and it is important to stay informed of the latest developments.


FXGlory
09.12.2024

Re: Daily Analysis By FXGlory

EUR/USD H4 Technical and Fundamental Analysis for 09.13.2024


https://fxglory.com/wp-content/uploads/2024/09/EURUSD-H4-Daily-technical-and-Fundamental-Analysis-for-09.13.2024-1024x524.webp


Time Zone: GMT +3
Time Frame: 4 Hours (H4)


Fundamental Analysis:
Today, the EUR/USD forex pair is influenced by key economic data releases from both the Eurozone and the US. The Consumer Price Index (CPI) data from INSEE and the industrial production data from Eurostat are likely to set the tone for the Euro, reflecting the inflation rate and manufacturing output within the region. On the US side, the Import Price Index and consumer sentiment data from the University of Michigan are critical, as they provide early insights into inflation and consumer confidence. A higher-than-expected CPI or industrial output reading in the Eurozone could boost the Euro, while strong import price data or positive consumer sentiment in the US would likely strengthen the USD, adding pressure on the EURUSD pair.


Price Action:
In the H4 timeframe, the EUR/USD pair shows a clear bullish trend after rebounding from the 1.1010 level. The price moved from the lower half of the Bollinger Bands, crossing the middle band, and now has reached the upper band, indicating strong bullish momentum. The recent five candles show steady upward movement, as the pair broke through the 23.6% and 38.2% Fibonacci retracement levels and is now testing the 50.0% level. If the pair manages to breach this key resistance level, it could move towards the 61.8% or even the 100% Fibonacci retracement level, though a failure to break through 50.0% may signal a potential retracement to the previous support levels.

Key Technical Indicators:
Bollinger Bands:
The price has moved from the lower half of the Bollinger Bands and is now touching the upper band, which reflects strong bullish momentum. The widening of the bands suggests increasing volatility in the market.
Parabolic SAR: The last five Parabolic SAR dots are placed below the candles, signaling a continuation of the uptrend. As long as the dots stay below the price action, bullish momentum is expected to persist.
MACD: The MACD line is approaching the signal line from below, suggesting a potential bullish crossover. This would confirm the upward momentum if the crossover occurs, signaling continued buying pressure.
Williams %R: Currently, the %R is around -0.39, indicating the price is in bullish territory but not yet overbought. There is still room for upward movement before hitting extreme levels.


Support and Resistance:
Support Levels:
1.1055 (23.6% Fibonacci), 1.1030, and 1.1010 (recent low).
Resistance Levels: 1.1087 (50.0% Fibonacci), 1.1115 (61.8% Fibonacci), and 1.1150 (100.0% Fibonacci).


Conclusion and Consideration: The EUR USD pair is currently in an uptrend on the H4 chart, with strong bullish signals from both technical indicators and price action. If the pair can break above the 50.0% Fibonacci retracement level, it is likely to continue higher towards the 61.8% level. However, if resistance at the 50.0% level holds, a pullback toward the 38.2% level is possible, where previous support levels may provide a buying opportunity. Traders should keep an eye on today’s fundamental data releases, as they could lead to increased volatility and confirm the direction of the pair.


Disclaimer: The provided EUR-USD analysis is for informational purposes only and should not be considered financial advice. Market conditions can change rapidly, and it is essential to conduct thorough research before making any trading decisions.


FXGlory
09.13.2024

Posts: 201 to 209 of 209

Pages Previous 1 7 8 9

You must login or register to post a reply

Forex Software → Market Analysis → Daily Analysis By FXGlory

Similar topics in this forum