Re: Daily Analysis By FXGlory
ETHUSD Daily Technical and Fundamental Analysis for 01.07.2025

Time Zone: GMT +2
Time Frame: 4 Hours (H4)
Fundamental Analysis:
The ETH/USD pair is currently under the influence of a potential "Alcoin season," indicating a surge in interest and investment within the alternative cryptocurrency market. Today's key economic indicators for the USD, including the ISM Services PMI expected to rise to 53.5 from 52.1 and JOLTS Job Openings slightly decreasing to 7.73M from 7.74M, are scheduled for release at 3:00 PM. A stronger-than-expected ISM Services PMI could bolster the USD, potentially exerting downward pressure on ETH/USD. Conversely, stable JOLTS figures are likely to have a neutral impact. Additionally, the increasing interest in alternative coins suggests a bullish sentiment that may support ETH/USD's upward trajectory.
Price Action:
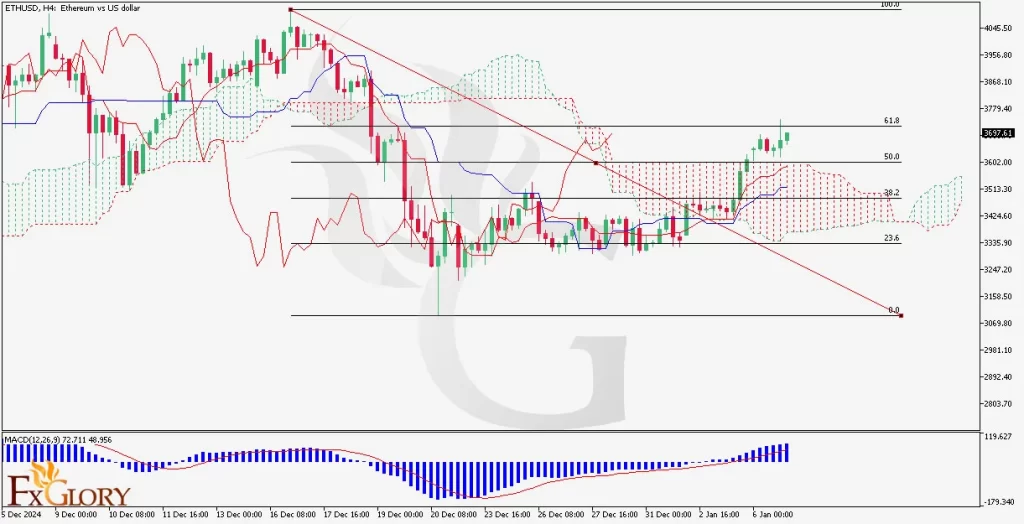
On the H4 timeframe, ETH/USD has embarked on a bullish wave, striving to breach the 0.618 Fibonacci retracement level. The price action reflects a strong upward momentum, with ETH/USD maintaining its stance above key support levels at 3605.70, 3557.5, and 3486.00. This bullish movement suggests sustained buying interest and the potential for further price appreciation. The current attempt to surpass the Fibonacci level is a critical juncture that could either confirm the continuation of the bullish trend or lead to a consolidation phase if the resistance proves too strong.
Key Technical Indicators:
MACD (Moving Average Convergence Divergence): The MACD is displaying a positive divergence, with the MACD line positioned above the signal line. The increasing histogram indicates growing bullish momentum, supporting the current upward trend in ETH/USD.
Ichimoku Cloud: ETH/USD is trading above the Ichimoku Cloud, which is a strong bullish signal. The cloud's configuration provides robust support for the ongoing upward movement, suggesting that the bullish trend is well-supported by this indicator.
Support and Resistance:
Support Levels: Immediate Support: 3605.70 – This level aligns with recent price consolidation and serves as the first line of defense against potential downward movements. Secondary Supports: 3557.5 and 3486.00 – These additional support levels provide strong floors that can absorb further declines, reinforcing the bullish outlook.
Resistance Levels: Primary Resistance: 0.618 Fibonacci Retracement Level – This is the key barrier that ETH/USD is attempting to overcome. A successful breach could lead to significant upward movement. Additional Resistance Levels: Previous highs and psychological price points should be monitored for potential resistance zones that may challenge the bullish momentum.
Conclusion and Consideration:
The ETH/USD pair on the H4 chart exhibits robust bullish momentum, underpinned by key technical indicators such as MACD and the Ichimoku Cloud. The current price action, striving to break above the 0.618 Fibonacci retracement level, indicates a strong potential for continued upward movement. Supported by solid support levels at 3605.70, 3557.5, and 3486.00, the bullish trend appears well-supported. However, traders should remain vigilant of the critical resistance at the Fibonacci level and the impact of upcoming USD economic data releases. A successful breakout could present lucrative trading opportunities, while any failure to breach resistance may lead to a retracement towards the established supports.
Disclaimer: The analysis provided for ETH/USD is for informational purposes only and does not constitute investment advice. Traders are encouraged to perform their own analysis and research before making any trading decisions on ETHUSD. Market conditions can change quickly, so staying informed with the latest data is essential.
FXGlory
01.07.2024


