forex software

Create and Test Forex Strategies

forex software

Skip to forum content

Forex Software

Create and Test Forex Strategies

You are not logged in. Please login or register.


(Page 18 of 71)

Forex Software → Market Analysis → Market Update by Solidecn.com

Pages Previous 1 16 17 18 19 20 71 Next

You must login or register to post a reply

RSS topic feed

Posts: 426 to 450 of 1,773

Re: Market Update by Solidecn.com

NZDUSD Takes Advantage of the American Dollar Weakness

According to the report on foreign trade, exports to New Zealand in September adjusted by 1.6B dollars to 6.0B dollars, while imports – by 1.1B dollars and amounted to 7.6B dollars. Thus, the trade deficit consolidates around 1.6B dollars, down from 2.6B dollars last month. The growth leaders in the export category were livestock products, having increased by 71.0% compared to August, and in the import category – oil and oil products, having added 111.0% over the month. New Zealand is celebrating Labor Day today, and the stock exchanges are closed, as evidenced by low trading volumes, and the dynamics can only change after the start of the American session.

https://i.ibb.co/gtsV5yM/nzdusd.png

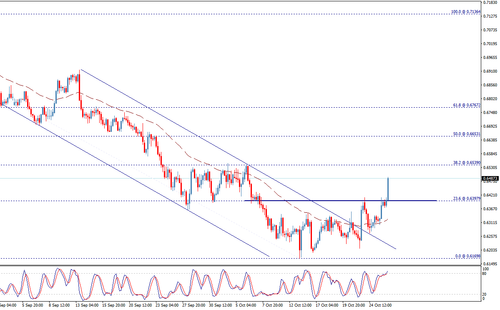
The trading instrument is moving within the global downtrend, slightly moving away from the support line.

Resistance levels: 0.5810, 0.5960 | Support levels: 0.5670, 0.5535

Re: Market Update by Solidecn.com

USDJPY Technical Analysis

The USDJPY pair succeeded to achieve our waited target at 151.3 and approached 152 barrier, but it declined sharply to achieve bearish correction that stopped at 145.45, to rebound bullishly and start covering the losses that it suffered in the previous sessions, at it returns to the main bullish channel to support the continuation of the overall positive scenario.

https://i.ibb.co/h8v1FHh/usdjpy.png

Therefore, we expect to witness positive trades in the upcoming sessions supported by the positive signal provided by stochastic now, noting that breaking 148.10 followed by 147.15 levels will stop the expected rise and press on the price to achieve additional bearish correction.

The expected trading range for today is between 148 support and 150 resistances. The expected trend for today: Bullish.

Re: Market Update by Solidecn.com

https://i.ibb.co/VJcb5ST/800x80.png

Netflix - Growth is possible.

On the daily chart, the wave А of the higher level formed, and a downward correction develops as the wave B, within which the wave (А) of B formed, and an upward correction of the lower level develops as the wave (B) of B. Now, the wave А of (B) is forming, within which a local correction is developing as the second wave ii of A, and the wave ii of A is developing.

If the assumption is correct, the asset will grow to the area of 362.5 – 423.15. In this scenario, critical stop loss level is 211.

https://i.ibb.co/ct7K1KW/netflix.png

Re: Market Update by Solidecn.com

S&P 500 - The US stock market is trying to recover

At the moment, major market participants are publishing corporate financial statements, which are not as positive as experts expected. According to the analytical agency Refinitiv, the profit of 88 companies that reported for the past quarter decreased by an average of 2.6%. The biggest loser on Friday was stocks of Snap Inc., owner of the Snapchat, which shed more than 30.0% amid historically low revenue growth of 6.0% year-on-year. The focus of increased attention of investors is also Twitter Inc., in which the administration of the President of the United States showed interest in terms of initiating possible checks. Telecom operator Verizon Inc., which reported a 24.0% drop in third-quarter net income, is also trading below the market.

https://i.ibb.co/Zd4SV7T/spx.png

The index quotes continued the local corrective trend, forming a Head and Shoulders reversal pattern. Technical indicators keep the sell signal, which has noticeably weakened recently: fast EMAs on the Alligator indicator are approaching the signal line, and the AO oscillator histogram is forming upward bars being in the sale zone.

Support levels: 3665, 3495 | Resistance levels: 3810, 3980

Re: Market Update by Solidecn.com

https://i.ibb.co/VJcb5ST/800x80.png

USDJPY Technical Analysis

The USDJPY pair succeeded to achieve our waited target at 151.3 and approached 152 barrier, but it declined sharply to achieve bearish correction that stopped at 145.45, to rebound bullishly and start covering the losses that it suffered in the previous sessions, at it returns to the main bullish channel to support the continuation of the overall positive scenario.

https://i.ibb.co/h8v1FHh/usdjpy.png

Therefore, we expect to witness positive trades in the upcoming sessions supported by the positive signal provided by stochastic now, noting that breaking 148.10 followed by 147.15 levels will stop the expected rise and press on the price to achieve additional bearish correction.

The expected trading range for today is between 148 support and 150 resistance. The expected trend for today: Bullish.

Re: Market Update by Solidecn.com

https://i.ibb.co/VJcb5ST/800x80.png

EURUSD - A fall is possible.

On the daily chart, the fifth downward wave of the higher level (5) of А forms, within which the wave 5 of (5) forms. Now, the fifth wave of the lower level v of 5 of (5) is developing, within which the wave (i) of v of 5 has formed and a local correction is ending as the wave (ii) of v of 5.

If the assumption is correct, the EURUSD pair will fall to the area of 0.947 – 0.93. In this scenario, critical stop loss level is 0.9997.

https://i.ibb.co/HTyNN2c/eurusd.png

Re: Market Update by Solidecn.com

USDJPY within tight track

The USDJPY pair didn’t show any strong move since yesterday, to fluctuate within tight track, settling above the bullish channel’s support line, thus, no change to the bullish trend scenario that depends on the price stability above 148.5, waiting to get positive motive that assists to push the price to head towards our positive targets that start at 150 and extend to 152.

https://i.ibb.co/ftgK9pW/usdjpy.png

The expected trading range for today is between 148.2 support and 149.9 resistance. The expected trend for today: Bullish.

Re: Market Update by Solidecn.com

https://i.ibb.co/VJcb5ST/800x80.png

GBPUSD - A fall is possible.

On the daily chart, the downward fifth wave of the higher level V of (V) develops, within which the wave (5) of V forms. Now, the third wave of the lower level 3 of (5) has formed, a local correction has ended as the fourth wave 4 of (5), and the development of the wave 5 of (5) has started, within which the wave iii of 5 is forming.

If the assumption is correct, the pair GBPUSD will fall to the area of 1.02 – 1. In this scenario, critical stop loss level is 1.1501.

https://i.ibb.co/F3bdBcz/gbpusd.png

Re: Market Update by Solidecn.com

USDCAD Tests the Support

The USDCAD pair shows negative trades to test the key support 1.3680, as it consolidates above it until now, to keep the bullish trend scenario active for the upcoming period, waiting to head towards 1.3830 initially. Breaching 1.3740 will ease the mission of achieving the expected rise, noting that breaking 1.3680 will stop the positive scenario and put the price under additional negative pressure on the intraday basis.

https://i.ibb.co/qBZtHrt/usdcad.png

The expected trading range for today is between 1.3640 support and 1.3790 resistance. The expected trend for today: Bullish.

Re: Market Update by Solidecn.com

FTSE 100 - Results of the elections in the UK pushed the index up

The day before, Rishi Sunak was appointed the new Prime Minister and head of the Conservative Party with 178 of the 355 members of the Conservative faction in the House of Commons having voted for him. The official managed the British economy during the coronavirus pandemic and analysts believe that he is able to lead the country out of the current crisis. Probably, this news has already been taken into account by the market, since even the negative effect of the publication of a report on business activity, which showed a decrease from 48.4 points to 45.8 points in the Manufacturing sector and from 50 points, to 47.5 points in the Services sector could not put pressure on the dynamics of the pound.

https://i.ibb.co/2hc7fjH/ftse.png

Quotes of the index continue to try to start corrective growth. Technical indicators are holding a sell signal, which has noticeably weakened recently.

Support levels: 6920, 6710 | Resistance levels: 7090, 7270

Re: Market Update by Solidecn.com

ETHUSD - Murrey analysis

Currently, the instrument is close to 1375 (Murrey [2/8]), but further upward dynamics are restrained by the upper border of the downwards channel. If it consolidates above it, the movement can continue to 1450 (Fibonacci correction 50.0%), 1500 (Murrey [ 4/8]) and 1575 (Fibonacci retracement 38.2%). Otherwise, quotes may return to the lower border of the sideways range 1250 (Murrey [0/8]) or to 1187.5 (Murrey [–1/8]) and 1125 (Murrey [–2/8]).

https://i.ibb.co/PMD9pkq/eth.png

Resistance levels: 1375, 1450, 1500, 1575 | Support levels: 1250, 1187.5, 1125

Re: Market Update by Solidecn.com

https://i.ibb.co/VJcb5ST/800x80.png

USDCHF begins with bearish gap

The USDCHF pair opened today’s trading with bearish gap that puts the price under the key support 0.9990, but it begins to cover this gap and attempts to return to the bullish channel again, to keep the chances valid to continue the expected main bullish trend for the upcoming period, which targets 1.0100 followed by 1.0170 levels mainly. Breaching 1 barrier will reinforce the positive overview, while consolidating below 0.999 will put the price under new correctional bearish pressure on the intraday basis.

https://i.ibb.co/qR296yZ/usdchf.png

The expected trading range for today is between 0.9940 support and 1.008 resistance. The expected trend for today: Bullish.

Re: Market Update by Solidecn.com

https://i.ibb.co/VJcb5ST/800x80.png

Gold Technical Analysis

Gold price resumes its negative trading to move away from the EMA50, reinforcing the expectations of continuing the bearish trend in the upcoming sessions, waiting for more decline to visit 1615.00 level that represents our next main target, reminding you that the continuation of the bearish wave depends on the price stability below 1660.

https://i.ibb.co/k1CZB7T/gold.png

The expected trading range for today is between 1625 support and 1665 resistance, and the expected trend for today: Bearish.

Re: Market Update by Solidecn.com

AUDUSD Hits the First Target

The AUDUSD pair managed to touch our first target at 0.6270 and bounced bullishly from there, affected by stochastic positivity, waiting to resume the main bearish wave that its next main target at 0.6170. Holding below 0.6397 represents major condition to continue the expected decline, as breaching it will lead the price to achieve additional bullish correction that its next target might reach 0.6540.

https://i.ibb.co/GxpFw8X/audusd.png

The expected trading range for today is between 0.6250 support and 0.6380 resistance. The expected trend for today: Bearish.

Re: Market Update by Solidecn.com

https://i.ibb.co/VJcb5ST/800x80.png

USDCAD - The pair is in a correction and may grow.

On the daily chart, the upward fifth wave of the higher level 5 develops, within which the wave (1) of 5 formed, the correctional wave (2) of 5 ended, and the wave (3) of 5 forms. Now, the third wave of the lower level 3 of (3) has formed, and a local correction is developing as the fourth wave 4 of (3).

If the assumption is correct, the USDCAD pair will grow to the area of 1.43 – 1.45. In this scenario, critical stop loss level is 1.35.

https://www.linkpicture.com/q/usdcad_2.png

Re: Market Update by Solidecn.com

USDCHF - Growth is possible.

On the daily chart, the first upward wave of the higher level (1) of 3 develops, within which the wave 5 of (1) forms. Now, the third wave of the lower level iii of 5 is developing, within which a local correction is developing as the wave (iv) of iii.

If the assumption is correct, the USDCHF pair will grow to the area of 1.02 – 1.03. In this scenario, critical stop loss level is 0.9908.

https://iili.io/DUggDB.md.png

Re: Market Update by Solidecn.com

AUDUSD Technical Analysis

The AUDUSD pair breached 0.6397 level strongly to rally upwards and confirms heading towards the next correctional level at 0.6540, to support the continuation of the expected bullish trend for today, noting that breaching the mentioned level will extend the bullish wave to reach 0.6650, while the expected rise will remain valid conditioned by the price stability above 0.6397.

https://iili.io/DgL8KB.md.png

The expected trading range for today is between 0.6430 support and 0.6540 resistance. The expected trend for today: Bullish.

Re: Market Update by Solidecn.com

https://i.ibb.co/VJcb5ST/800x80.png

Crude Oil - US inventory growth puts pressure on oil quotes

The long-term trend is downward. The key resistance level is located at 93.5, and the key support is around 76.50. Last week, buyers unsuccessfully tried to break out the 86.5 mark, therefore, we can assume a decline in prices to the nearest support level of 81.

https://iili.io/DrxaMx.md.png

The mid-term trend remains upward. Last week, market participants tried to break the key trend support in the area of 86.21–85.46. The trading week closed inside the range, which indicates the retention of support. The trend target is the October maximum in the area of target zone 2 (94.27–93.43). Consequently, it will be possible to consider oil purchases when the first signs of an upward movement appear from approximately the current levels.

https://iili.io/DrxYnj.md.png

Resistance levels: 86.5, 89.5, 93.5 | Support levels: 81, 76.5

Re: Market Update by Solidecn.com

Master Card - Growth is possible.

On the daily chart, the third wave of the higher level (3) formed, and a downward correction developed as the fourth wave (4), within which the wave C of (4) formed as a momentum. Now, the development of the fifth wave (5) is starting, within which the first entry wave of the lower level i of 1 of (5) is forming.

If the assumption is correct, the asset will grow to the area of 361.86 – 401. In this scenario, critical stop loss level is 277.

https://iili.io/D43fWB.md.png

Re: Market Update by Solidecn.com

XRPUSD - Technical analysis

The uncertainty of the movement of quotations is associated with the approaching timing of the court decision on the suit of the Securities and Exchange Commission (SEC) against Ripple, as well as the departure of one of its leading specialists, Nik Bougalis, who was previously involved in the software of the XRP Ledger payment system. To continue the decline, the quotes will have to consolidate below 0.4330 (Fibonacci correction 23.6%). In this case, the decline will continue to 0.3906 (Murrey [0/8]) and 0.3570. The zone 0.4883–0.4780 (Murrey [2/8], the middle line of Bollinger Bands) seems to be the key “bullish” region, the breakdown of which will lead to the price exiting the long-term downward channel and give the prospect of further growth to 0.5219 (Fibonacci correction 38.2%) and 0.5371 (Murrey [3/8]).

https://iili.io/D4fMmJ.md.png

Resistance levels: 0.4883, 0.5219, 0.5371 | Support levels: 0.4330, 0.3906, 0.357

Re: Market Update by Solidecn.com

https://i.ibb.co/VJcb5ST/800x80.png

Dow Jones - Correction after the publication of corporate reports

US stock indicators took advantage of the slowdown in the bond market and continue to grow on the back of positive corporate reporting. Now the quotes of the Dow Jones index are being corrected in the area of 31783.

https://iili.io/D6HQhN.md.png

Index quotes continue corrective dynamics, rising in the direction of the global channel resistance line.

Technical indicators are holding a buy signal, which is gradually strengthening: the range of EMA fluctuations on the Alligator indicator expands in the direction of growth, and the histogram of the AO oscillator is forming new ascending bars in the purchase zone.

Support levels: 31150, 29670 | Resistance levels: 32500, 34200

Re: Market Update by Solidecn.com

https://i.ibb.co/VJcb5ST/800x80.png

USDCAD - Bank of Canada decides to keep the rate hike pace

Yesterday, the regulator decided to raise the interest rate by 50.0 basis points, not by 75 points, as most experts predicted, bringing it to 3.75% from 3.25% earlier. In an accompanying statement, officials noted that they expect the country's gross domestic product (GDP) to seriously slowdown from 3.25% to less than 1.00% by early 2023 due to inflation, which, although it fell from 8.1% in the last quarter to 6.9% the basis of this weakening was fuel prices, which fell on the world market. Core inflation, a more accurate indicator of consumer prices, has not eased, and the Bank of Canada expects negative dynamics only in the second half of 2023.

https://i.ibb.co/hWk39QK/usdcad.png

On the daily chart of the asset, the price is trying to consolidate in a downward corrective trend.

Resistance levels: 1.3610, 1.387 | Support levels: 1.3500, 1.325

Re: Market Update by Solidecn.com

https://i.ibb.co/VJcb5ST/800x80.png

AUDUSD - The pair is in a correction, a fall is possible.

On the daily chart, the first wave of the higher level (1) developed, and a downward correction forms as the second wave (2), within which the wave C of (2) forms. Now, the third wave of the lower level iii of C is forming, the wave (iii) of iii has formed, and a local correction is ending as the wave (iv) of iii.

If the assumption is correct, the AUDUSD pair will fall to the area of 0.6091 – 0.59. In this scenario, critical stop loss level is 0.6682.

https://i.ibb.co/gJ7Y7sC/audusd.png

Re: Market Update by Solidecn.com

NZDUSD - The pair may grow.

On the daily chart, the upward wave of the higher level (А) formed, and a downward correction ended as the wave (B), within which the wave C of (B) formed. Now, the development of the wave (C) has started, and the entry first wave of the lower level i of 1 of (C) has formed.

If the assumption is correct, the NZDUSD pair will grow to the area of 0.6166 – 0.6465. In this scenario, critical stop loss level is 0.5520.

https://i.ibb.co/GRHnj6s/nzdusd.png

Re: Market Update by Solidecn.com

https://i.ibb.co/VJcb5ST/800x80.png

Gold price builds support base

Gold price settles above 1660 level and attempts to gain the positive momentum on the intraday time frames, while the EMA50 continues to support the price from below.

https://i.ibb.co/5sPNH2z/gold-m.png

Therefore, the bullish trend scenario will remain valid and active for the upcoming period, affected by the previously completed inverted head and shoulders’ pattern, waiting to visit 1686.40 level as a next main target, reminding you that the continuation of the bullish wave depends on the price stability above 1660.

The expected trading range for today is between 1650 support and 1686 resistance, and the expected trend for today: Bullish.

Posts: 426 to 450 of 1,773

Pages Previous 1 16 17 18 19 20 71 Next

You must login or register to post a reply

Forex Software → Market Analysis → Market Update by Solidecn.com

Similar topics in this forum