Re: Technical Analysis by FXOpen
EUR/USD Is Showing Bullish Signs, USD/JPY Could Resume Decline
EUR/USD gained bullish momentum above the 1.2000 and 1.2080 resistance levels. USD/JPY is currently recovering, but it might decline again if it fails to clear 104.30.
Important Takeaways for EUR/USD and USD/JPY
The Euro started a strong upward move above the 1.2000 and 1.2100 levels.
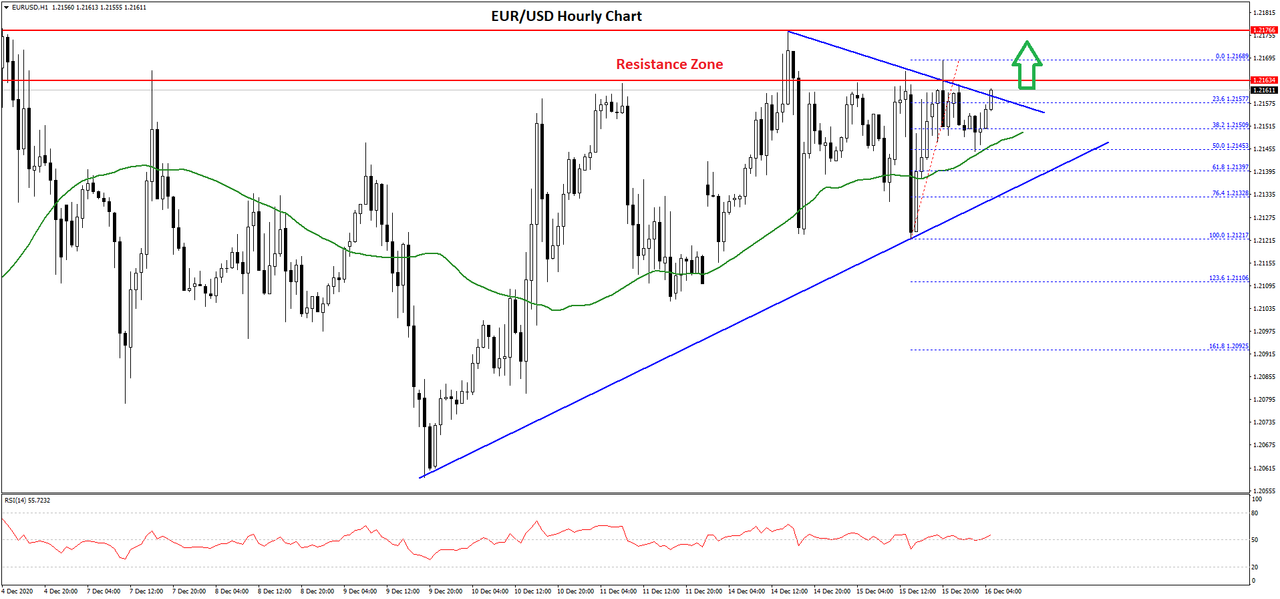
There is a major contracting triangle forming with resistance near 1.2120 on the hourly chart of EUR/USD.
USD/JPY is correcting higher and trading above the 104.00 support level.
There is a major bullish trend line forming with support near 104.10 on the hourly chart.
EUR/USD Technical Analysis
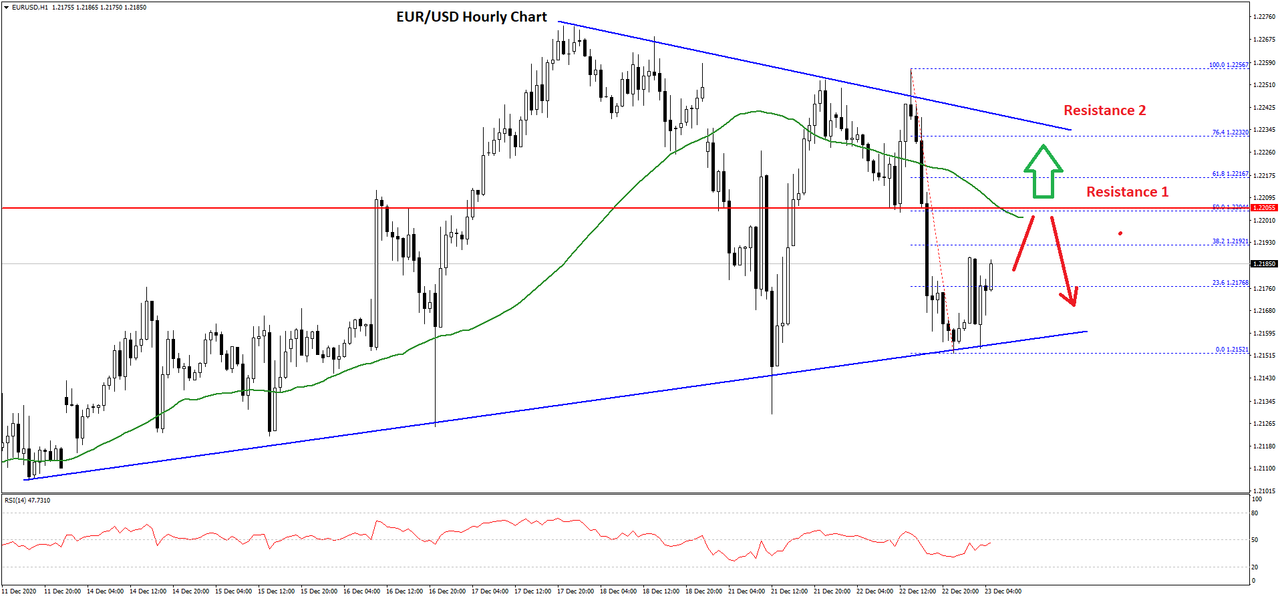
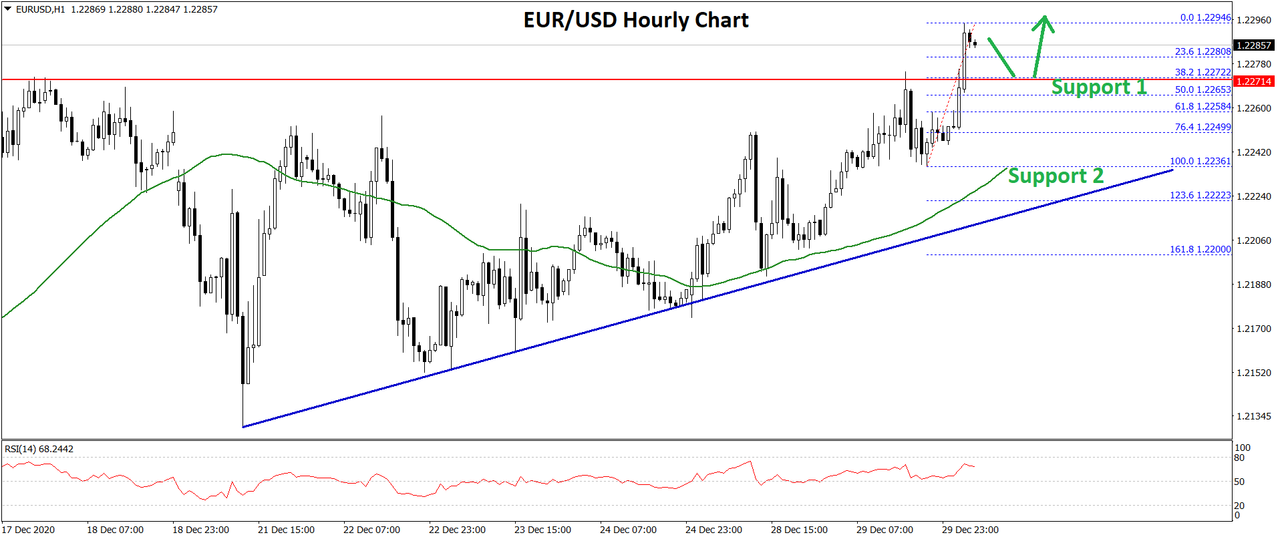
This past week, the Euro started a strong upward move above the 1.2000 resistance against the US Dollar. The EUR/USD pair broke many hurdles near 1.2050 and 1.2080 to move into a positive zone.
The pair even broke the 1.2150 resistance and settled above the 50 hourly simple moving average. It traded as high as 1.2177 on FXOpen before starting a downside correction. There was a break below the 1.2100 level, but the pair remained well bid near the 1.2080 zone.
The recent low was formed near 1.2095 and the pair is currently rising. There was a break above the 1.2110 resistance levels. The pair also climbed above the 23.6% Fib retracement level of the recent decline from the 1.2166 high to 1.2095 low.
There is a major contracting triangle forming with resistance near 1.2120 on the hourly chart of EUR/USD. The pair is currently attempting upside above 1.2120.
The next key resistance is near the 1.2130 level. It is close to the 50% Fib retracement level of the recent decline from the 1.2166 high to 1.2095 low. A clear break above 1.2125 and 1.2130 could open the doors for more gains. The next major resistance is near the 1.2170 and 1.2180 levels.
Conversely, the pair could start a fresh decline below the 1.2100 support. The main support is near the 1.2080 zone, below which the EUR/USD pair could slide towards the 1.2025 and 1.2000 support levels in the near term.
USD/JPY Technical Analysis
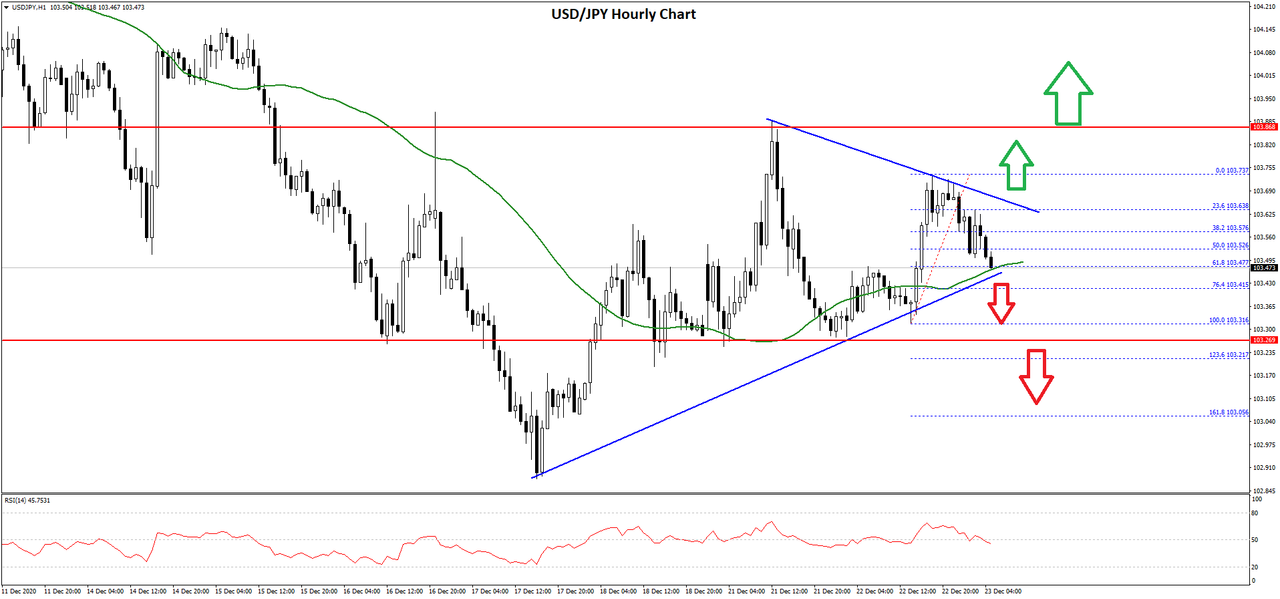
The US Dollar faced a strong resistance near the 104.30 and it started a fresh decline against the Japanese Yen. The USD/JPY pair broke the 104.00 support level, but dips were limited.
A low was formed near 103.92 and the pair started a decent recovery wave. There was a break above the 104.05 and 104.10 levels. The pair climbed above the 50% Fib retracement level of the downward move from the 104.31 high to 103.92 low.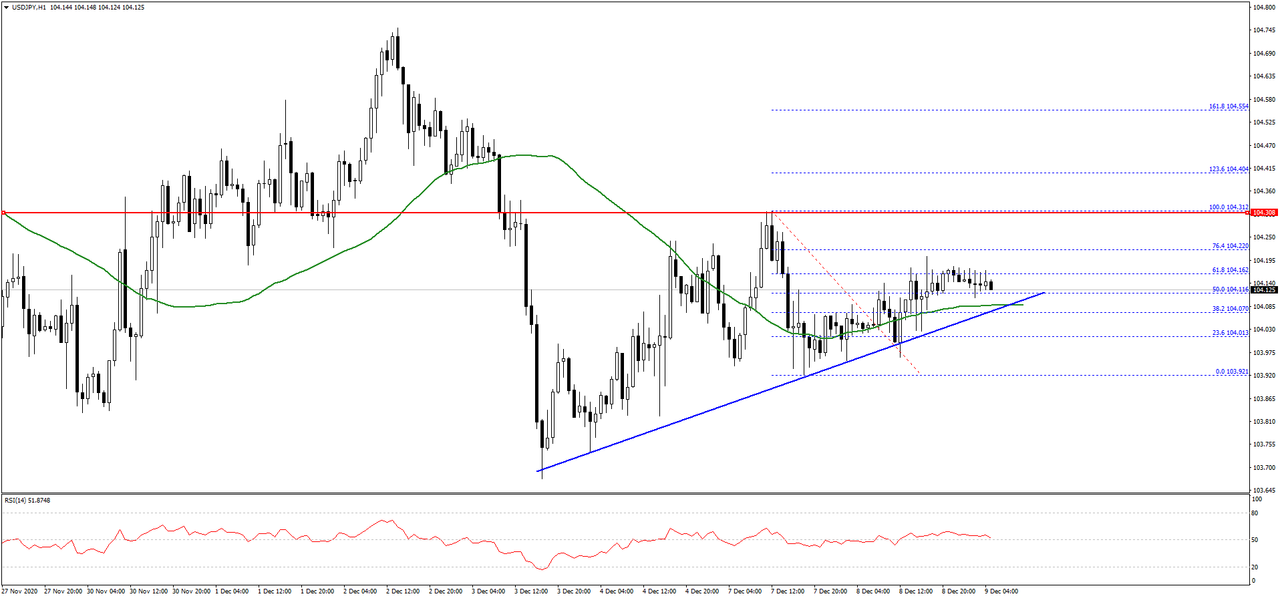
The pair is now trading above the 104.10 level and the 50 hourly simple moving average. An initial resistance is near the 104.16 level. It is close to the 61.8% Fib retracement level of the downward move from the 104.31 high to 103.92 low.
The first major resistance is near the 104.30 level. A clear break above the 104.30 zone is needed to start a steady rise towards the 104.55 and 104.80 levels.
On the downside, the 104.00 level is a strong support. There is also a major bullish trend line forming with support near 104.10 on the hourly chart. If there is a downside break below the trend line support, the pair could dive towards the 103.80 level.
Any further losses may lead the USD/JPY pair towards the 103.50 support zone. The next major support is near the 103.00 level.