forex software

Create and Test Forex Strategies

forex software

Skip to forum content

Forex Software

Create and Test Forex Strategies

Forex Software

You are not logged in. Please login or register.


(Page 16 of 72)

Forex Software → Market Analysis → Technical Analysis by FXOpen

Pages Previous 1 14 15 16 17 18 72 Next

You must login or register to post a reply

RSS topic feed

Posts: 376 to 400 of 1,778

Re: Technical Analysis by FXOpen

Crypto investors are looking for reasons to be optimistic

https://i.postimg.cc/Kv5kysfy/cryptos.jpg

The market has entered a consolidation zone after the anomalous activity of May 19, with fluctuations framed by a narrowing triangle formation. Currently, no significant news reports are affecting the market, and the volumes are fading. This situation is reminiscent of the calm before the storm. What will the storm be like and when will it happen?

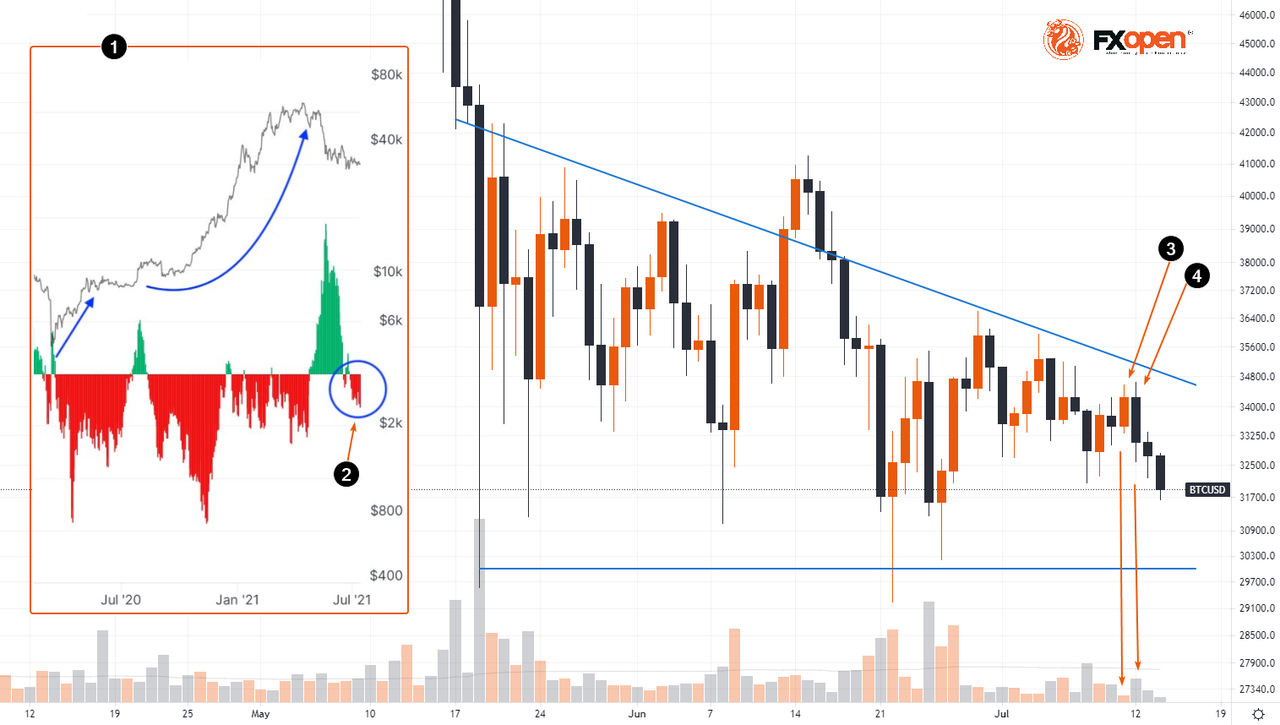
Optimists are looking for arguments that would signify a resuming growth. Analysts point to the outflow of bitcoins from cryptocurrency exchanges (see fig. 2), as evidenced by data (see fig. 1) collected by the Glassnode agency. Blue arrows on the chart indicate that previous outflows occurred against the backdrop of rising quotes. Therefore, the current outflow, according to analysts, could be a bullish harbinger.
https://i.postimg.cc/28YbMf4w/btcusd.png

But digging deeper, we will find out that this was not always the case. A similar outflow occurred during the lull in the first half of November 2018. And in the second half, a bearish storm occurred, and BTCUSD collapsed from 6400 to 3200.

Volume analysis does give cause for concern. On July 11, there was a growth attempt (see fig. 3), but the volumes were low, which indicates a possible shortage of buyers. The next day, July 12, confirms the weakness of demand, as the price decreased on growing volumes, which can be interpreted as active selling pressure. It seems that negative sentiment prevails in the market, as participants are actively selling the coin instead of buying. If so, then the price of 33,500 is too high for BTC.

In such conditions, the fate of a psychological support level of 30k causes more and more concerns.

FXOpen Blog

Re: Technical Analysis by FXOpen

LTC and EOS – Upside expected but could be correctional

https://i.postimg.cc/T1Y0kz0Y/ltc-1.jpg

LTC/USD

The price of Litecoin was on the rise from yesterday and came up by 6% from its low of  $124.3 to $131.8 at its highest point today. We have seen a minor pullback to $127.6 and currently it started moving to the upside again.

https://i.postimg.cc/j2gXBM36/ltcusd-1h-1.png

On the hourly chart, you can see that yesterday’s low was the third lower low from the 29th of Jun. This could have marked the completion of the corrective ABC structure after a five-wave impulse from the 22nd of Jun. If this is true then the price is now set to continue moving to the upside in an impulsive manner.

Another possibility could be that the price made a three-wave increase from the 22nd till the 29th in which case we have seen a corrective ABCDE after, but in both cases, the price would be expected to continue moving higher. Either as the continuation of the corrective WXY of the higher degree in a negative scenario or the 3rd wave from the five-wave impulse in a positive one.

The pullback seen from yesterday is most likely the 2nd sub-wave of starting move to the upside so shortly a breakout would be expected from the descending resistance level and a higher high compared to yesterday’s one. Moving forward we are going to see from the price action which scenario is going to get validated.

Read Full on FXOpen Company Blog...

Re: Technical Analysis by FXOpen

Gold Price Could Extend Gains While Crude Oil Price Corrects Lower

https://i.postimg.cc/kGvQXPst/gold-price.jpg

Gold price started a decent recovery wave above the $1,820 resistance. Crude oil price is declining and it might even break the $70.00 support zone.

Important Takeaways for Gold and Oil

  • Gold price started a fresh recovery wave after forming a base above $1,790 against the US Dollar.

  • There is a key bullish trend line forming with support near $1,825 on the hourly chart of gold.

  • Crude oil price failed to settle above $75.000 and it started a fresh decline.

  • There was a break below a major bullish trend line with support near $74.55 on the hourly chart of XTI/USD.

Gold Price Technical Analysis

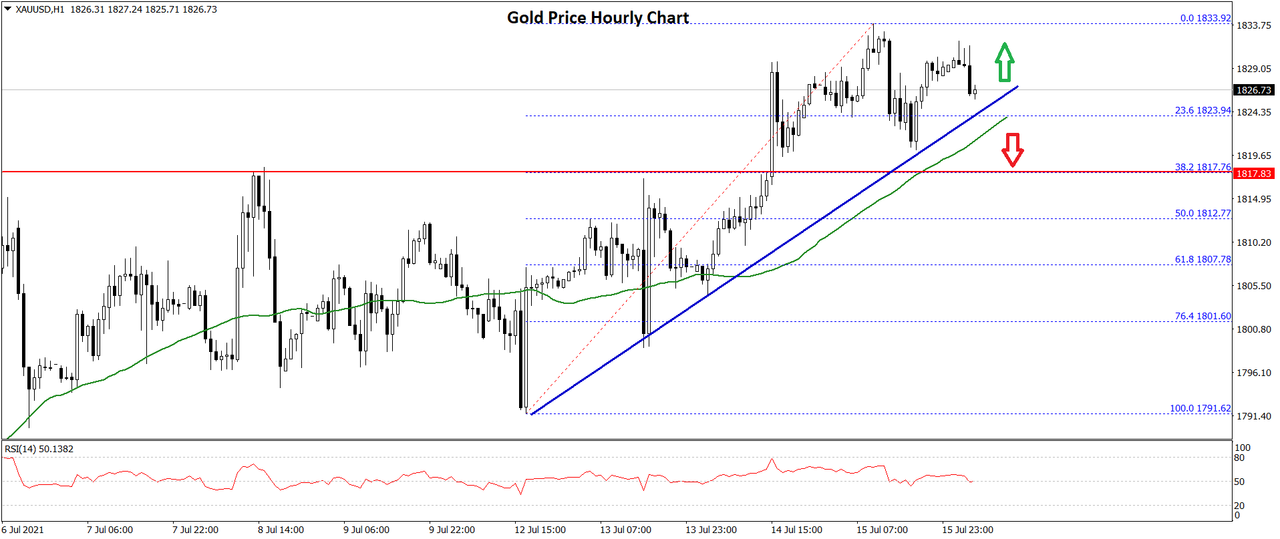
This week, gold price formed a decent support base above the $1,790 zone against the US Dollar. The price started a fresh upward move and it surpassed the $1,800 resistance zone.

The price even settled above the $1,810 level and the 50 hourly simple moving average. The price even broke the $1,820 resistance and it traded as high as $1,833 on FXOpen. Recently, there was a minor downside correction below the $1,830 level.

https://i.postimg.cc/7P3MNS4Y/gold-price-chart-1.png

The price even traded below the 23.6% Fib retracement level of the upward move from the $1,791 low to $1,833 high. However, the bulls are protecting the $1,820 support.

There is also a key bullish trend line forming with support near $1,825 on the hourly chart of gold. The 50 hourly SMA is also near the trend line. If there is a downside break, the price could test the $1,810 support.

An intermediate support could be the 50% Fib retracement level of the upward move from the $1,791 low to $1,833 high at $1,812. An immediate resistance on the upside is near the $1,832 level.

The first major resistance is near the $1,835 level. If the price breaks the $1,835 level, it could accelerate higher. In the stated case, the price could rise towards the $1,850 zone.

Read Full on FXOpen Company Blog...

Re: Technical Analysis by FXOpen

GBP/USD and EUR/GBP: British Pound Remains At Risk

https://i.postimg.cc/VkyL3Fvx/gbp-usd.jpg

GBP/USD started a steady decline below the 1.3900 zone. EUR/GBP is rising and it might continue to rise if it breaks the 0.8600 resistance zone.

Important Takeaways for GBP/USD and EUR/GBP

  • The British Pound failed to recover above the key 1.3900 resistance zone.

  • There is a major bearish trend line forming with resistance near 1.3855 on the hourly chart of GBP/USD.

  • EUR/GBP started a fresh increase after it found a strong support near the 0.8500 zone.

  • There was a break above a major bearish trend line with resistance near 0.8550 on the hourly chart.

GBP/USD Technical Analysis

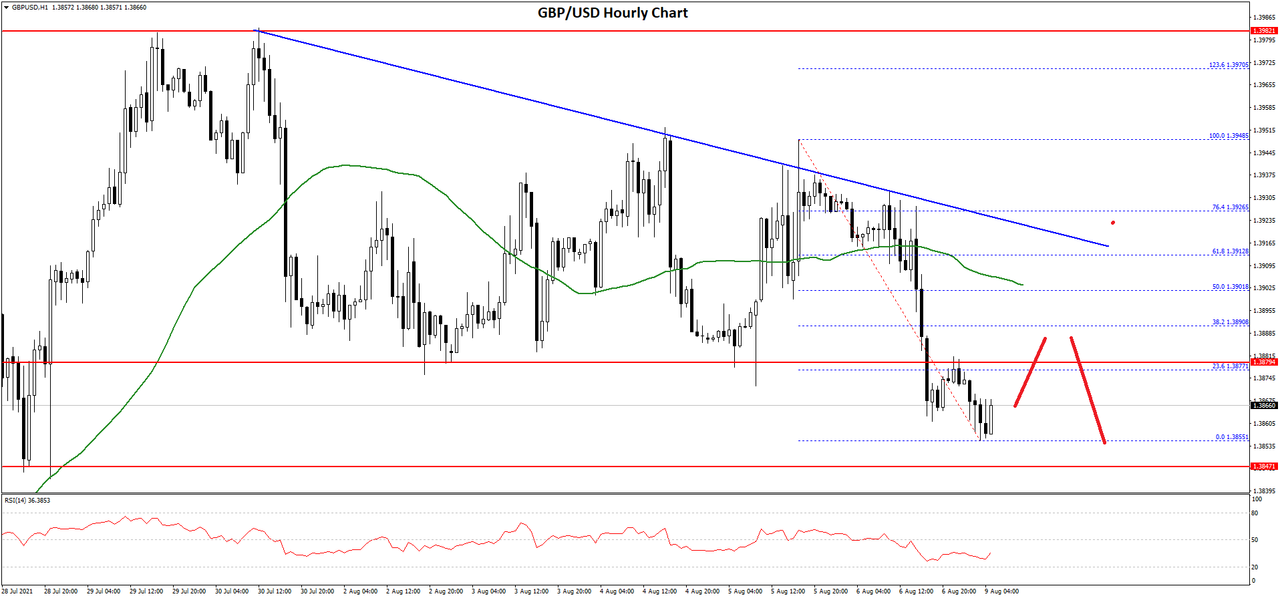
The British Pound made many attempts to clear the 1.3900 and 1.3910 resistance levels against the US Dollar. The GBP/USD pair started a major decline and it settled below the 1.3850 pivot level.

The pair even broke the 1.3800 support level and it settled below the 50 hourly simple moving average. The recent low was formed near 1.3746 and the pair is now showing a lot of bearish signs.

https://i.postimg.cc/T3rYGWWp/gbpusd-chart-1.png

An immediate resistance on the upside is near the 1.3775 level. The 23.6% Fib retracement level of the downward move from the 1.3861 swing high to 1.3746 low. The first major resistance is now forming near the 1.3800 zone.

The 50% Fib retracement level of the downward move from the 1.3861 swing high to 1.3746 low is also near the 1.3800 zone. The next major resistance near the 1.3820 level and the 50 hourly simple moving average.

There is also a major bearish trend line forming with resistance near 1.3855 on the hourly chart of GBP/USD. To move into a positive zone, the pair must clear the bearish trend line and then 1.3900.

An immediate support on the downside is near the 1.3745 level. A downside break below the 1.3745 level might call for a fresh decline towards the 1.3700 level. Any more losses could lead the pair towards the 1.3650 level in the near term.

Read Full on FXOpen Company Blog...

Re: Technical Analysis by FXOpen

Rising US Inflation Supports the Bullish Case for Gold

https://i.postimg.cc/yY2JR67j/gold.jpg

Last week, two events dominated the price action in financial markets – the US inflation and Fed Chair Powell’s semiannual testimony. Both brought a new perspective to market participants, but summer trading conditions eventually prevailed.

Namely, despite the rising inflation environment and the market-moving statements from the Fed Chair, the market did not move much. It is typical for the market to consolidate during the summer months, and so July and August are known as months with declining volatility.

https://i.postimg.cc/T3mKJ8w6/us-10-year-treasury-yields.jpg

Rising Inflation – Bullish for Gold and Equities

The US inflation data for the month of June showed inflation surging. It reached 5.4% YoY, much higher than expectations. In fact, inflation in the United States did not reach such levels for at least three decades.
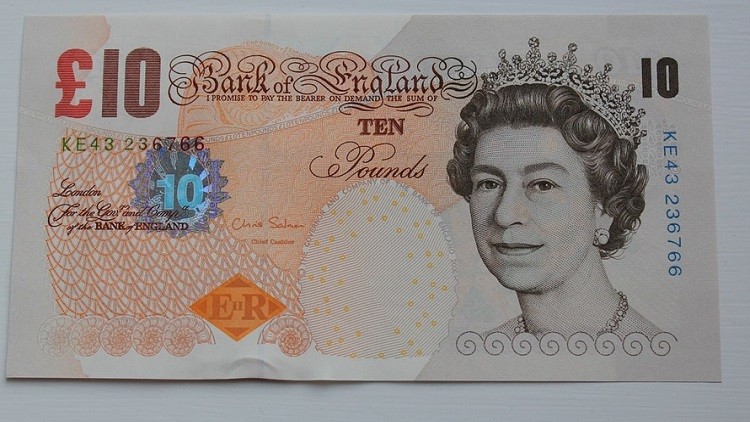
Traders should remember that last year, in August, the Fed shifted its price stability mandate. It moved from targeting 2% to averaging 2% inflation. Therefore, higher inflation above 2% is not quite a concern for the Fed because we do not know what it is the period used for averaging.

In other words, if the Fed considers the last 12 months or more, then inflation is likely to be below the 2% AIT (Average Inflation Targeting) target. Because of that, the semiannual testimony that the Fed Chair held last week was critical for understanding how the Fed views inflation.

Fed Powell admitted that the central bank is surprised by how hot inflation is running, but he reiterated the fact that the Fed views it as transitory. We will find out further down the road if that is true or not.

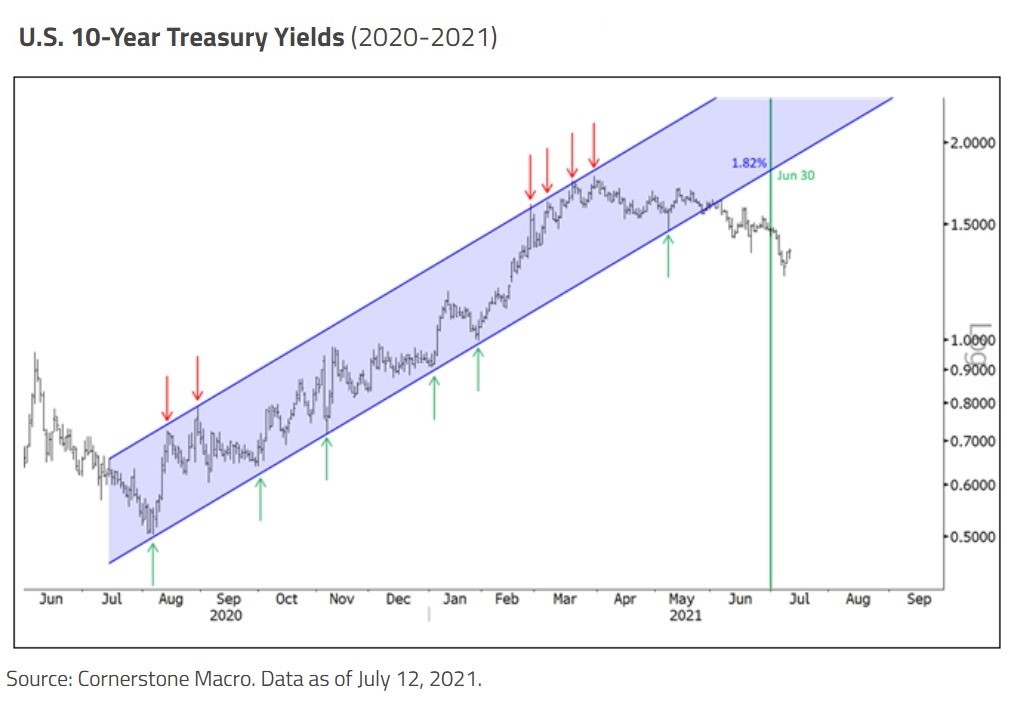
In the meantime, with inflation at 5.4% and the US 10-Year Treasury yield at 1.3%, we talk about a negative 4.1% real yields. Therefore, investors are forced to look for alternatives.

One is gold. Commodities have typically served against higher inflation and this time should be no different. The price of gold, therefore, traded with a bid tone last week, rising from below $1,800 at the time inflation data was released, to over $1,830 before giving back some gains.

Another is the stock market. The US equities have outperformed their peers and keep trading close to their highs. The earnings season started strong, with financial services corporations posting strong earnings for the second quarter. If the trend continues, funds will keep pouring into the stock market.

All in all, rising inflation bodes well for gold and equities. The next thing to monitor is the tapering of the asset purchases from the Fed. It may be announced as soon as the Jackson Hole Symposium in August, if inflation keeps rising.

FXOpen Blog

Re: Technical Analysis by FXOpen

BTC and XRP – Once again moving to the downside

https://i.postimg.cc/Z5k2xj2L/btc.jpg

BTC/USD

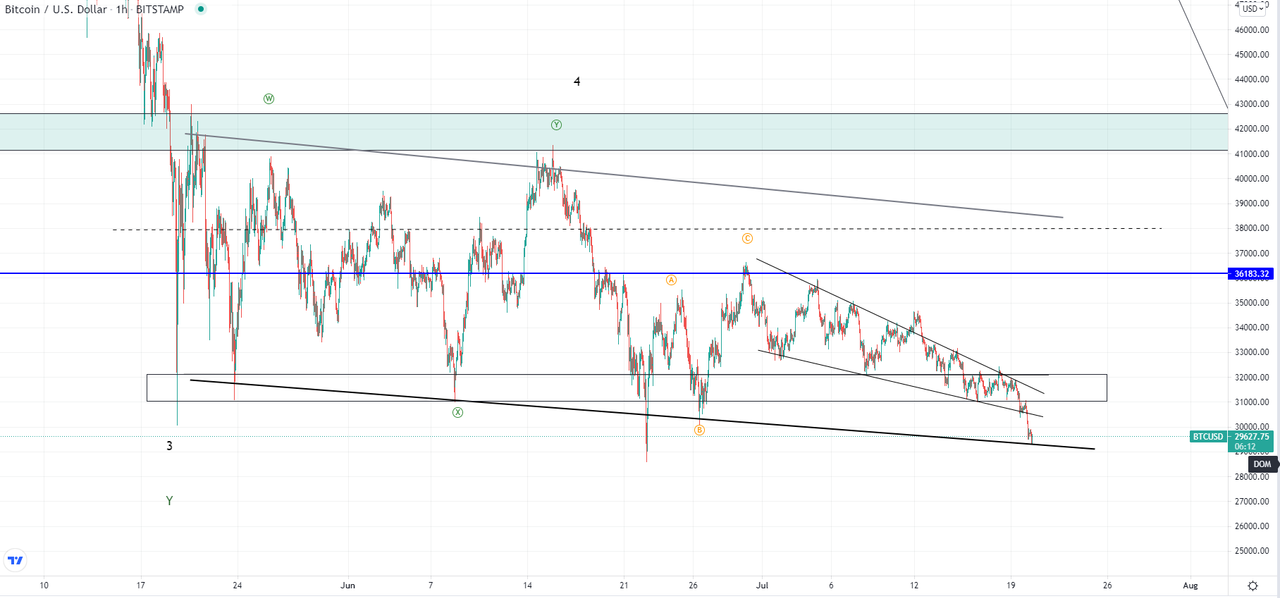
The price of Bitcoin has been falling downwards and made a decrease of 9.14% from Sunday’s high of $32,289 to its lowest point today at $29,336. It has broken the significant horizontal support zone and is currently interacting with the descending support level from the channel in which it was since the ending days of May.

https://i.postimg.cc/jSz9gPrY/btcusd-1h-1.png

On the hourly chart, you can see that this is another downfall back to its lows of the 26th of June and is eyeing out the one on the 22nd. This downward trajectory is the continuation of the descending triangle from the start of July which was broken on the downside today. This area is still considered as support so we might see a bounce for another minor recovery but the picture still looks bearish with the price most likely headed further down in the upcoming period.

If this last descending support breaks the price will move further down and with no significant support close it could continue moving to the $18,000 zone where the next one is. This would be expected in either way but potentially these low levels would be viewed as a good buying opportunity for some, which can lead to a minor recovery first.

Read Full on FXOpen Company Blog...

Re: Technical Analysis by FXOpen

EUR/USD Remains At Risk, USD/JPY Eyes More Upsides

https://i.postimg.cc/9f5nYPXZ/Euro-EURUSD-1.jpg

EUR/USD started a major decline and it traded below 1.1800. USD/JPY is attempting an upside break above the 110.00 resistance zone.

Important Takeaways for EUR/USD and USD/JPY

  • The Euro is facing an increase in selling pressure below the 1.1800 level.

  • There is a major bearish trend line forming with resistance near 1.1800 on the hourly chart of EUR/USD.

  • USD/JPY started a fresh increase after it found support near the 109.10 zone.

  • There is a key bearish trend line forming with resistance near 110.00 on the hourly chart.

EUR/USD Technical Analysis

After a close below 1.1850, the Euro started a major decline against the US Dollar. The EUR/USD pair gained bearish momentum and it broke the 1.1820 support zone.

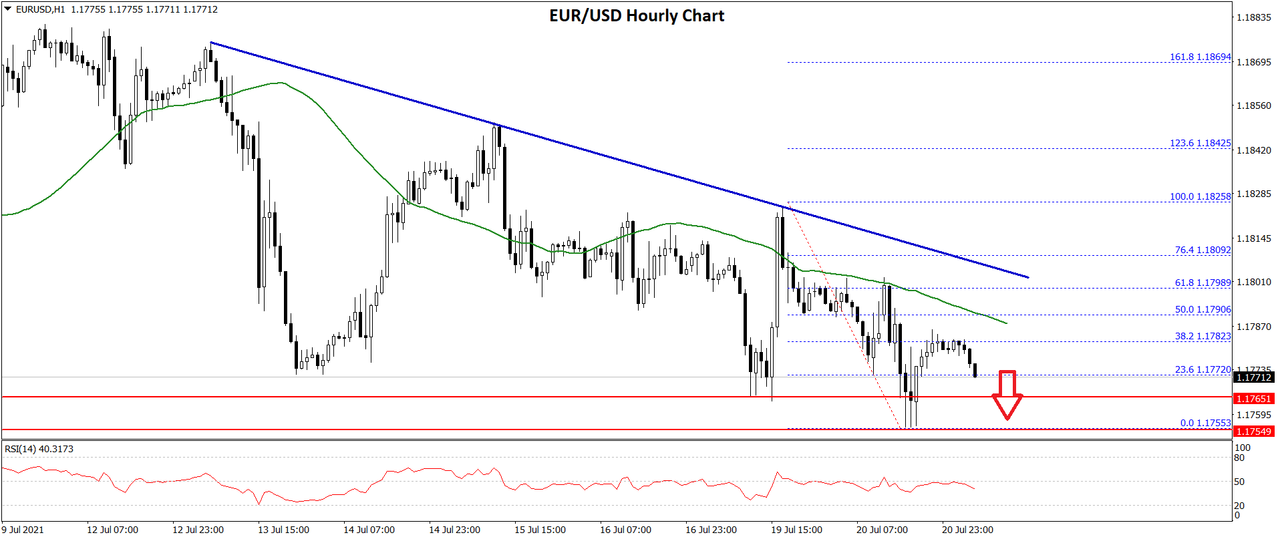
The pair settled below the 1.1800 level and the 50 hourly simple moving average. It traded as low as 1.1755 on FXOpen and the pair is still showing a lot of bearish signs. Recently, there was a minor upside correction above 1.1770.

https://i.postimg.cc/0NYHW6r3/eurusd-chart-2.png

The pair surpassed the 23.6% Fib retracement level of the recent decline from the 1.1825 high to 1.1755 low. It is now facing resistance near the 1.1780 level.

The first key resistance is 1.1790 zone and the 50 hourly simple moving average. It is close to the 50% Fib retracement level of the recent decline from the 1.1825 high to 1.1755 low. There is also a major bearish trend line forming with resistance near 1.1800 on the hourly chart of EUR/USD.

A close above 1.1780 and 1.1800 could open the doors for a steady increase. If not, the pair might continue to move down below 1.1765. An intermediate support is near the 1.1755 level.

The next major support is near the 1.1750 level, below which the pair could drop towards the 1.1700 support in the near term.

Read Full on FXOpen Company Blog...

Re: Technical Analysis by FXOpen

LTC and EOS – Higher high expected before the completion of this rise

https://i.postimg.cc/7ZYR1dr2/ltc.jpg

LTC/USD

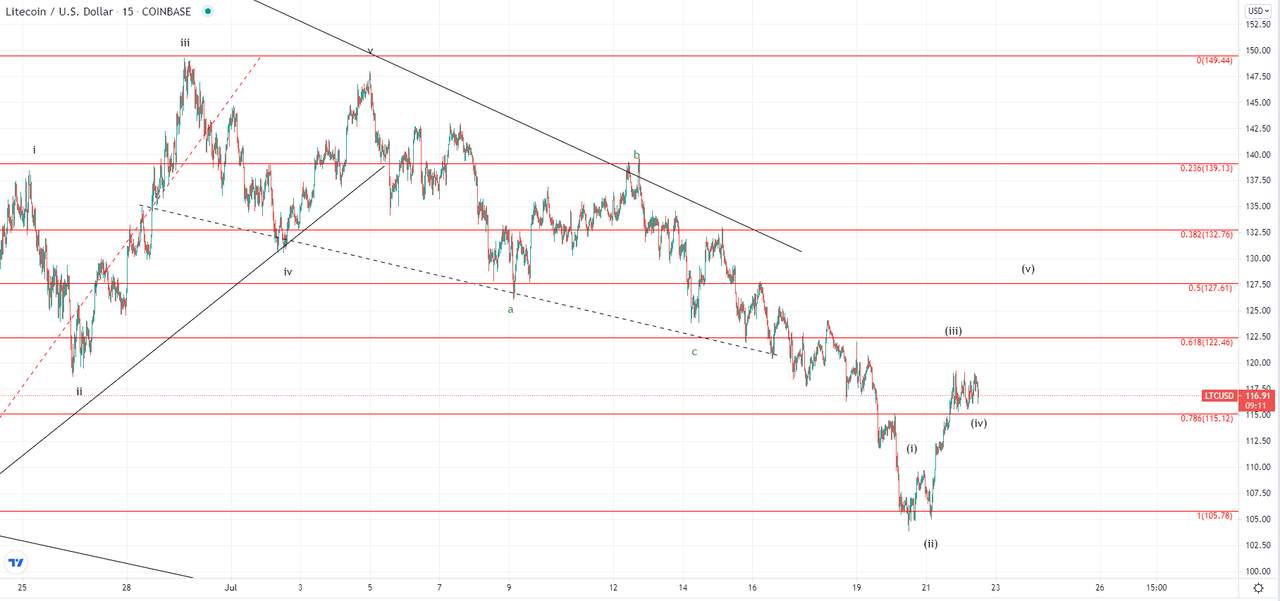
The price of Litecoin has been on the rise from Tuesday’s low of $104 and made an increase of 13.86% as it came up to $118.8 today. Since then we have seen some sideways movement but the price is in an upward trajectory overall.

https://i.postimg.cc/fR2r8CMg/ltcusd-1h-2.png

Looking at the hourly chart, you can see that this increase is counted as the starting impulse from the new count which is why now a higher high would be expected. The sideways movement we’ve seen is in that case the 4th wave and is likely going to end as a flat correction, establishing support above the 0.786 Fib level.

If this is true, then the price is now set to continue moving to the upside for a higher high which would be the end of this first impulsive move after which a retracement would be expected of the same degree. But the price would then be expected to continue moving upward for at least one more wave if this is an ABC to the upside. If this is the 1st sub-wave of the higher degree impulsive move then we are to see even higher levels of the price of Litecoin in the upcoming period, potentially above the $150.

Read Full on FXOpen Company Blog...

Re: Technical Analysis by FXOpen

GBP/USD and GBP/JPY: British Pound Could Gain Strength

https://i.postimg.cc/PxVDBKHm/gbp-1.jpg

GBP/USD started a fresh increase after a drop to 1.3580. Similarly, GBP/JPY started a decent increase and it broke the 151.00 resistance zone.

Important Takeaways for GBP/USD and GBP/JPY

  • The British Pound traded as low as 1.3571 before climbing higher against the US Dollar.

  • There was a break above a major bearish trend line with resistance near 1.3700 on the hourly chart of GBP/USD.

  • GBP/JPY also climbed higher above the 150.00 and 151.00 resistance levels.

  • There was a break above a key bearish trend line with resistance near 150.15 on the hourly chart.

GBP/USD Technical Analysis

This past week, there was a strong decline in the British Pound below the 1.3800 level against the US Dollar. The GBP/USD pair even broke the 1.3700 and 1.3650 support levels.

It traded as low as 1.3571 on FXOpen before it started a fresh increase. There was a steady upward move above the 1.3650 resistance level. The price surpassed the 1.3680 resistance level and the 50 hourly simple moving average.

https://i.postimg.cc/sxth2Xvx/gbpusd-chart-2.png

There was also a break above a major bearish trend line with resistance near 1.3700 on the hourly chart of GBP/USD. The pair is now trading nicely above the 1.3750 level.

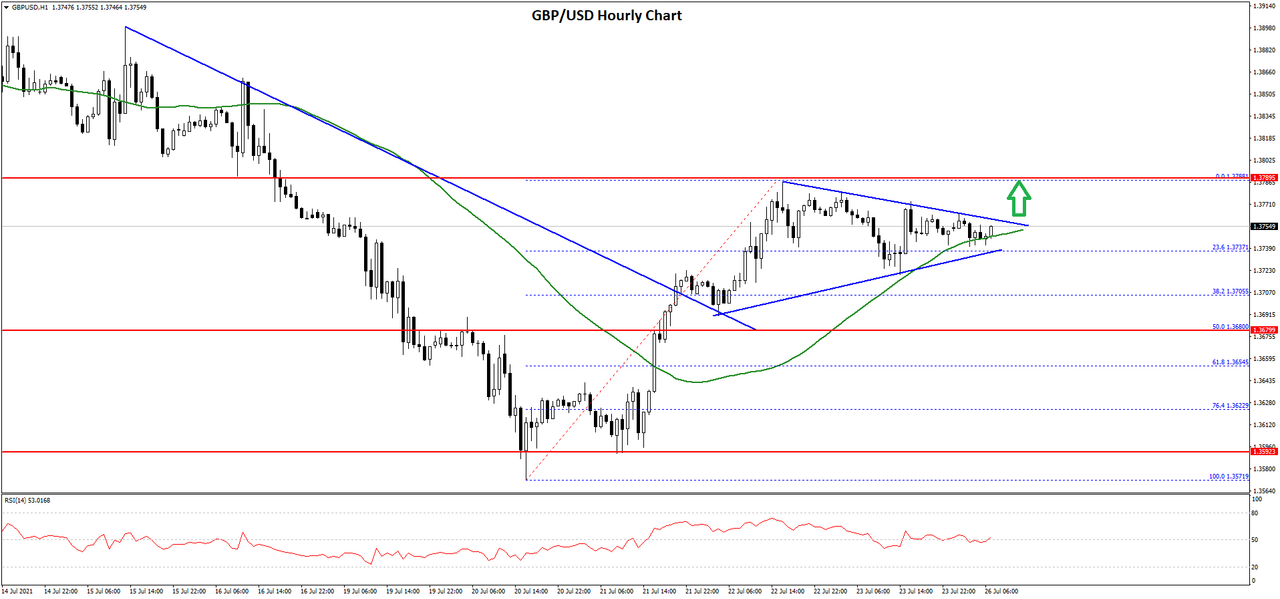
It traded as high as 1.3798 before correcting lower. There was a break below the 1.3760 level. The pair tested the 23.6% Fib retracement level of the recent increase from the 1.3571 low to 1.3798 high. It is now trading inside a contracting triangle with resistance near 1.3760.

A clear break above the triangle resistance could set the pace for a larger increase above 1.3780. The next key resistance is near 1.3800, above which the pair could rise towards the 1.3880 level.

On the downside, an initial support is near the 1.3735 level and the 50 hourly SMA. If there is a break below the 1.3735 support, the pair could test the 1.3700 support. If there are additional losses, the pair could decline towards the 1.3650 level.

Read Full on FXOpen Company Blog...

Re: Technical Analysis by FXOpen

Crucial Week Ahead for USD Traders

https://i.postimg.cc/jqzVfnRL/usd.jpg

The week ahead is decisive for USD traders as three main events will dominate financial markets – the FOMC Meeting, the Advance GDP, and the Core PCE Price Index.

Last Thursday, the European Central Bank revised its forward guidance on interest rates to reflect the new strategy. It delivered a more dovish forward guidance, but the euro did not react. Summer trading conditions, plus the fear of a wrong positioning ahead of the important US data next week, resulted in tight market ranges.

https://i.postimg.cc/SRLwb3gW/11.jpg

FOMC Statement and Press Conference to Move the USD

This week it is all about the FOMC Statement and how the Federal Reserve Chairman Jerome Powell delivers the Fed’s message. He will likely reiterate that the tapering of asset purchases, currently running at $120 billion/month, is still far away into the distant future.

But inflation is pressuring the Fed. The sharp rise in inflation, and specifically in house prices, will likely pressure the Fed into sticking to its tapering prospects.

The market expects that the Fed will announce the tapering of its asset purchases in December this year and to effectively start the process in January 2022. A possible rate hike is seen only in December 2023, and so the short to medium-term focus is on tapering.

This coming Wednesday, the market participants will focus on how the Fed sees the Delta variant and the possible impact on the economy.

US Advance GDP

The US economy is expected to have grown by 8.5% in the second quarter. The report, released Thursday, will show the degree of economic reopening and how the fiscal and monetary stimulus has impacted the recovery.

The Fed will likely choose to stay deliberately behind the curve. Yet, there is room to surprise markets by, say, announcing the tapering decision at the August Jackson Hole meeting. The only way the Fed will do that would be for inflation to overshoot the target even more.

Core PCE Price Index

On Friday, the Core PCE Price Index in the United States is expected at 0.6% MoM, but the bias is that we will see a higher print. Given the sharp rise in inflation lately, which is running at rates not seen since four decades ago, the market expects inflation to keep rising. Supply bottlenecks caused by the economic reopening are the cause for the sharp increase in prices.

All in all, the week ahead is critical for the USD traders. Now that the ECB decision is behind, the focus will be on the USD, seen as having more room to gain against the euro and the Swiss franc.

FXOpen Blog

Re: Technical Analysis by FXOpen

BTC and XRP – Upward move likely ended

https://i.postimg.cc/WzmVF91r/btc.jpg

BTC/USD

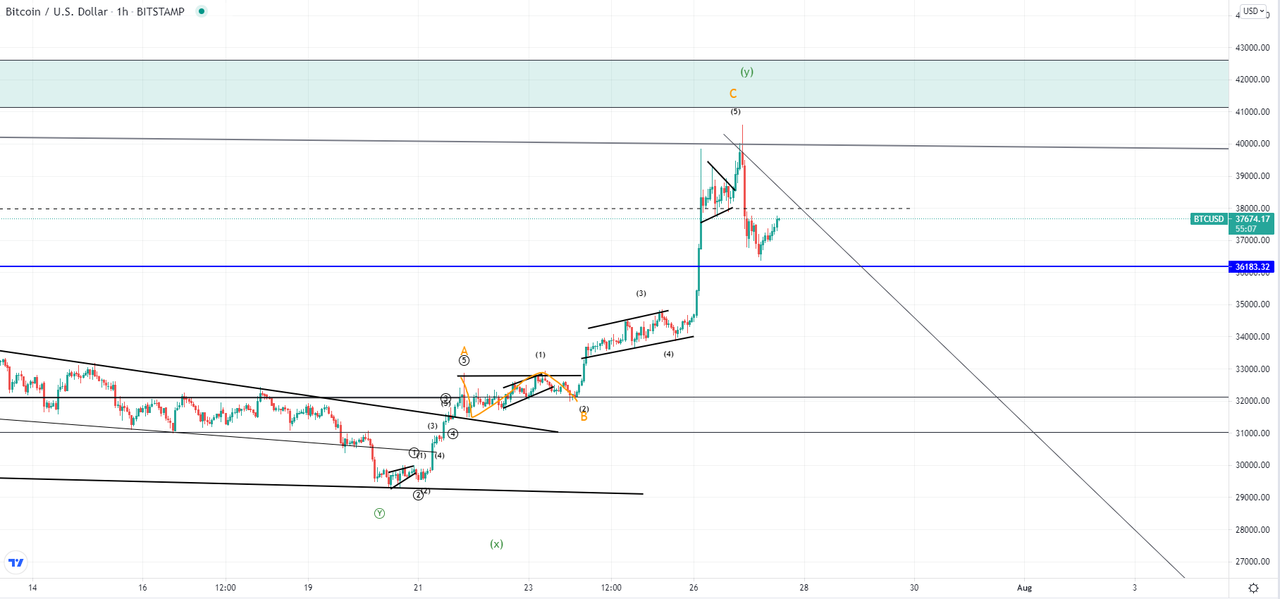
The price of Bitcoin has been on the rise since the 20th of July when it fell down to $29.316 at its lowest point. From there we have seen an increase of 38.7% as it came up to $40,679 at its highest point yesterday. Today the price fell down to $36,500 area and is now moving to the upside again, but the downfall of 10% might be indicative of the completion of the prior upward movement.

https://i.postimg.cc/wxDgGBQv/btcusd-1h-2.png

You can see that the price almost reached its most significant resistance zone at around $41,000 but failed to make interaction. The upward move from the 20th of July was impulsive in sections but the wave structure doesn’t imply a five-wave pattern. Instead, we could be looking at an ABC correction to the upside before the next downward move. The upward movement looks completed either way so now at least a retracement would be expected if not a start of a new downtrend.

Read Full on FXOpen Company Blog...

Re: Technical Analysis by FXOpen

EUR/USD and EUR/JPY: Euro Eyes More Upsides

https://i.postimg.cc/LXrqCjQn/eurusd.jpg

EUR/USD formed a support base above 1.1780 and corrected higher. EUR/JPY is also rising and it could gain pace above the 130.00 resistance.

Important Takeaways for EUR/USD and EUR/JPY

  • The Euro extended its decline towards the 1.1750 level before recovering higher.

  • There was a break above a key contracting triangle with resistance near 1.1805 on the hourly chart.

  • EUR/JPY climbed higher nicely and it even settled above the 129.50 zone.

  • There is a major contracting triangle forming with support near 129.70 on the hourly chart.

EUR/USD Technical Analysis

The Euro extended its decline below 1.1800 against the US Dollar. However, the EUR/USD pair remained well bid above the 1.1750 support zone.

The pair formed a base near 1.1760 and it recently started a decent upward move. It surpassed the 1.1800 resistance zone and the 50 hourly simple moving average. There was also a break above a key contracting triangle with resistance near 1.1805 on the hourly chart.

https://i.postimg.cc/9X7w4NzT/eurusd-chart-3.png

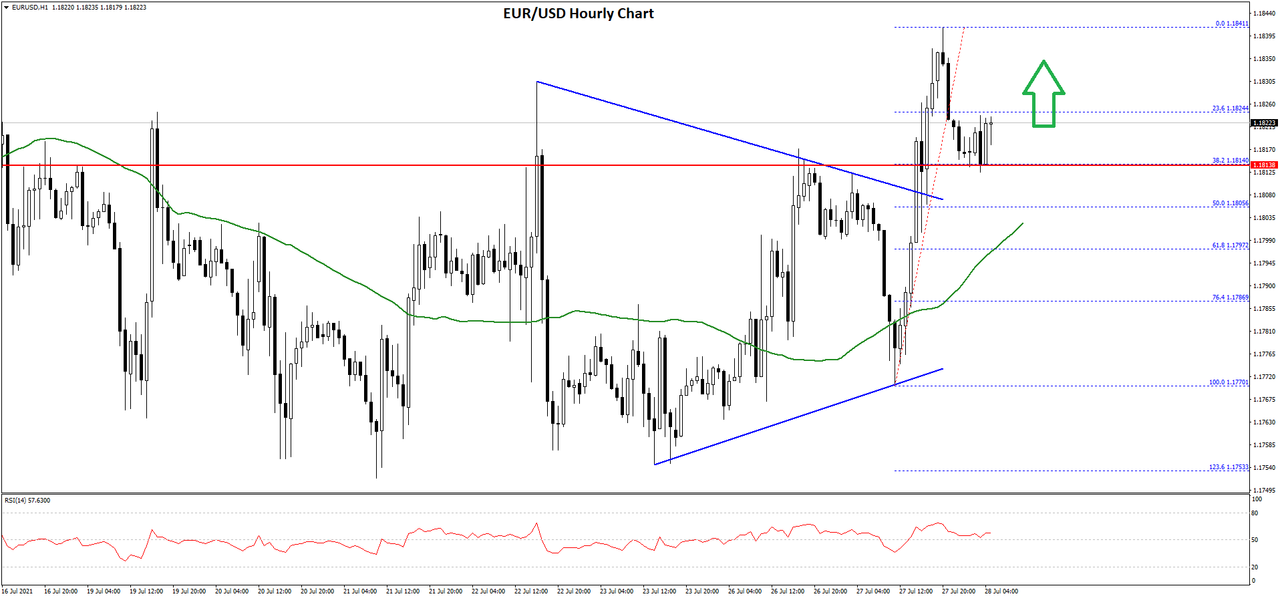
The pair traded as high as 1.1841 on FXOpen and it is now correcting gains. There was a break below the 23.6% Fib retracement level of the recent wave from the 1.1770 swing low to 1.1841 high.

The pair is now finding bids near the 1.1810 support zone. The next key support is near the 1.1805 level. It is near the 50% Fib retracement level of the recent wave from the 1.1770 swing low to 1.1841 high.

Any more losses might call for a move towards the 1.1780 support. Any more losses might lead EUR/USD towards the 1.1750 support zone. On the upside, an initial resistance is near the 1.1830 level. The first major resistance is near the 1.1850 level. Any more gains could set the pace for a move towards the 1.1900 level. The next major resistance is near the 1.1920 level.

Read Full on FXOpen Company Blog...

Re: Technical Analysis by FXOpen

Bitcoin May Reach ATH

https://i.postimg.cc/5NZX6Z77/btc-usd.png

On July 27, Reuters released a rebuttal from an Amazon spokesman regarding the company’s plans to implement Bitcoin.

“Notwithstanding our interest in the space, the speculation that has ensued around our specific plans for cryptocurrencies is not true,” the source said.

On the backdrop of this new turn, the Bitcoin rate fell, but what is important, it didn’t fall lower than the July 26 level, when London’s City AM newspaper cited an unnamed insider saying Amazon had intentions to accept Bitcoin payments until the end of the year.

The fact that the official clarification did not bring the price back to the starting point suggests a bullish market sentiment.

Mike McGlone, Bloomberg’s Intelligence senior commodity strategist, is of the opinion that BTC quotes are more likely to return to the $60,000 mark than fall to $20,000.

https://i.postimg.cc/t4WYP28X/btcusd-1.png

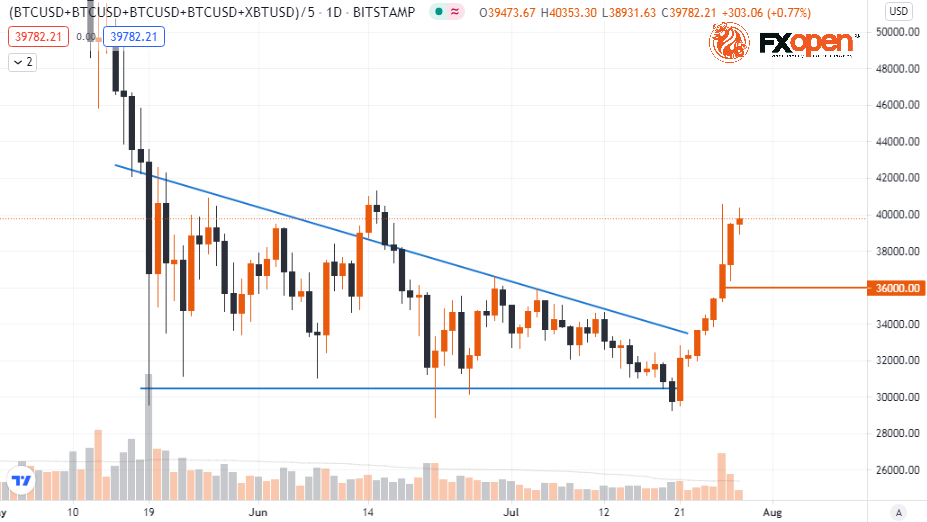
The price of Bitcoin fluctuates around the psychological level of $40k. The level of $36k — the base of the July 26 large-volume candlestick — is important. As long as the bulls keep the price above this level, the situation looks encouraging.

FXOpen Blog

Re: Technical Analysis by FXOpen

LTC and EOS – Corrective movement seen

https://i.postimg.cc/QxXBGrJZ/ltc.jpg

LTC/USD

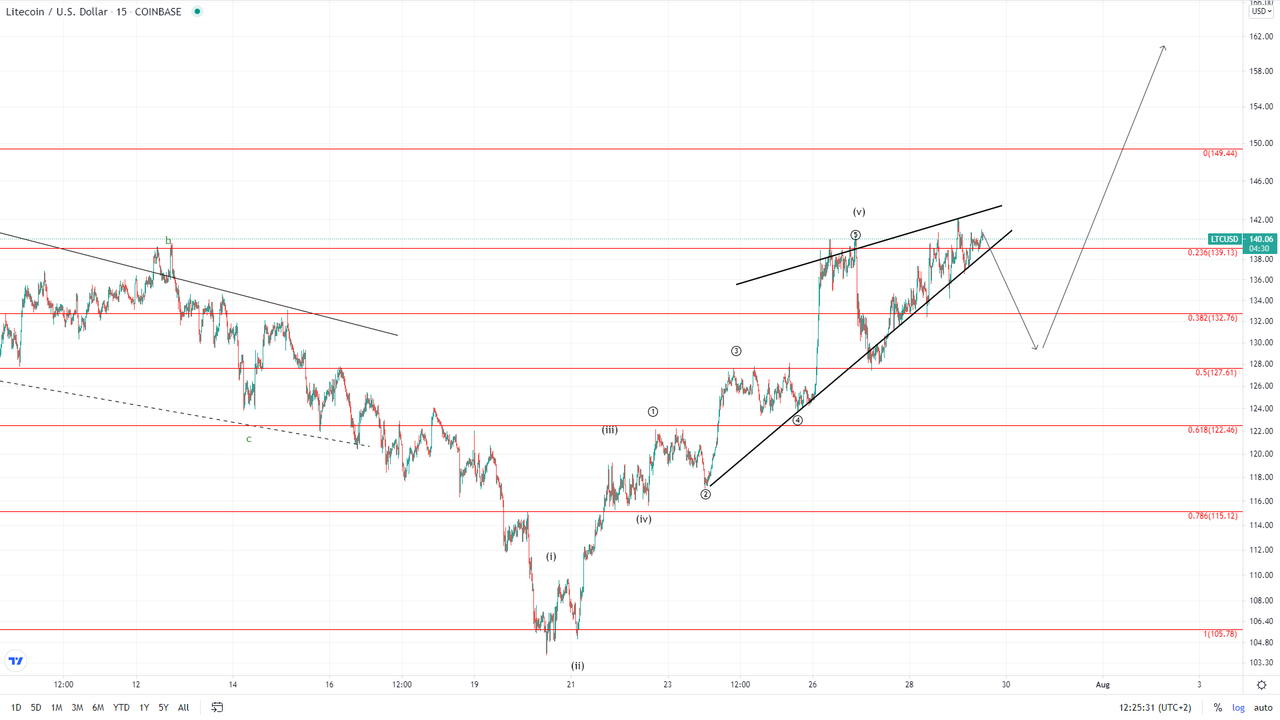
The price of Litecoin has been on the rise from the 20th of July when it fell to $104 at its lowest point. From there we have seen an increase of 35.9% measured to its highest point today at $141.83. This last rise was made after a sharp impulsive decline in a slowly moving manner and even though it is still moving to the downside it barely made it past Monday’s high.

https://i.postimg.cc/J4PsRdpD/ltcusd-1h-3.png

These two signs – slowly moving price after a sharp decline and failure to make a significantly higher high are considered signs of weakness which is why soon a move to the downside would be expected. From the 20th of July have likely seen the completion of the five-wave impulse to Monday’s high. If this is true, then from Monday we have seen the start of the descending move with the rise from Tuesday being its 2nd sub-wave.

This can be a minor three-wave flat correction with the price continuing its upward trajectory after as it made a slightly higher high compared to Monday’s one.  Another possibility could be that this descending move is going to be larger but there aren’t still signs on how it can play out.

Considering the fact that this move is counted as corrective this structure can be labeled as the A wave from the higher degree ABC count.

Read Full on FXOpen Company Blog...

Re: Technical Analysis by FXOpen

Gold Price and Crude Oil Price Eye Additional Gains

https://i.postimg.cc/G37qmLHw/oil-and-dollars.jpg

Gold price started a fresh increase above the $1,820 resistance. Crude oil price is also rising and it is showing positive signs above $70.00.

Important Takeaways for Gold and Oil

  • Gold price started a fresh upward move after forming a base above $1,780 against the US Dollar.

  • There was a break above a key bearish trend line with resistance near $1,805 on the hourly chart of gold.

  • Crude oil price also gained pace and it broke the key $70.00 resistance zone.

  • There is a major bullish trend line forming with support near $72.30 on the hourly chart of XTI/USD.

Gold Price Technical Analysis

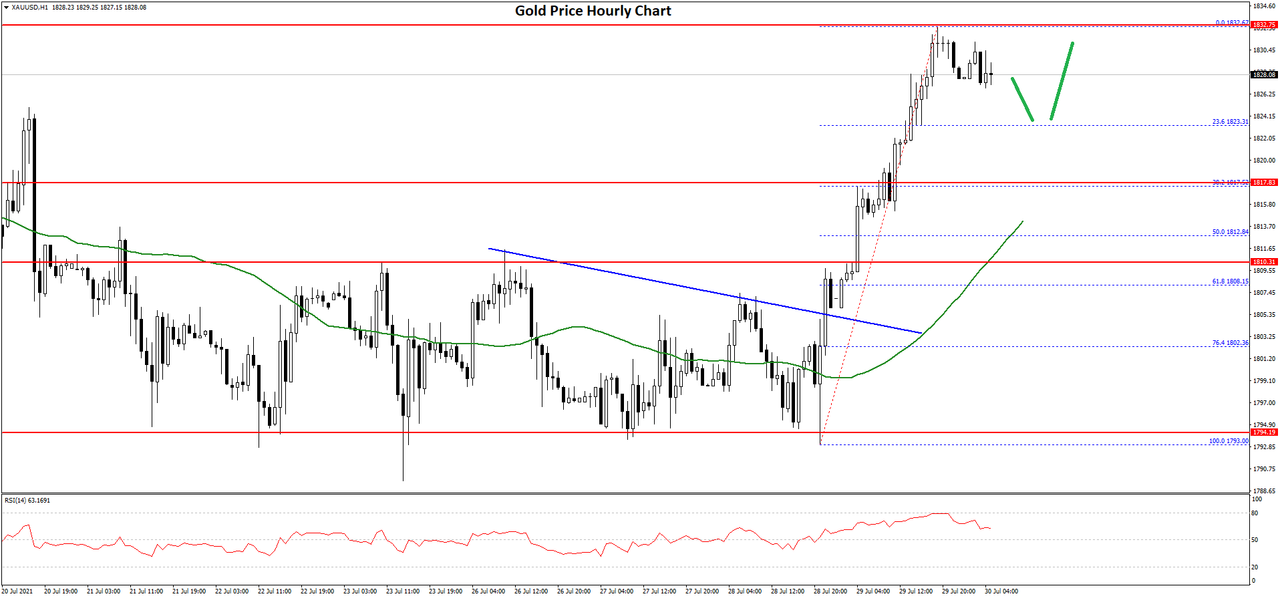
This week, gold price formed a decent support base above the $1,792 zone against the US Dollar. The price started a fresh upward move and it surpassed the $1,800 resistance zone.

The price even settled above the $1,820 level and the 50 hourly simple moving average. Besides, there was a break above a key bearish trend line with resistance near $1,805 on the hourly chart of gold.

https://i.postimg.cc/hv5ryrHP/gold-price-chart-2.png

Finally, the price spiked above the $1,830 resistance and it traded as high as $1,832 on FXOpen. The price is now consolidating gains near $1,828. An initial support on the downside is near the $1,823 level. It is near the 23.6% Fib retracement level of the upward move from the $1,793 low to $1,832 high.

The first major support is near the $1,818 level. The main support is now forming near the $1,810 level and the 50 hourly SMA. The 50% Fib retracement level of the upward move from the $1,793 low to $1,832 high is also near $1,812.

If there is a downside break, the price could test the $1,790 support. An immediate resistance on the upside is near the $1,832 level. The first major resistance is near the $1,840 level. If the price breaks the $1,840 level, it could accelerate higher. In the stated case, the price could rise towards the $1,850 zone.

Read Full on FXOpen Company Blog...

Re: Technical Analysis by FXOpen

GBP/USD Turns Green, USD/CAD Faces Hurdles

https://i.postimg.cc/26FQn1tk/gbpcad.jpg

GBP/USD started a fresh increase and it broke the 1.3880 resistance. USD/CAD is recovering, but it is facing hurdles near 1.2520.

Important Takeaways for GBP/USD and USD/CAD

  1. The British Pound started a steady increase above the 1.3850 and 1.3880 resistance levels.

  2. There is a key bullish trend line forming with support near 1.3875 on the hourly chart of GBP/USD.

  3. USD/CAD started a steady decline below the 1.2550 and 1.2520 support levels.

  4. There was a break above a short-term declining channel with resistance near 1.2455 on the hourly chart.

GBP/USD Technical Analysis

https://i.postimg.cc/d35GSzvg/gbpusd-chart.png

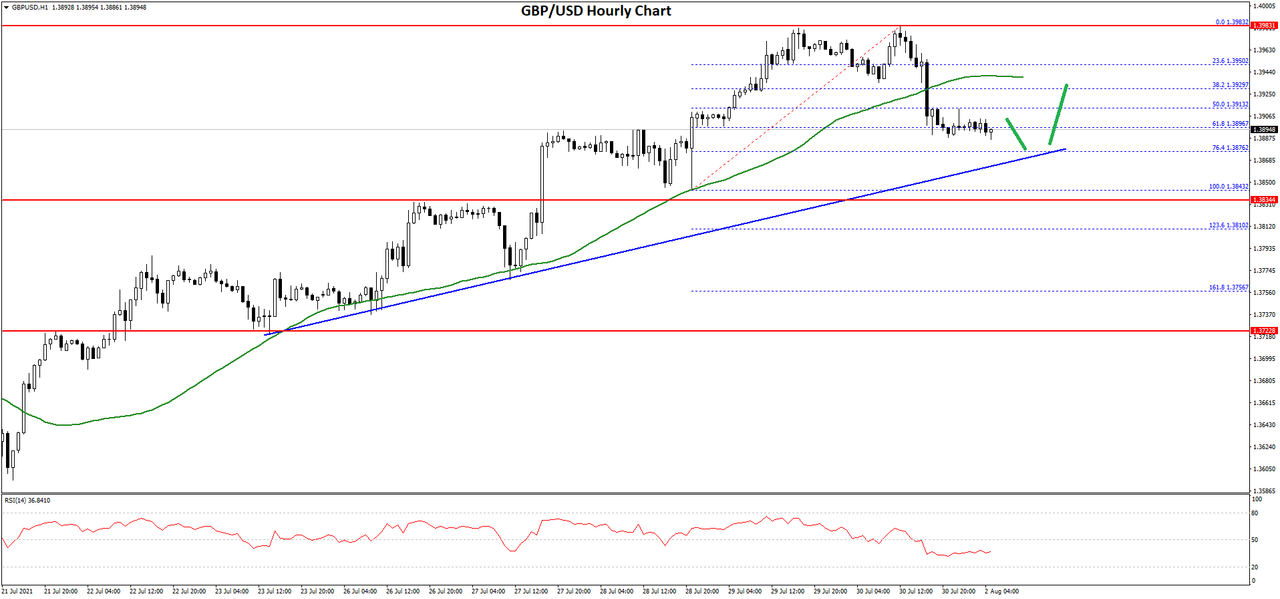
After forming a base above the 1.3620 level, the British Pound started a decent increase against the US Dollar. The GBP/USD pair broke the 1.3750 resistance level to move into a positive zone.

The bulls gained pace above the 1.3850 level and the 50 hourly simple moving average. The pair even broke the 1.3950 resistance level. A high was formed near 1.3981 on FXOpen and it is currently correcting lower.

There was a break below the 1.3950 support level. The pair traded below the 50% Fib retracement level of the recent move from the 1.3843 swing low to 1.3981 high.

On the downside, the first key support is near the 1.3875 area. There is also a key bullish trend line forming with support near 1.3875 on the hourly chart of GBP/USD. The trend line is close to the 76.4% Fib retracement level of the recent move from the 1.3843 swing low to 1.3981 high.

If there is a break below 1.3875 and 1.3860, the pair could decline towards the 1.3825 support zone. Any more losses might call for a test of the 1.3720 support.

On the upside, an initial resistance is near the 1.3940 level. The first major resistance is near the 1.3980 level. The main resistance is now near the 1.4000 zone, above which the pair is likely to accelerate higher towards the 1.4050 and 1.4100 levels.

Read Full on FXOpen Company Blog...

Re: Technical Analysis by FXOpen

The US Economic Growth Exceeds Expectations

https://i.postimg.cc/jqB2MWxX/fed.jpg

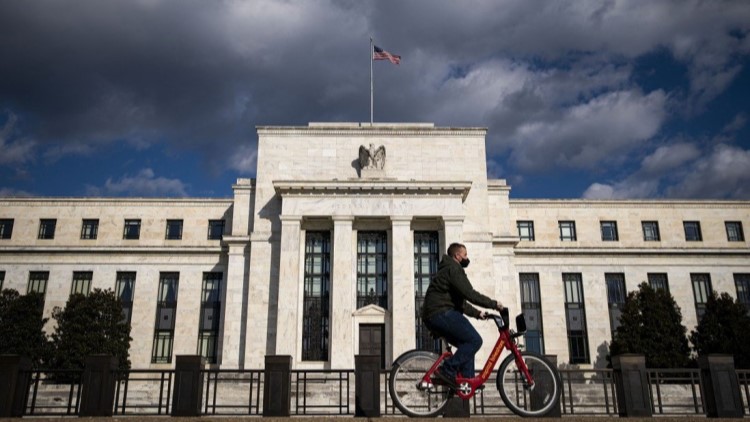
The new trading month started with the market participants focusing on Friday’s NFP report. Because the Federal Reserve of the United States has a dual mandate, one that focuses on both price stability and job creation, the way the labor market performs is viewed as decisive for the future path of monetary policy.

While inflation has reached the Fed’s target, there is still a lot of room for improvement in the labor market. Fed’s definition of full employment leaves room for more strength before the rates could be lifted.

In the middle of last week, the Fed signaled that it is in no rush to lift the rates. Most likely, it remains intentionally behind the curve, wanting to see more strength in the labor market before acting.

But inflation and economic growth may trigger action from the Fed sooner than the market expects. We’ve seen the Gross Domestic Product released last week coming out much stronger than the expectations.

https://i.postimg.cc/SN8s3yjp/piie-charts.jpg

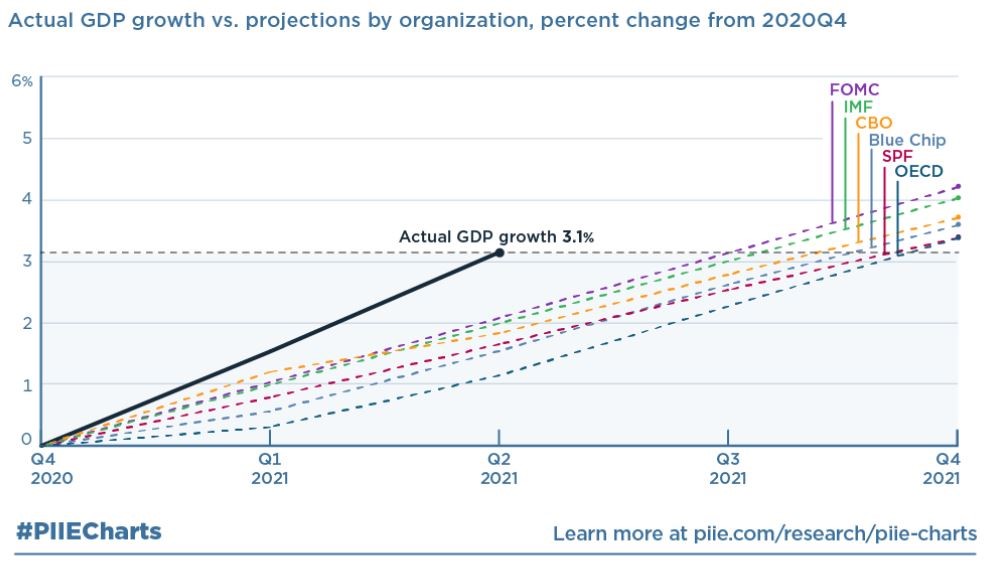
US GDP Grows Much Faster Than Forecasters Expected

The chart above shows a projection for the US GDP made by various institutions in the last quarter of 2020. All of them, including the FOMC, IMF, and OECD, have underestimated the growth of the US economy.

As it turned out, the actual growth path out of the economic recession is much steeper, with positive spillover effects for the main US trade partners. Because the United States is the largest economy in the world, a stronger economic recovery there is enough to add one percentage point or more to global growth.

Before the passage of the America Rescue plan, most forecasters expected that the economy would grow by 3/4%-4.2% in the four quarters of 2021. But the data released last week shows that the economy grows at an annualized rate of 6.4%, much higher than expected.

The solid growth should support the equity markets and keep the US dollar offered. Because most central banks in the developed world have adopted similar monetary policies, which are still loose, the market is dominated by risk-on/risk-off gyrations. Until we see central banks lifting rates, the chances are that the markets will remain correlated.

FXOpen Blog

Re: Technical Analysis by FXOpen

EUR/USD Eyes More Upsides, USD/CHF Turns Red

https://i.postimg.cc/8k4Q8gbY/euro-2.jpg

EUR/USD started a decent increase and it broke the 1.1850 resistance zone. USD/CHF is declining and it could extend losses below 0.9020.

Important Takeaways for EUR/USD and USD/CHF

  • The Euro started a fresh increase from well below 1.1800 against the US Dollar.

  • There is a key bullish trend line forming with support near 1.1840 on the hourly chart of EUR/USD.

  • USD/CHF failed to stay above the 0.9120 support and extended its decline.

  • There is a major bearish trend line forming with resistance near 0.9070 on the hourly chart.

EUR/USD Technical Analysis
https://i.postimg.cc/QxY2tgwk/eurusd-chart.png

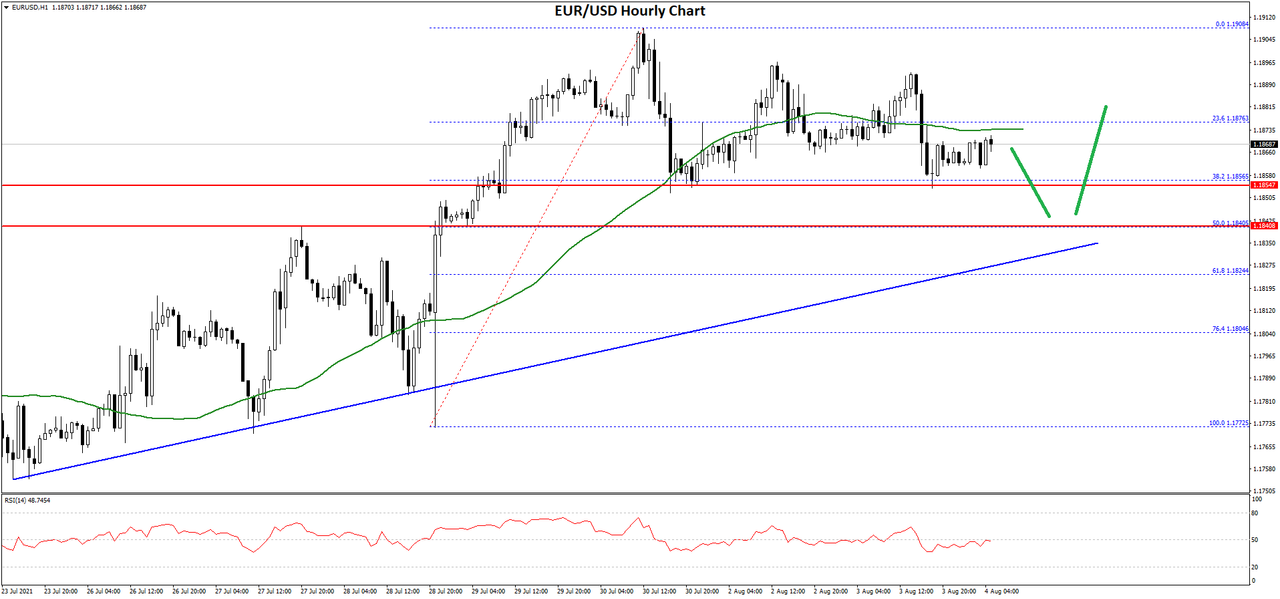
The Euro formed a support base above 1.1780 and started a fresh increase against the US Dollar. The EUR/USD pair broke the 1.1820 resistance zone to move into a positive zone.

The pair even surpassed the 1.1850 resistance zone and it settled above the 50 hourly simple moving average. Finally, there was a spike above the 1.1900 level. A high was formed near 1.1908 on FXOpen before the pair started a downside correction.

There was a break below the 1.1900 and 1.1880 levels. The pair declined below the 23.6% Fib retracement level of the upward move from the 1.1772 swing low to 1.1908 high.

It is now consolidating above the 1.1850 support zone. The next major support is near the 1.1840 level. It is near the 50% Fib retracement level of the upward move from the 1.1772 swing low to 1.1908 high. There is also a key bullish trend line forming with support near 1.1840 on the hourly chart of EUR/USD.

A downside break below the 1.1840 support could start another decline. The next major support could be near the 1.1780 level.

On the upside, an initial resistance is near the 1.1875 level and the 50 hourly simple moving average. The main resistance is near 1.1900. If there is an upside break above the 1.1900 resistance zone, the price could rise steadily towards the 1.1950 resistance zone.

Read Full on FXOpen Company Blog...

Re: Technical Analysis by FXOpen

Google Green-lights Crypto Ads

https://i.postimg.cc/rs3mxjZb/google-crypto-ads.jpg

On August 3, Google rolled out its new policy, allowing advertisers to officially offer their cryptocurrency and wallet exchange services online.

The latest set of rules is quite tough. To weed out shadow advertising and crypto fraud, Google requires advertisers to register with the Financial Crime Enforcement Network (FinCEN). ICOs, banned from advertising back in 2018, are still a no-go.

Thanks to this step, the corporation is expected to boost its revenue in the developing sector of digital currencies.

Meanwhile, Ethereum masterminds have begun a countdown to the Thursday launch of the London update on their website. The update will affect how the network handles transaction fees.

Ahead of the update, ETHUSD is showing more positive dynamics compared to BTCUSD.

https://i.postimg.cc/j2L2DmcP/btcusd.png

On July 31, the BTCUSD market had very small trading volumes (see fig. 1) around the 42k level, and the next day, the price showed bearish dynamics with growing volumes. This indicates a weak demand for the coin at a price of 42k and the dominance of supply. The current decline can be stopped by the level of 36k (or something close to it), where, on July 26, the bitcoin price was growing aggressively under pressure from buyers.

FXOpen Blog

Re: Technical Analysis by FXOpen

Gold Price and Crude Oil Price Show Bearish Signs

https://i.postimg.cc/m2bqx9Vx/Gold-price-oil-price-2.jpg

Gold price started a fresh decline from well above $1,825. Crude oil price is also declining and it broke the main $70.00 support zone.

Important Takeaways for Gold and Oil

  • Gold price failed to clear the $1,830 level and it started a fresh decline against the US Dollar.

  • There was a break below a major bullish trend line with support near $1,815 on the hourly chart of gold.

  • Crude oil price also started a fresh decline from well above the $72.00 zone.

  • There is a connecting bearish trend line forming with resistance near $69.25 on the hourly chart of XTI/USD.

Gold Price Technical Analysis

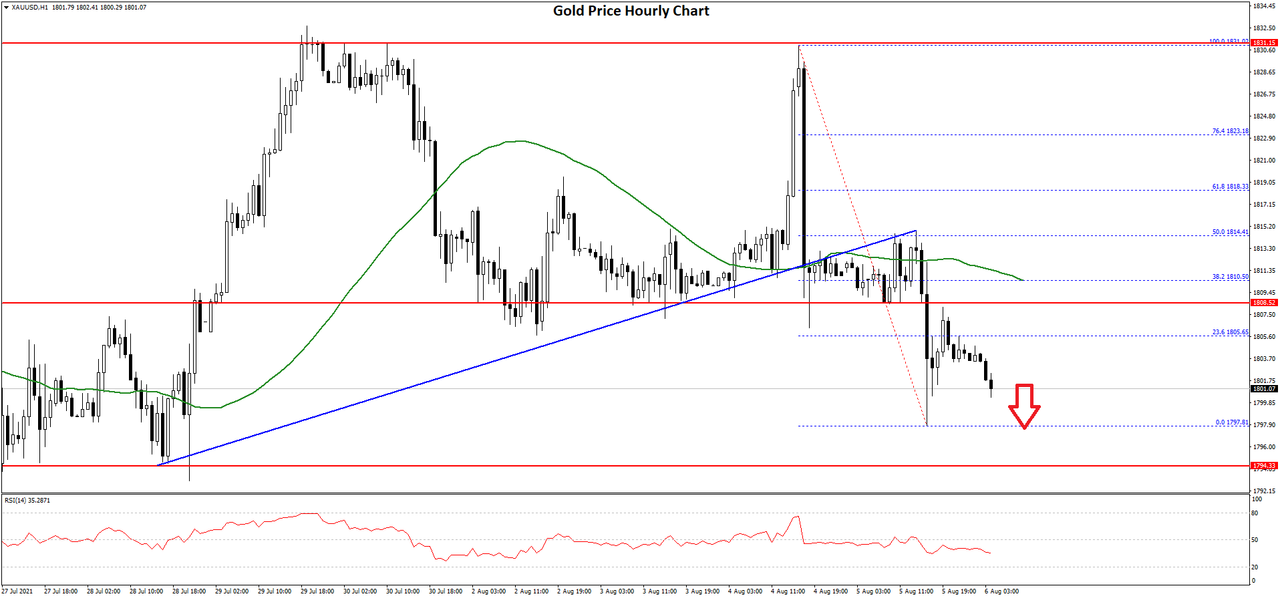
This week, gold price failed once again to clear the $1,830 resistance against the US Dollar. The price traded as high as $1,831 on FXOpen before it started a fresh decline.

There was a break below the $1,820 and $1,810 support levels. The price even broke the $1,805 support and the 50 hourly simple moving average. Besides, there was a break below a major bullish trend line with support near $1,815 on the hourly chart of gold.

https://i.postimg.cc/RC18bd7Q/gold-price-chart.png

The price spiked below $1,800 before the bulls appeared. The price is now consolidating losses, with an immediate resistance near the $1,810 level.

The first key resistance is near the $1,810 level and the 50 hourly simple moving average. It is near the 38.2% Fib retracement level of the downward move from the $1,831 high to $1,797 low. The main resistance is near the $1,815 level.

A close above $1,815 could set the pace for a larger increase. An initial support on the downside is near the $1,795 level. The first major support is near the $1,785 level. If there is a downside break, the price could test the $1,750 support in the near term.

Read Full on FXOpen Company Blog...

Re: Technical Analysis by FXOpen

GBP/USD and EUR/GBP Target Additional Losses

https://i.postimg.cc/vZMXSmV2/GBPUSD-Cable.jpg

GBP/USD started a steady decline from the 1.4000 resistance zone. EUR/GBP also declined and it broke the key 0.8500 support zone.

Important Takeaways for GBP/USD and EUR/GBP

  • The British Pound failed to surpass the 1.4000 resistance zone and started a fresh decline.

  • There is a major bearish trend line forming with resistance near 1.3915 on the hourly chart of GBP/USD.

  • EUR/GBP started a fresh decline from well above the 0.8550 pivot level.

  • There is a key bearish trend line forming with resistance near 0.8500 on the hourly chart.

GBP/USD Technical Analysis

https://i.postimg.cc/Z5cjkhPb/gbpusd-chart-1.png

The British Pound made many attempts to clear the 1.3400 resistance level against the US Dollar, but it failed. As a result, the GBP/USD pair started a steady decline below the 1.3950 level.

The pair even broke the 1.3920 support level and it settled below the 50 hourly simple moving average. Finally, there was a break below the 1.3900 support and the pair traded as low as 1.3855 on FXOpen.

It is now consolidating losses above the 1.3850 support. An immediate resistance on the upside is near the 1.3875 level. The 23.6% Fib retracement level of the downward move from the 1.3948 swing high to 1.3855 low is also near the 1.3875 level.

The first major resistance is now forming near the 1.3900 zone and 50 hourly simple moving average. It is close to the 50% Fib retracement level of the downward move from the 1.3948 swing high to 1.3855 low.

Moreover, there is a major bearish trend line forming with resistance near 1.3915 on the hourly chart of GBP/USD. Therefore, a proper break above the 1.3900 resistance and the trend line could open the doors for a steady increase.

An immediate support on the downside is near the 1.3850 level. A downside break below the 1.3850 level might call for more losses. The next major support is near the 1.3800 level. Any more losses could lead the pair towards the 1.3740 level in the near term.

Read Full on FXOpen Company Blog...

Re: Technical Analysis by FXOpen

Solid Jobs Report Sends the US Dollar Higher

https://i.postimg.cc/Hk8VzBPp/job-openings.jpg

The US dollar reversed the recent losses and closed the last week higher. Responsible for the move was the July NFP report.

The market expected a positive report, but the outcome exceeded expectations. The US economy added over 940k new jobs in July. Moreover, the data for the previous month was revised higher by over 100k jobs.

All the elements in the report pointed to a strong recovery of the US economy. Besides the better headline number, the Unemployment Rate declined to 5.4% – another positive development.

Sure enough, the US economy still needs to recover about 5 million jobs lost during the pandemic. But solid reports like the one from last Friday bring the Fed closer to fulfill its employment mandate, and thus the tightening of the financial conditions may be just around the corner.

The Fed, as a central bank, has a dual mandate. It aims at price stability and maximum employment.

The price stability mandate is monitored by the changes in inflation. Inflation is already above Fed’s target, even though it is unclear how long is the period the Fed looks at averaging inflation to 2%.

What remains is improvements in the labor market – and the July NFP report shows such improvements. The bias is now that the Fed will announce the tapering of its asset purchases sooner than expected, and so the US dollar ticked higher on the news.

https://i.postimg.cc/W4RtHgQ0/usd-gold.jpg

The Technical Picture Also Favors a Stronger Dollar

From a technical analysis perspective, the US dollar may be at the end of a cycle. The Dollar index formed a double top at the 100 level, but it recently found both horizontal and dynamic support in the 90 area.

A quick look at the rising trend reveals the fact that the Dollar index has kept the series of higher lows intact, just like it is supposed to do in a rising trend. Hence, as long as the index holds above 89, the bias remains bullish.

Moving forward, traders will look for clues about what the Fed will do next. Is the July NFP report strong enough to trigger earlier tapering? If yes, the US dollar’s rally should continue unabated.

FXOpen Blog

Re: Technical Analysis by FXOpen

EUR/USD Could Recover, USD/JPY Gains Momentum

https://i.postimg.cc/3RTg86t1/euro-3.jpg

EUR/USD started a major decline and it traded below 1.1750. USD/JPY is rising and it even broke the 110.50 resistance zone.

Important Takeaways for EUR/USD and USD/JPY

  • The Euro started a major decline below the 1.1800 and 1.1780 levels.

  • There is a key bearish trend line forming with resistance near 1.1725 on the hourly chart of EUR/USD.

  • USD/JPY started a fresh increase above the main 110.00 resistance zone.

  • There is a major bullish trend line forming with support near 110.50 on the hourly chart.

EUR/USD Technical Analysis

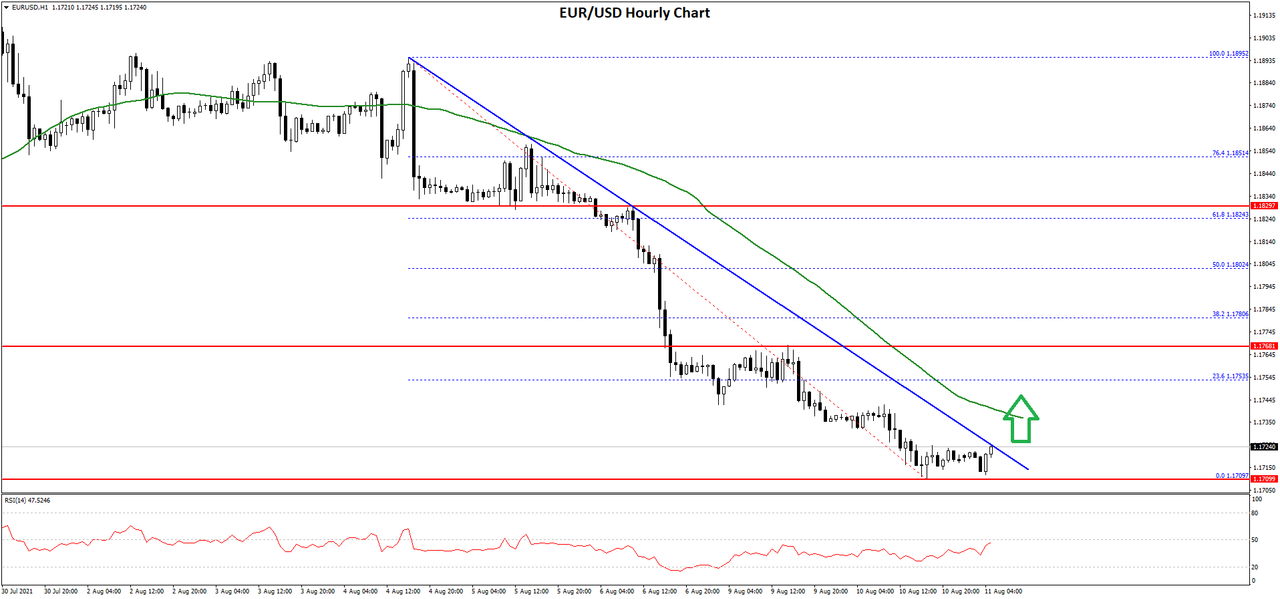
After a failed attempt to clear 1.1850, the Euro started a major decline against the US Dollar. The EUR/USD pair broke the 1.1800 support zone to move into a bearish zone.

The pair settled below the 1.1800 level and the 50 hourly simple moving average. It even broke the 1.1750 support level and traded as low as 1.1709 on FXOpen. It is now consolidating gains above the 1.1700 support zone.

https://i.postimg.cc/50S863GV/eurusd-chart-1.png

An immediate resistance is near the 1.1725 level. There is also a key bearish trend line forming with resistance near 1.1725 on the hourly chart of EUR/USD.

The first key resistance is near the 1.1750 level. It is near the 23.6% Fib retracement level of the recent decline from the 1.1895 swing high to 1.1709 low. Any more gains could start a decent increase towards the 1.1800 resistance.

The 50% Fib retracement level of the recent decline from the 1.1895 swing high to 1.1709 low is also near the 1.1800 level. A close above 1.1800 could open the doors for a steady increase towards 1.1850.

If not, the pair might continue to move down below 1.1710. An intermediate support is near the 1.1700 level. The next major support is near the 1.1680 level, below which the pair could drop towards the 1.1640 support in the near term.

Read Full on FXOpen Company Blog...

Re: Technical Analysis by FXOpen

AUD/USD and NZD/USD Target Additional Losses

https://i.postimg.cc/RFgm0Kdb/aud-22.jpg

AUD/USD started a fresh decline from well above the 0.7400 level. NZD/USD also declined below the 0.7020 and 0.7000 support levels.

Important Takeaways for AUD/USD and NZD/USD

  • The Aussie Dollar started a major decline after it failed to clear 0.7440 against the US Dollar.

  • There is a major bearish trend line forming with resistance near 0.7365 on the hourly chart of AUD/USD.

  • NZD/USD also started a fresh decline from well above the 0.7050 level.

  • There was a break below a key contracting triangle with support near 0.7015 on the hourly chart of NZD/USD.

AUD/USD Technical Analysis

https://i.postimg.cc/5yjVQyk9/audusd-chart.png

After struggling to clear the 0.7440 resistance, the Aussie Dollar started a major decline against the US Dollar. The AUD/USD pair broke the 0.7400 and 0.7380 support levels to move into a bearish zone.

The pair even broke the 0.7350 support and the 50 hourly simple moving average. Recently, there was a recovery wave, but the pair failed to clear the 0.7400 resistance zone. It is now trading below the 0.7345 level and traded as low as 0.7332 on FXOpen.

It is now consolidating losses above the 0.7335 level. An immediate resistance is near the 0.7355 level and the 50 hourly simple moving average. It is near the 38.2% Fib retracement level of the recent decline from the 0.7389 swing high to 0.7332 low.

The next major resistance is near the 0.7360 level. It is close to the 50% Fib retracement level of the recent decline from the 0.7389 swing high to 0.7332 low.

There is also a major bearish trend line forming with resistance near 0.7365 on the hourly chart of AUD/USD. To move into a positive zone, the pair must settle above 0.7360 and the 50 hourly SMA.

An initial support on the downside is near the 0.7335 level. The next major support is near the 0.7320 level. If there is a downside break below the 0.7320 support, the pair could extend its decline towards the 0.7250 level.

Read Full on FXOpen Company Blog...

Re: Technical Analysis by FXOpen

GBP/USD Faces Resistance While GBP/JPY Dives Below 152.00

https://i.postimg.cc/NG6YcPh4/gbpusd.jpg

GBP/USD started a fresh increase after a drop to 1.3800. Conversely, GBP/JPY is declining and it broke the key 152.00 support zone.

Important Takeaways for GBP/USD and GBP/JPY

  • The British Pound traded as low as 1.3790 before it started an upside correction against the US Dollar.

  • There was a break above a key bearish trend line with resistance near 1.3855 on the hourly chart of GBP/USD.

  • GBP/JPY topped near 153.30 and started a major decline.

  • There was a break below a major bullish trend line with support near 153.00 on the hourly chart.

GBP/USD Technical Analysis

https://i.postimg.cc/3J3hJCYH/gbpusd-chart-2.png

This past week, there was a steady decline in the British Pound below the 1.3900 level against the US Dollar. The GBP/USD pair even broke the 1.3850 and 1.3820 support levels.

It traded as low as 1.3790 on FXOpen before it started an upside correction. There was a decent recovery wave above the 1.3800 level. The price surpassed the 1.3850 resistance level and the 50 hourly simple moving average.

There was also a break above a key bearish trend line with resistance near 1.3855 on the hourly chart of GBP/USD. The pair is now trading nicely above the 1.3850 level.

It traded as high as 1.3874 and it is now consolidating gains. An immediate support is near the 1.3855 level. It is close to the 23.6% Fib retracement level of the recent increase from the 1.3790 low to 1.3874 high.

The next major support is near the 1.3840 level and the 50 hourly simple moving average. The 50% Fib retracement level of the recent increase from the 1.3790 low to 1.3874 high is also near 1.3832. If there is a break below the 1.3830 support, the pair could test the 1.3800 support. If there are additional losses, the pair could decline towards the 1.3660 level.

On the upside, the pair is facing a major resistance near the 1.3880 and 1.3900 levels. A clear break above the 1.3900 resistance could set the pace for a larger increase. The next key resistance is near 1.4000.

Read Full on FXOpen Company Blog...

Posts: 376 to 400 of 1,778

Pages Previous 1 14 15 16 17 18 72 Next

You must login or register to post a reply

Forex Software → Market Analysis → Technical Analysis by FXOpen

Similar topics in this forum