Topic: Spread Analyzer for "Max Spread" entry protection & Monte Carlo sims
I was trying to decide what spread I should use for the "Max Spread" entry protection input on my EA... and realised that it's not a straight-forward thing to figure out. Spreads vary through the day, over the years, and from one broker to another. We really need to see some broker-specific histograms.
So I asked ChatGPT to create an EA for me to execute in MT5 to do exactly that. After much back & forth (about ten hours and 73 versions so far) this is what we came up with:
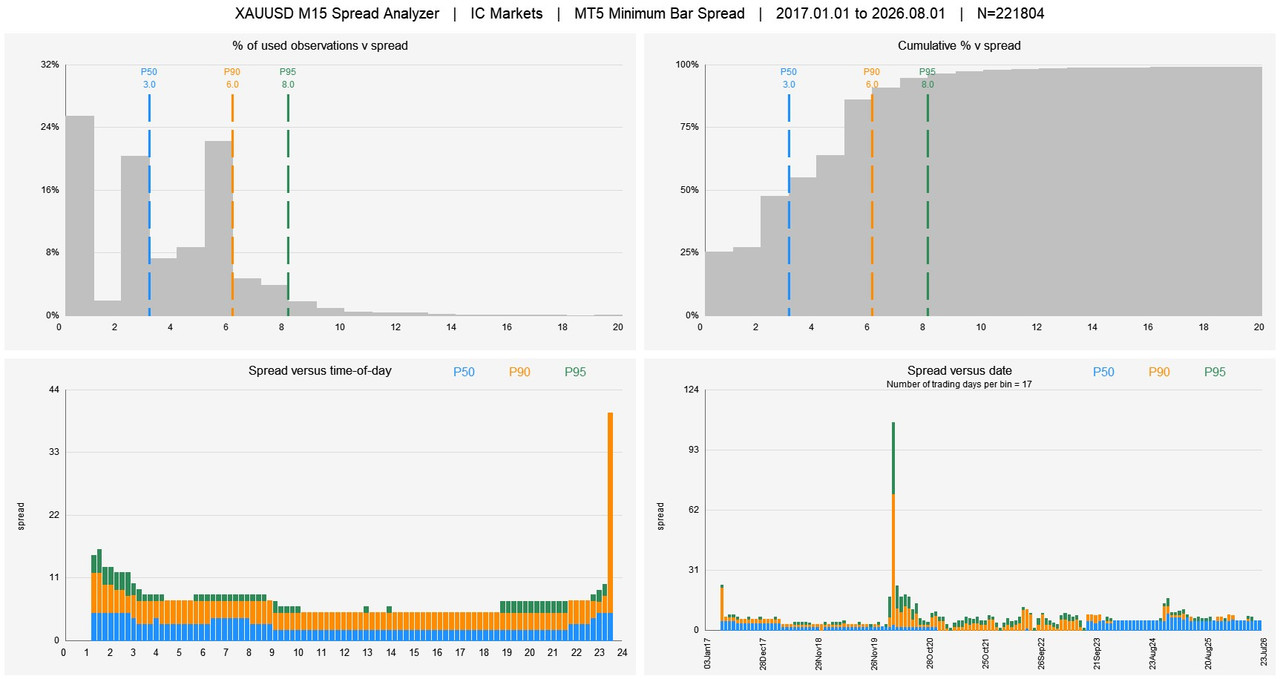
These charts are for gold (XAUUSD) on IC Markets, and are based on the spread information that's embedded in the M15 OHLC data. As you can see, the spreads are all integers. The blue numbers are the 50th percentile numbers ("P50", which is the Median). Orange are the 90th percentile ("P90") and Green are the 95th percentile ("P95").
For most of 2021 and 2022 the Median is zero, indicating that a lot of the spreads are claimed to be negligible. That seems unlikely, but might just be rounding-down. However, I have seen speculation online that the spreads embedded in OHLC data are actually the low of the spread for that candle, not the mean or median, which is why I wrote "MT5 Minimum Bar Spread" at the top of the chart.
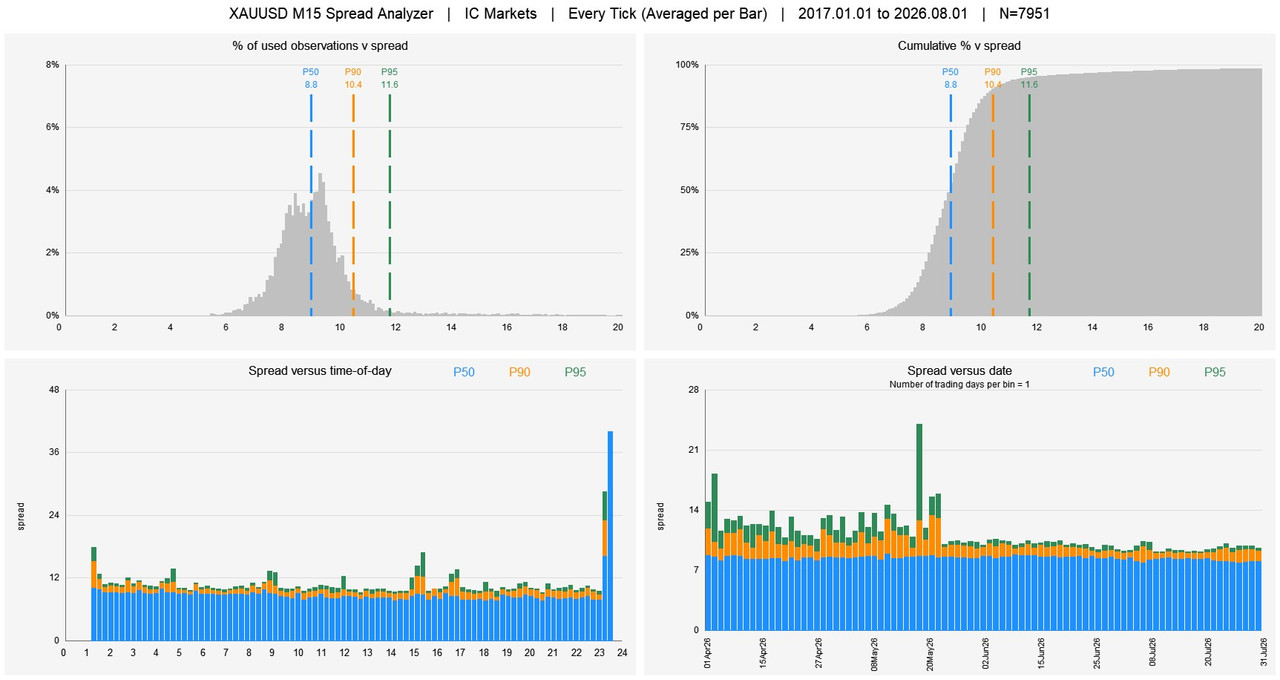
Since it's unclear whether we can trust the spreads embedded in the OHLC data, I thought it might be interesting to recalculate these charts based on tick data. Unfortunately IC Markets only provide a few months of tick data so the time period will be limited, but the comparison should be interesting. I'll send that in another message.
For now, attached is the code of the EA that produced these charts. If you want to make changes just upload the code to ChatGPT and ask ChatGPT to do it for you. There are lots of input options for this EA. Check the code for comments that might help you figure out what each one does. Or ask me.