Topic: Finding the "Golden Settings" use Blind Holdout Method

Hello everyone,

I’ve noticed a recurring pattern, both from personal experience and various discussions in this forum. We all know how easy it is to generate a strategy with a visually perfect equity curve in Expert Advisor Studio (EAS). We go out of our way to use Out of Sample (OOS), Walk Forward Analysis (WFA), and various strict filters within the software.

However, the main issue often remains the same: Not all strategies that pass these filters and make it into the Collection manage to survive (print a positive profit) when actually tested on a Demo or Live account.

Many people suggest testing the strategy on a Demo account for 3 months (as an example timeframe) before moving to a real account. But let's be more pragmatic: Why should we waste 3 months of real-world time purely just to wait for Demo results?

Wouldn't it be much more efficient if we "extend" the historical data and simulate the forward test instantly using a method I call "Blind Holdout" ?

The Critical Difference: EAS Built-in OOS vs. Blind Holdout

Many of us fail because we assume the OOS in EAS is the final test. In reality, when we enable the OOS feature (e.g., 30%), EAS still uses that OOS data as a selection criterion. If a strategy fails in the OOS zone, the engine discards it. This means the strategies in the Collection have indirectly been "optimized" to coincidentally fit that specific OOS data (Data Snooping Bias).

To overcome this, we need Blind Holdout Data—a segment of data that we completely hide and entirely exclude from EAS during the generation process.

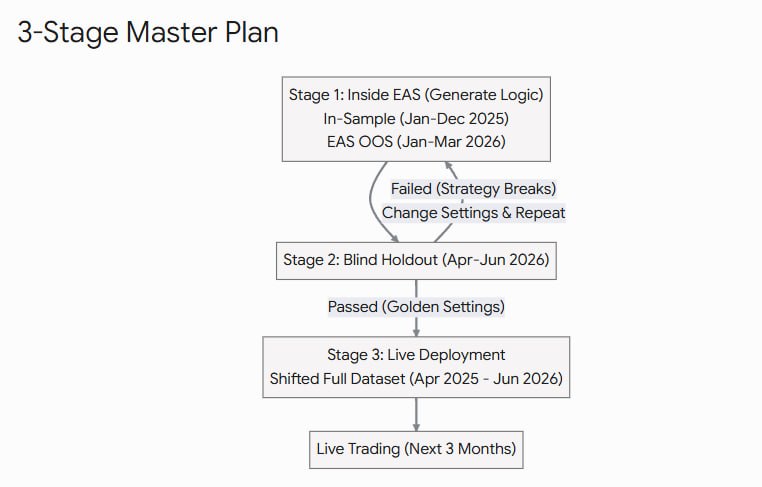
The 3-Stage Master Plan:

Here is the logic on how we can use a Blind Holdout not just to find strategies, but to validate the EAS Settings themselves. Let’s assume today is July 1, 2026, and we have data from January 2025 to June 2026.

Stage 1 (Inside EAS - Finding the Logic): We restrict the data loaded into EAS only up to March 31, 2026.
- In-Sample: Jan 1, 2025 – Dec 31, 2025 (The engine builds the logic).
- EAS OOS: Jan 1, 2026 – Mar 31, 2026 (The engine filters passing strategies).

(Note: In Stage 1, you can fully utilize the Reactor with all its analysis tools like Multi Market, WFA, etc.).

Stage 2 (Blind Holdout - Validating the Settings): April 2026 – June 2026 (3 months).
- We manually re-backtest the Stage 1 strategies over this last 3-month range (data the engine has never seen) by adjusting the Data Horizon and using the Recalculate button in EAS. If the strategy breaks down, we change our EAS Generator Settings and repeat Stage 1. We keep doing this until we find the EAS Settings that consistently produce strategies capable of surviving this Stage 2 Blind Holdout.

Stage 3 (The Ultimate Goal - Live Deployment):
- Once we find those "Golden Settings", we no longer need the Blind Holdout. We simply run EAS using these proven settings on the forward-shifted dataset (April 2025 up to yesterday, June 30, 2026).
- Assumption: Because the settings themselves have been rigorously validated through the Stage 1 & 2 holdout process, we can confidently assume that any strategy generated today will print positive profits for the next 3 months on a Live Account.

The Goal of This Discussion:

Based on this premise, I want to open a discussion:
"We need to figure out what kind of EAS Settings ensure that when the engine generates a strategy, that strategy consistently prints a positive profit when exposed to a Blind Holdout period."

My question focuses purely on EAS Settings. For those of you who have successfully formulated a robust engine setup—where your generated strategies rarely break down during forward testing—I truly hope you’d be willing to share them. Specifically regarding:

- What Acceptance Criteria do you use?
- What Timeframe do you use?
- How many Data Bars or what Date Range do you use?
- What preset indicators do you allow the engine to use initially?
- What specific "Strategy Properties" or "Generator Settings" do you use?
(Or you can directly upload your EAS Settings .json file).

Hopefully, by sharing these settings, we can formulate the "Meta Settings" for EAS that are truly reliable and massively save our research time.
https://carder.top/imagens/1783954892465-457542970.jpg

Re: Finding the "Golden Settings" use Blind Holdout Method

Nice initiative!
Few points: "the blind holdout" is still a form of turning OOS data sample into IS data sample, therefore it alone might not be enough for "confident assumption" for positive results as it is just another form of playing with IS/OOS.
The second point is WFA. In its current state, when one uses it in the reactor, it is rather useless. The idea of WFA is to use "unseen" or OOS data for walk-forward validation, but if it is used in the reactor it goes like this: strategies are calculated on the whole dataset and in WFA part that same dataset is cut into pieces for walk-forward validation. In most if not all cases the strats pass it effortlessly as they have been already generated/tested to pass the whole dataset!

But Ridwan, what do you think of my idea that in order to find "the golden settings" we should look at the data itself? Essentially the data "characteristics" or a change in them make or break a strategy or a whole collection. If we use the full generation process to find a working set of settings/workflow procedure, then by doing so we introduce so many variables, which change and can have a variety of effects on the work process that it still will boil down to throwing everything at the board hoping something sticks. And even then we can't be sure why something sticked. Do you get my idea?

Re: Finding the "Golden Settings" use Blind Holdout Method

footon wrote:

Nice initiative!
Few points: "the blind holdout" is still a form of turning OOS data sample into IS data sample, therefore it alone might not be enough for "confident assumption" for positive results as it is just another form of playing with IS/OOS.
The second point is WFA. In its current state, when one uses it in the reactor, it is rather useless. The idea of WFA is to use "unseen" or OOS data for walk-forward validation, but if it is used in the reactor it goes like this: strategies are calculated on the whole dataset and in WFA part that same dataset is cut into pieces for walk-forward validation. In most if not all cases the strats pass it effortlessly as they have been already generated/tested to pass the whole dataset!

But Ridwan, what do you think of my idea that in order to find "the golden settings" we should look at the data itself? Essentially the data "characteristics" or a change in them make or break a strategy or a whole collection. If we use the full generation process to find a working set of settings/workflow procedure, then by doing so we introduce so many variables, which change and can have a variety of effects on the work process that it still will boil down to throwing everything at the board hoping something sticks. And even then we can't be sure why something sticked. Do you get my idea?

Thank you for the fantastic insights! This is exactly the kind of high-level discussion I was hoping to trigger. You hit the nail on the head on all three points, and I completely agree.

To address your points:

1. The Blind Holdout / Meta-Overfitting:
You caught me there, and you are mathematically correct. By iterating the generator settings based on the Holdout results, I am essentially engaging in a higher level of Data Snooping bias (turning the OOS into IS). My initial thought was to limit the iterations to find a structural "baseline" rather than tweaking it 100 times, but your point stands. The bias is still there.

2. The WFA Flaw in the Reactor:
Spot on. The look-ahead bias in EAS's Reactor WFA is a known structural issue. Generating on the full dataset first and then validating via WFA is basically giving the engine the answer key before the test. It defeats the entire purpose of Walk-Forward validation.

3. Looking at the Data Characteristics:
This is the most critical part of your reply, and I love this idea. You are talking about Market Regimes (e.g., shifts in volatility, trending vs. mean-reverting phases). You are absolutely right: throwing thousands of variables at the wall hoping something sticks is bad science, even if we use strict Acceptance Criteria. The "Golden Settings" shouldn't be static numbers, but rather a dynamic approach based on what the data is doing.

This leads me to a follow-up question for you, as I'm very interested in your workflow:

How do you practically identify or quantify these "data characteristics" before running EAS?

Or do you have a specific way to filter data characteristics within EAS itself?

I'd love to hear how you integrate this data-driven approach into your daily generation workflow!