1 (edited by DrQuant Yesterday 16:24:36)

Topic: How can "Max Daily Loss" be larger than "Max Drawdown"?

Hi all,

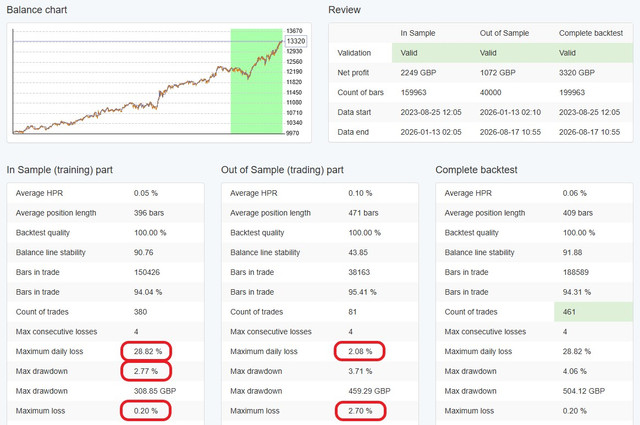
Below is a screenshot of an EA's stats. I'm trying to make sense of the numbers circled in red. In particular:

Q1) How can the "Max Daily Loss" be larger than the "Max Drawdown"?

Thanks!
https://i.postimg.cc/NFdSvVKN/Capture.jpg

2 (edited by DrQuant Yesterday 16:26:13)

Re: How can "Max Daily Loss" be larger than "Max Drawdown"?

I figured out the answers to Q2 & Q3 so I deleted them. But I still don't get the answer to Q1...

3 (edited by DrQuant Yesterday 15:44:48)

Re: How can "Max Daily Loss" be larger than "Max Drawdown"?

Also:

Q4) How can the "Maximum Loss" for the "Complete Backtest" be 0.20% when the "Maximum Loss" for OOS is 2.70%?

Re: How can "Max Daily Loss" be larger than "Max Drawdown"?

I exported the data and calculated the drawdown figures myself in EXCEL. My results do not agree with any of the numbers in the screenshot. So either I'm being stupid (possible) or the numbers in EA Studio are just wrong...

Re: How can "Max Daily Loss" be larger than "Max Drawdown"?

Attached is the EA in case anyone wants to check the stats. I used Premium Data, 200000 bars of USATECHIDXUSD M5 ending at 2026-08-17 11:00.

Post's attachments

EA Studio Plus USATECHIDXUSD M5 2003370840.mq5 78.82 kb, file has never been downloaded. 

You don't have the permssions to download the attachments of this post.