forex software

Create and Test Forex Strategies

forex software

Skip to forum content

Forex Software

Create and Test Forex Strategies

You are not logged in. Please login or register.


(Page 2 of 7)

Forex Software → Market Analysis → FxNews.me — Technical Analysis

Pages Previous 1 2 3 4 7 Next

You must login or register to post a reply

RSS topic feed

Posts: 26 to 50 of 166

Re: FxNews.me — Technical Analysis

Will Solana Bounce Back Above $171.7? Key Levels to Watch

https://i.postimg.cc/1tHsBsVW/1.png

FxNews.me—Solana consolidates below the $171.7 high as expected because the Stochastic and RSI 14 signaled overbought at the time. As of this writing, SOL/USD trades at approximately $165.6, testing the median line of the Bollinger Bands. 

https://i.postimg.cc/RhZ9bycv/2.png

The primary trend should be considered bullish because the price is above the 50- and 100-period simple moving averages. However, the Awesome Oscillator histogram is red, signaling that the downtick momentum from $171.7 could extend to the lower support levels. 


Forecast

From a technical perspective, the trend outlook remains bullish as long as Solana trades above $161.5. However, for the uptrend to resume, the Bulls must close and stabilize the price above $171.7. 

Conversely, a dip below the $161.5 should invalidate the bullish outlook. In this scenario, a new bearish wave will likely form, and the target could be the 100-period SMA at $152.0.

Re: FxNews.me — Technical Analysis

Bearish Outlook for AUD/USD with Key Levels in Focus

https://i.postimg.cc/sDnmWV5D/6.png

FxNews.me—AUD/USD formed a bearish Fair Value Gap (FVG) after the price broke below the $0.665 support level, signaling a potential continuation of the downtrend. Momentum indicators are not yet in oversold territory, suggesting the price still has room for further decline.

Given the formation of the FVG, the Australian dollar may temporarily recover some of its losses near the upper band of the bearish flag before the downtrend resumes.

Furthermore, the next bearish target could be the $0.656 support, provided the critical resistance at $0.669 holds. However, this bearish outlook would be invalidated if AUD/USD breaks above the critical resistance level.

Re: FxNews.me — Technical Analysis

Gold Rebounds: Opportunities for Bullish Traders

https://i.postimg.cc/WzTgWJM0/2.png

FxNews.me—Gold has resumed its upward trend following a brief consolidation near the 50-period simple moving average. Technical indicators like the RSI 14 and Awesome Oscillator suggest that the bullish momentum is likely to continue.

The immediate resistance level is at $2,685, and there’s potential for the yellow metal to surge further, targeting the Fair Value Gap (marked in red). If this gap holds, gold may retest the $2,685 level, offering traders a good opportunity to enter the bullish market.

However, it’s important to note that gold is currently overvalued in the short term, and a significant decline could occur at any moment. Traders should closely monitor key support levels to find low-risk entry points.

Re: FxNews.me — Technical Analysis

Ethereum Eyes $2,590: Can Bulls Hold $2,505 Support?

https://i.postimg.cc/k4xzpcMj/9.png

FxNews.me—Ethereum price rebounded from $2,450, the September 14 high. However, the uptick momentum eased when the price hit the 100-period SMA as resistance.

The technical indicators show signs of a bullish trend, with both the Stochastic and RSI 14 rising from the oversold territory. Meanwhile, the Awesome Oscillator histogram has turned green, which is interpreted as a sign that the bull market is strengthening.

Immediate support is at $2,505. The current uptick momentum has the potential to fill the Fair Value Gap at $2,590, provided the bulls maintain their position above the immediate support.

Conversely, the bullish outlook will be invalidated if ETH/USD dips below the $2,505 mark. In this scenario, Ethereum will likely revisit $2,459, and if the selling pressure increases, the downtrend could extend to the October 10 low at $2,330.

Re: FxNews.me — Technical Analysis

Litecoin Eyes $71.5 Amid Bullish Momentum

https://i.postimg.cc/MGDm5gMX/10.png

FxNews.me—Litecoin bounced off the $67.5 resistance, backed by the 100-period SMA. As of this writing, LTC trades at approximately $70.4, testing the 38.2% Fibonacci retracement level.

The primary trend is bullish because LTC/USD is above the 100-period simple moving average. Additionally, the Awesome Oscillator histogram is green and rising toward the signal line.

From a technical perspective, the uptrend will likely resume with the next bullish target at $71.5, a resistance area backed by the 50% Fibonacci and the Fair Value Gap area.

The immediate support rests at $69.7. The bullish outlook should be invalidated if LTC/USD dips below this support.

Re: FxNews.me — Technical Analysis

Bitcoin Eyes $68,750: Bullish Momentum Grows

https://i.postimg.cc/CL2sR2qf/3.png

FxNews.me—Bitcoin is trading around $66,800, holding above the 100-period simple moving average (SMA) and the critical support level of $65,200.

Technical indicators suggest a mildly bearish trend, with both the Stochastic and RSI 14 declining. However, the Awesome Oscillator’s histogram has turned green, indicating bullish momentum is gaining strength.

In addition to the signal from the Awesome Oscillator, the 4-hour chart shows a long-wick bullish candlestick pattern. Technically, if Bitcoin stays above the 100-period SMA, the bullish move may target $68,750, followed by the $69,580 resistance level.

However, this bullish outlook becomes invalid if the price drops below $65,200.

Re: FxNews.me — Technical Analysis

EUR/USD Set to Drop as Bearish Pattern Forms

https://i.postimg.cc/VvZS3Q1G/3.png

FxNews.me—The EUR/USD currency pair formed a bearish engulfing pattern close to the 50-period simple moving average. Meanwhile, the immediate support rests at $1.078.

From a technical perspective, the downtrend will likely resume, with the next target at $1.072 if bears stabilize the price below the immediate support.

Furthermore, the bearish outlook should be invalidated if the EUR/USD price exceeds the critical resistance level of $1.088.

Re: FxNews.me — Technical Analysis

GBP/JPY Signals Strength Above Key Support Levels

https://i.postimg.cc/DZ05Pb1b/4.png

Fxnews.me—GBP/JPY bounced from the 198.3 Fair Value Gap area, which is a strong bullish signal, considering the primary trend is bullish with the price being above the 50- and 100-period simple moving averages.

The momentum indicators are not overbought, and the Awesome Oscillator histogram turned green, suggesting the uptrend should resume.

Critical support that divided the bull market from the bear market stands at 196.6, backed by the 50-period simple moving average. As long as the price holds above the 196.6 mark, the outlook for the GBP/JPY currency pair remains bullish.

In this scenario, the next target will likely be the 201.0 mark.

Re: FxNews.me — Technical Analysis

Cardano Eyes $0.347 Break as Bulls Take Charge

https://i.postimg.cc/zBtfFDy2/7.png

FxNews.me—Cardano is testing the 100-SMA at $0.347 amid the Stochastic signaling overbought. On the other hand, the Awesome Oscillator indicates that the bull market should prevail, with a green histogram above the signal line. 

From a technical perspective, the bullish wave should resume after a minor consolidation below the $0.347 immediate resistance. In this scenario, the next bullish target could be the $0.358 resistance area (FVG) if bulls stabilize the price above the immediate resistance. 

Please note that the bullish scenario should be invalidated if ADA/USD falls below the $0.338 immediate support. If this scenario unfolds, a new bearish wave will likely be triggered, targeting $0.33 followed by $0.323.

Re: FxNews.me — Technical Analysis

EURUSD Faces Strong Resistance at 1.087

https://i.postimg.cc/FRPVQScY/1.png

FxNews.me—The EUR/USD currency pair tested the 100-period simple moving average at approximately 1.087 in today's trading session. This level was backed by Fair Value Gap, making it a robust barrier that can halt the bullish momentum. 

Consequently, the price bounced from the 100-period SMA. From a technical standpoint, immediate resistance is at $1.087. If bears maintain a position below that mark, the downtrend will likely revisit $1.076. 

Conversely, a cross above the 100-SMA invalidates the bearish outlook.

Re: FxNews.me — Technical Analysis

GBP/USD Tests Key Resistance: Will It Break or Retreat?

https://i.postimg.cc/GpW21ktP/1.png

FxNews.me—The GBP/USD currency pair broke above the descending trendline, testing the 100-period simple moving average as resistance. 

Currently, the market is uncertain. The 4-hour chart formed a long wick bullish and bearish candlestick pattern one after another. Therefore, the next wave depends on whether the price exceeds the primary resistance at $1.304 or falls below the immediate support at $1.293.

On the bullish side, if GBP/USD closes above 1.304, which is backed by the 100-SMA, the consolidation phase has the potential to extend to the next resistance area at 1.311, followed by 1.315. 

Conversely, the bearish trend will likely be triggered if bears push the price below the $1.293 support. If this scenario unfolds, the next target could be the $1.287 mark.

Re: FxNews.me — Technical Analysis

EUR/USD Tests Key Resistance Trading at 1.087

https://i.postimg.cc/GpW21ktP/1.png

FxNews.me—The EUR/USD price trades at approximately 1.087, testing the October high as resistance, backed by the 100-period simple moving average. 

Concurrently, the Stochastic Oscillator is overpriced, indicating that the Euro is overpriced in the short term. That being said, the Awesome Oscillator recently turned red, suggesting that the bear market is gaining more momentum. 


Forecast

From a technical perspective, the downtrend should resume if the immediate resistance at 1.087 holds. In this scenario, EUR/USD is likely to revisit the October low at 1.076. 

Please note that the bearish outlook should be invalidated if EUR/USD exceeds the 100-period SMA at 1.087. If this scenario unfolds, the rise from 1.076 could extend to 1.095.

Re: FxNews.me — Technical Analysis

Euro Faces Pressure: Key Indicators to Watch Now

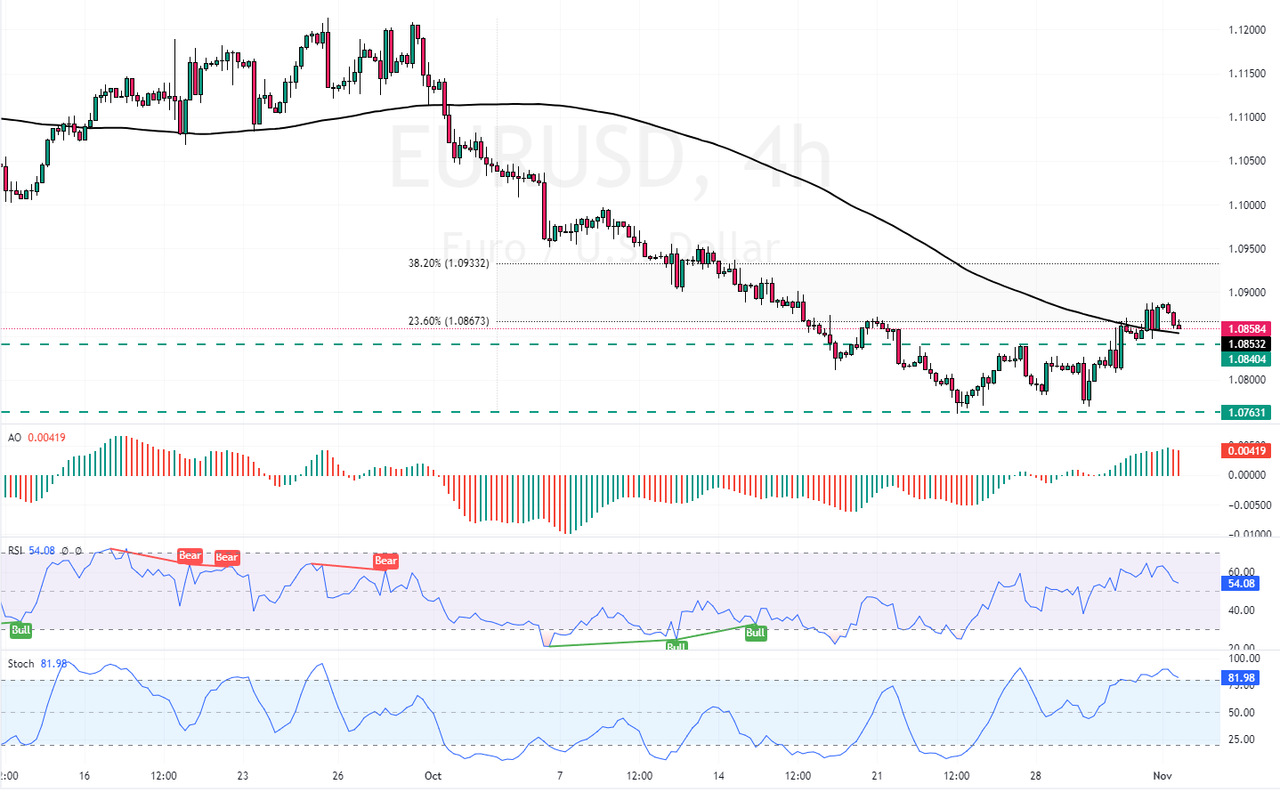
https://i.postimg.cc/RhCcNYgb/EURUSD-2024-11-01-12-49-05-b163d.png

FxNews.me—The EUR/USD currency pair stabilizes above the 100-period simple moving average and the 1.084 immediate support level. This occurs as Stochastic records show a reading of 82, indicating that the Euro is overpriced in the short term. Additionally, the Awesome Oscillator histogram is red, suggesting that the bear market is strengthening.

From a technical perspective, the bullish outlook remains valid as long as the price holds above the 1.085 support level. In this scenario, the next target could be the 38.2% Fibonacci retracement level at 1.093.

Please note that the bullish outlook should be considered invalid if the price dips below 1.084.

Re: FxNews.me — Technical Analysis

Cardano Bear Trend Deepens if Price Drops Below $0.334

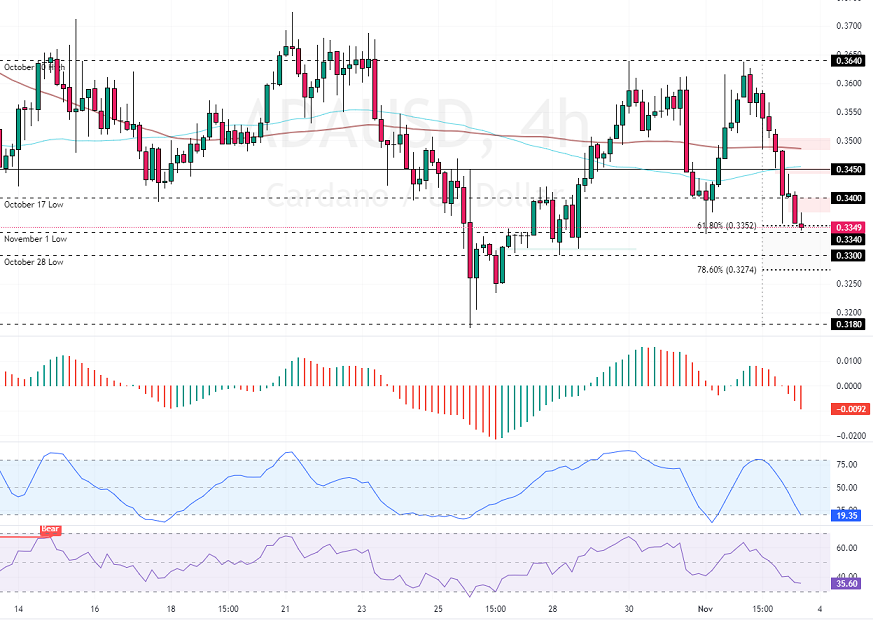
https://i.postimg.cc/Rh1PbK8J/ADAUSD-2024-11-03-16-10-02-7103b.png

FxNews.me—The immediate support is at $0.334, neighboring the 61.8% Fibonacci retracement level. The Cardano bearish trend would resume if bears (sellers) close and stabilize Solana's price below $0.334. In this scenario, the next bearish target could be the October 28 low at $0.33, followed by $0.327, the 78.6% Fibonacci retracement level.

Please note that the bearish outlook should be invalidated if the price exceeds the 50-period simple moving average of approximately $0.345.

Re: FxNews.me — Technical Analysis

GBPUSD Bounces from 100-SMA as UK Inflation Nears 2.6%

https://i.ibb.co/tK9SQ6n/5.png

The GBP/USD primary trend remains bearish as long as the price is below the 38.2% Fibonacci retracement level. If that level holds, the downtrend will likely resume. In this scenario, the GBP/USD pair could target 1.293, followed by 1.287.

Re: FxNews.me — Technical Analysis

Bitcoin Drops Below Key Level: Is $66K the Next Target?

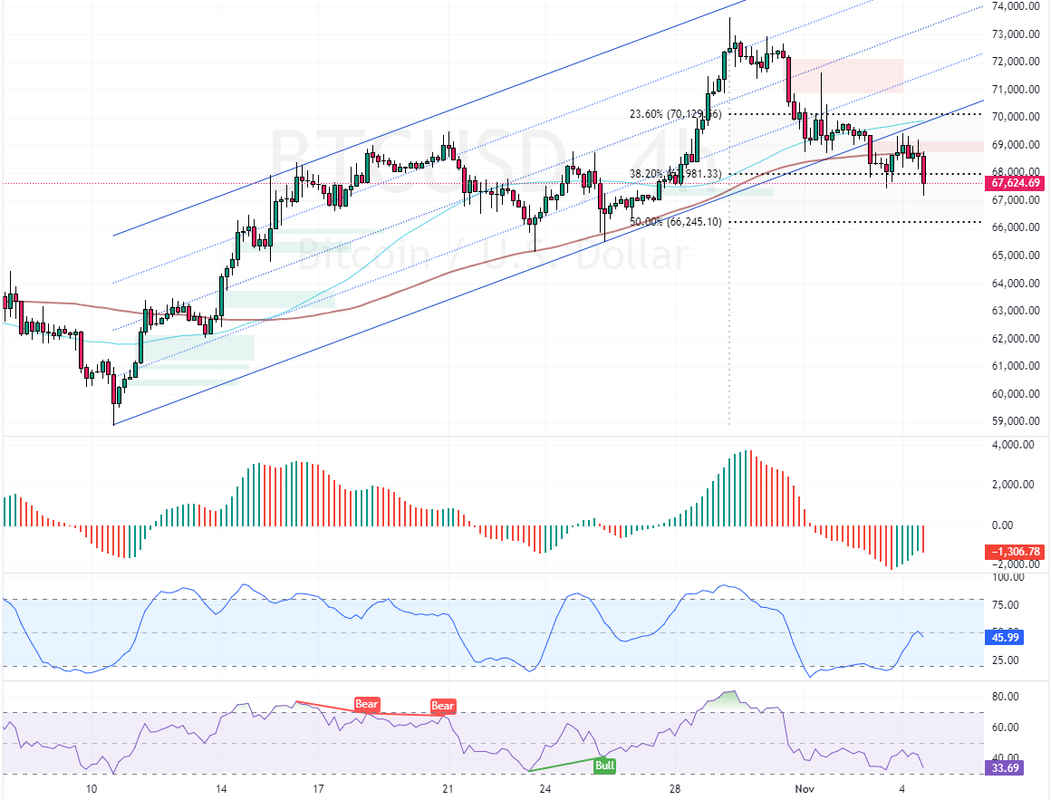
https://i.postimg.cc/9Mxzx6Q3/BTCUSD-2024-11-04-21-48-04-c0a03.png

FxNews.me—Bitcoin dipped below the 38.2% Fibonacci retracement level after the price tested the bearish Fair Value Gap in conjunction with the broken trendline. Furthermore, the Awesome Oscillator histogram turned red, hinting at the downtrend strengthening.

From a technical perspective, the next bearish target should be the 50% Fibonacci level at $66,000. Please note that the bearish strategy should be invalidated if BTC/USD exceeds $70,000.

Re: FxNews.me — Technical Analysis

USD/CHF FVG Bearish Gap Hints at Stronger Downtrend

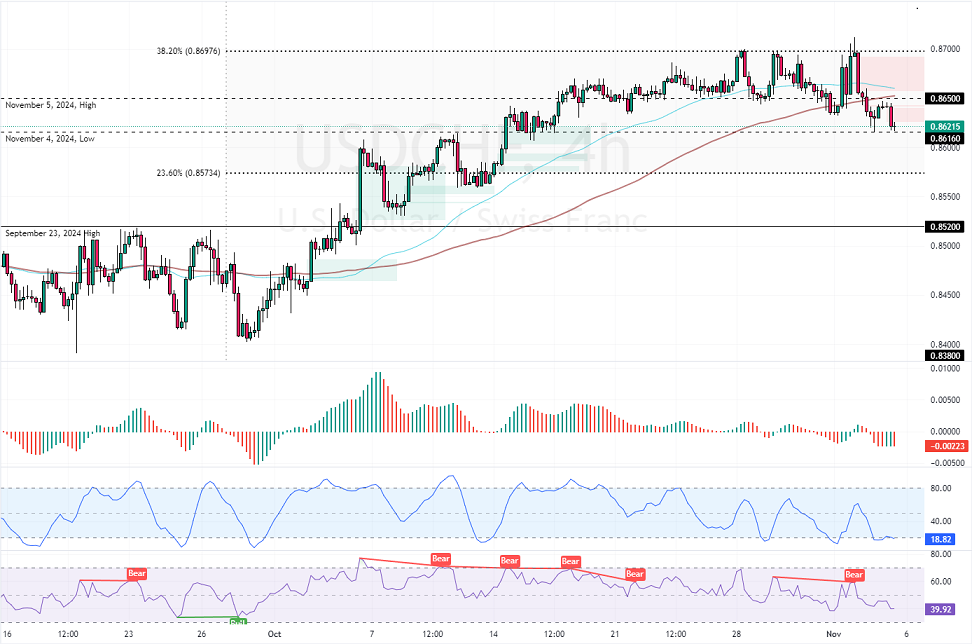
https://i.postimg.cc/1RKwJ4bk/USDCHF-2024-11-05-14-18-40-dd9dd.png

FxNews—USD/CHF tested the 100-period simple moving average. Consequently, the 4-hour price chart formed a bearish fair value gap, indicating that the bear market is strengthening. Additionally, the AO histogram turned red, suggesting the downtrend should resume.

The immediate support rests at the November 4 low, the 0.861 mark. From a technical perspective, the downtrend should continue if USD/CHF closes below 0.861. In this scenario, the bearish trend will likely extend to the 23.6% Fibonacci support level at 0.857.

Please note that the bearish outlook will be invalidated if USD/CHF closes and stabilizes above the 0.865 immediate resistance.

Re: FxNews.me — Technical Analysis

Ethereum Eyes $2,480 Break with Double Bottom Pattern

https://i.postimg.cc/TYr9GX2r/ETHUSD-2024-11-05-20-00-29-a99f0.png

FxNews.me—Ethereum has formed a double bottom pattern and is currently testing the $2,480 resistance level. Meanwhile, the Awesome Oscillator signals divergence with green bars approaching the zero line from below. This development in the price action and the AO indicator suggests that Ethereum’s price has the potential to rise further.

From a technical perspective, the bullish wave could resume if ETH/USD exceeds $2,480. In this scenario, the next bullish target could be the $2,560 resistance level.

Conversely, a dip below the $2,380 support would invalidate the bullish outlook.

Re: FxNews.me — Technical Analysis

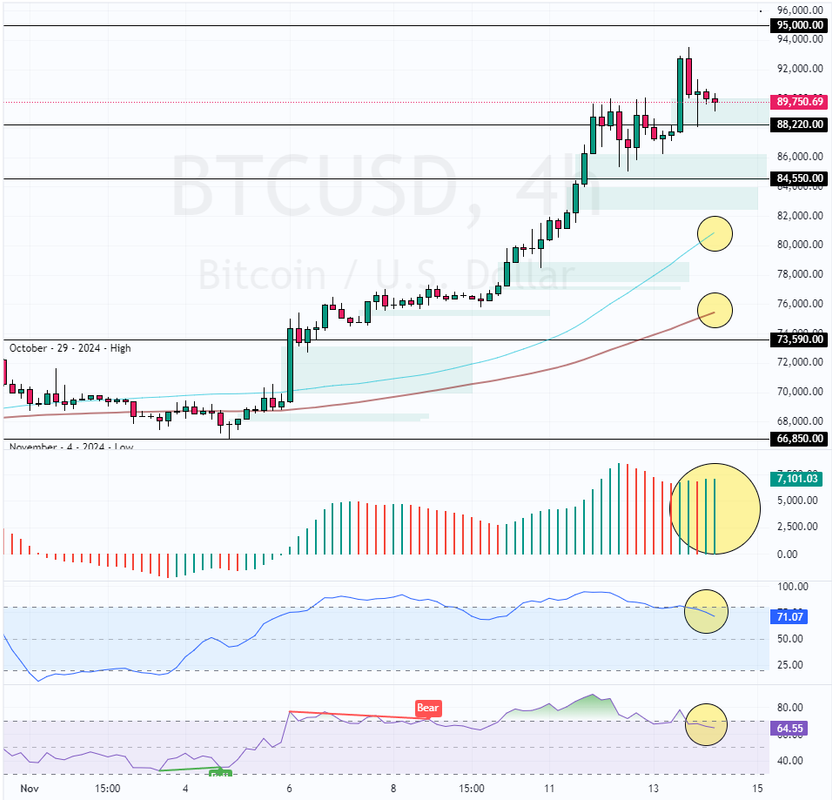
Bitcoin could target $95,000

https://i.postimg.cc/B6TD11cD/BTCUSD-2024-11-14-10-32-52-12175.png

FxNews.me—Bitcoin has tested the bullish fair value gap at approximately $88.220, which provides active immediate support. From a technical perspective, this level is a crucial pivot point. 

If bears close below this level, a new consolidation phase could begin, potentially targeting $84,500. On the flip side, if the immediate resistance holds, a new bullish wave will likely emerge, potentially targeting $95,00.

Re: FxNews.me — Technical Analysis

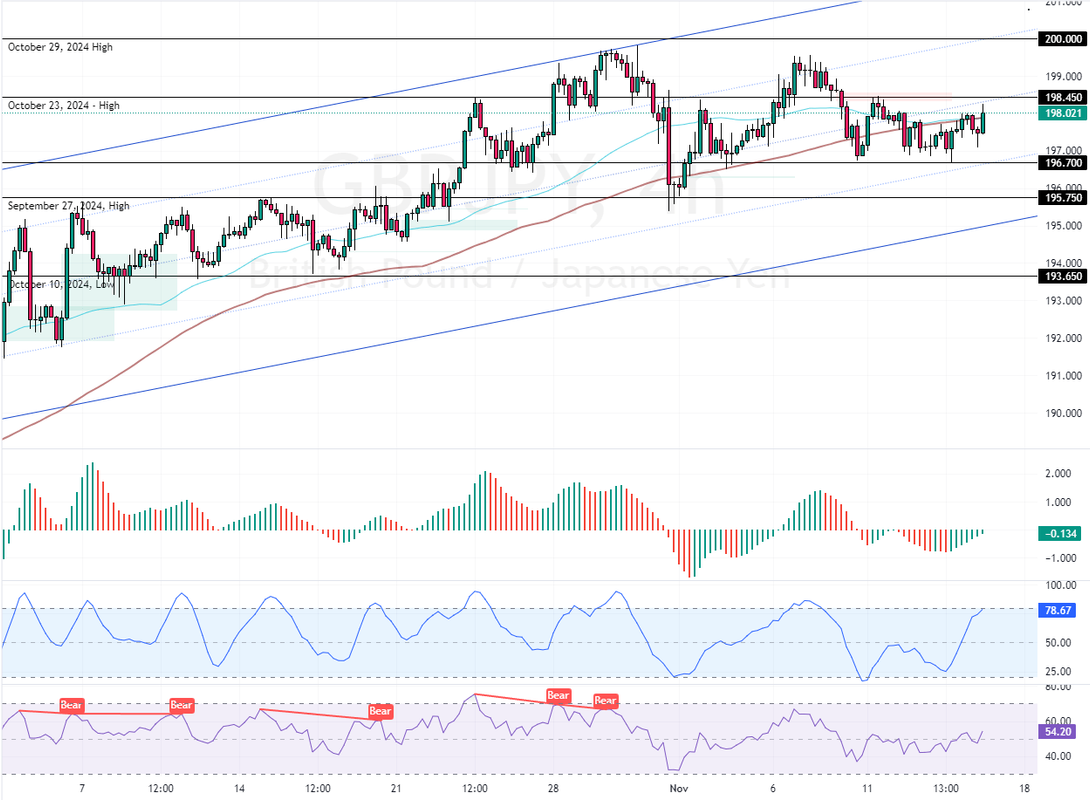
GBPJPY Poised to Break 198 Amid Japanese Stock Dip

https://i.postimg.cc/ryrcJSDX/GBPJPY-2024-11-14-19-32-42-61cc1.png

GBP/JPY is nearing a pivotal breakout at 198.45 resistance, with the potential to retest the October high of 200.0 as the next target.

Re: FxNews.me — Technical Analysis

Natural Gas Prices Dip to $2.4 After EIA Report Surprise

NATGAS dipped as reports show a surplus in the Natural Gas reserves and a warmer weather forecast for November. 

The stochastic is oversold, which could cause the Natural Gas price to target $2.56. A dip below the 50-SMA invalidated the bullish outlook.

Re: FxNews.me — Technical Analysis

Watch Silver as It Approaches $30.7 Resistance

FxNews.me—Silver remains oversold but is nearing the $30.7 resistance level, gaining upward momentum as indicated by the Stochastic's move out of the oversold territory.

The trend outlook will stay bearish as long as silver prices remain below the October 17 low of $31.35. Should silver close above the immediate resistance at $30.76, it might aim to test the 50-period simple moving average as its next resistance.

Re: FxNews.me — Technical Analysis

GBPUSD Nears Key 1.261 Mark Amid Oversold Signals

GBP/USD is testing 1.261 resistance in a robust bear market. If resistance holds, it could drop to 1.245. 

fxnews.me

Re: FxNews.me — Technical Analysis

NZD/USD Downtrend Deepens Past August Lows

NZD/USD falls below the 100-SMA, breaching August lows. The bearish trend continues, with resistance at $0.581, targeting the October low at $0.577.

Re: FxNews.me — Technical Analysis

USD/JPY Potential Rise to 161.9 on Breakout

USD/JPY could initiate a bullish run toward 161.9 if it stabilizes above the 157.5 resistance level. Watch for potential gains.

Posts: 26 to 50 of 166

Pages Previous 1 2 3 4 7 Next

You must login or register to post a reply

Forex Software → Market Analysis → FxNews.me — Technical Analysis

Similar topics in this forum