forex software

Create and Test Forex Strategies

forex software

Skip to forum content

Forex Software

Create and Test Forex Strategies

You are not logged in. Please login or register.


(Page 4 of 4)

Forex Software → Market Analysis → Daily Market Forecast By Capitalcore

Pages Previous 1 2 3 4

You must login or register to post a reply

RSS topic feed

Posts: 76 to 77 of 77

76 (edited by Capitalcore 2024-10-02 23:28:35)

Re: Daily Market Forecast By Capitalcore

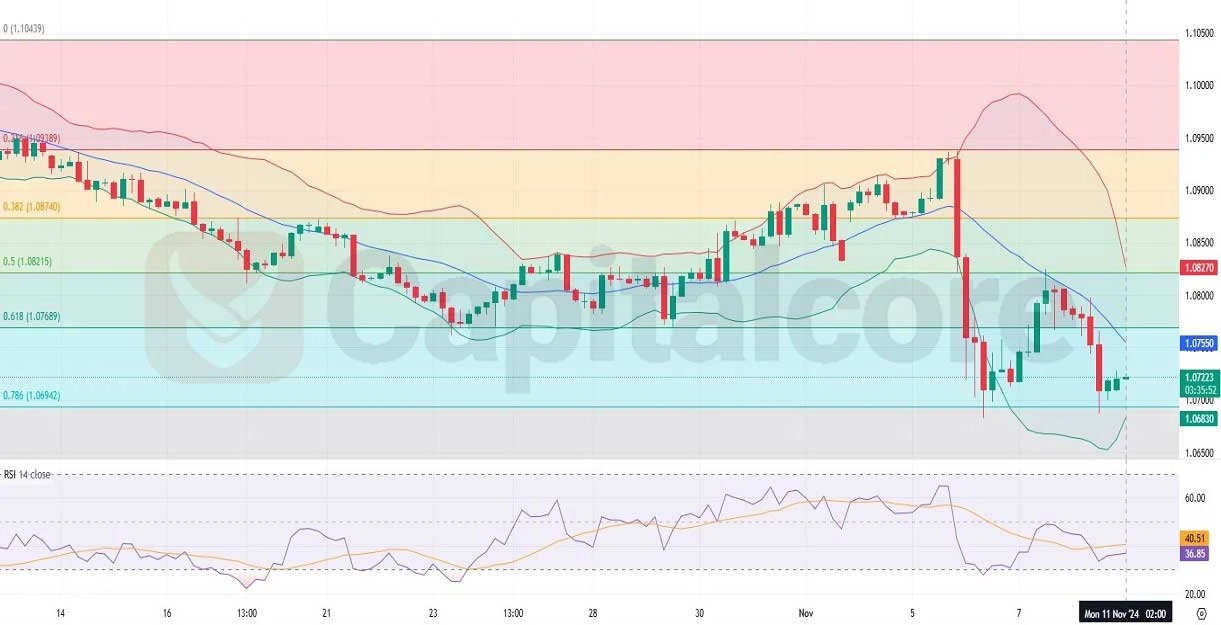
EUR/USD Forex Pair Outlook: H4 Chart Insights

The EUR/USD forex pair, often called the "Fiber," is one of the most widely traded currency pairs globally, representing the strength of the Euro against the U.S. dollar. Forex traders closely watch macroeconomic indicators from both economies, including inflation, interest rates, and economic growth metrics, as they are key drivers of EURUSD market movements. Today, a key focus for EUR/USD traders is the Purchasing Managers’ Index (PMI) from both the Eurozone and the U.S. A PMI reading above 50 for the Eurozone indicates economic expansion, while a figure below 50 would signal contraction, likely affecting the euro's strength. Meanwhile, U.S. labor data, particularly the jobless claims report, can influence the dollar depending on how the figures compare to market forecasts.
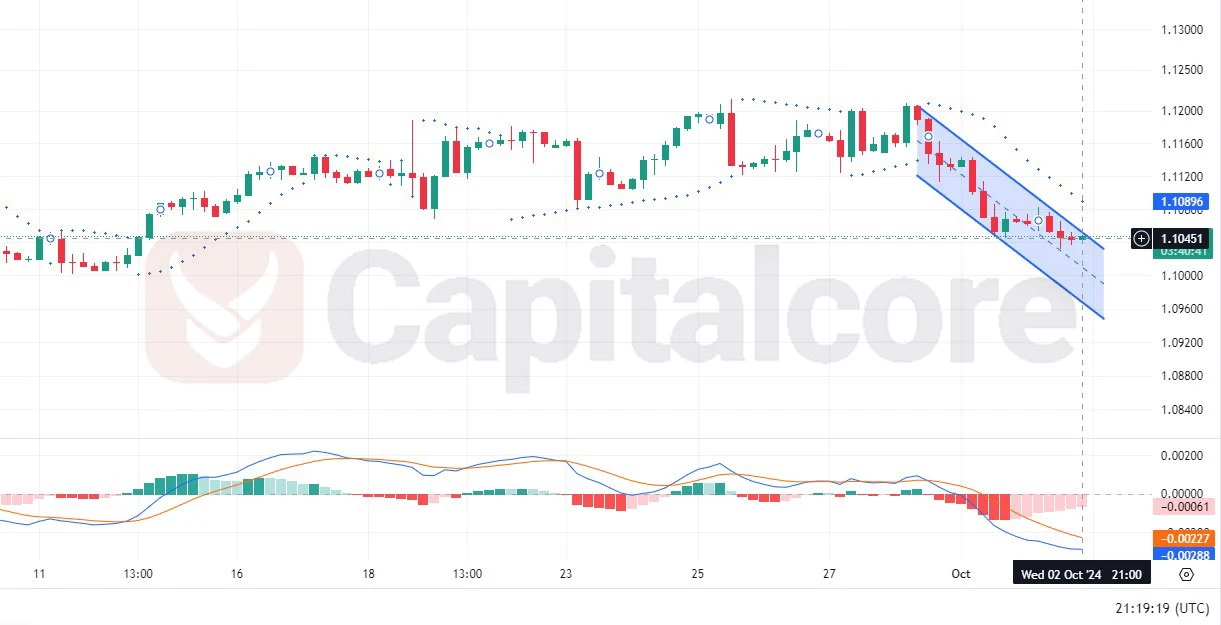
https://capitalcore.com/wp-content/uploads/2024/10/EURUSD-H4-Chart-Analysis-for-10.03.2024.webp
Chart Notes:
• Chart time-zone is UTC (+03:00)
• Candles’ time-frame is 4h.

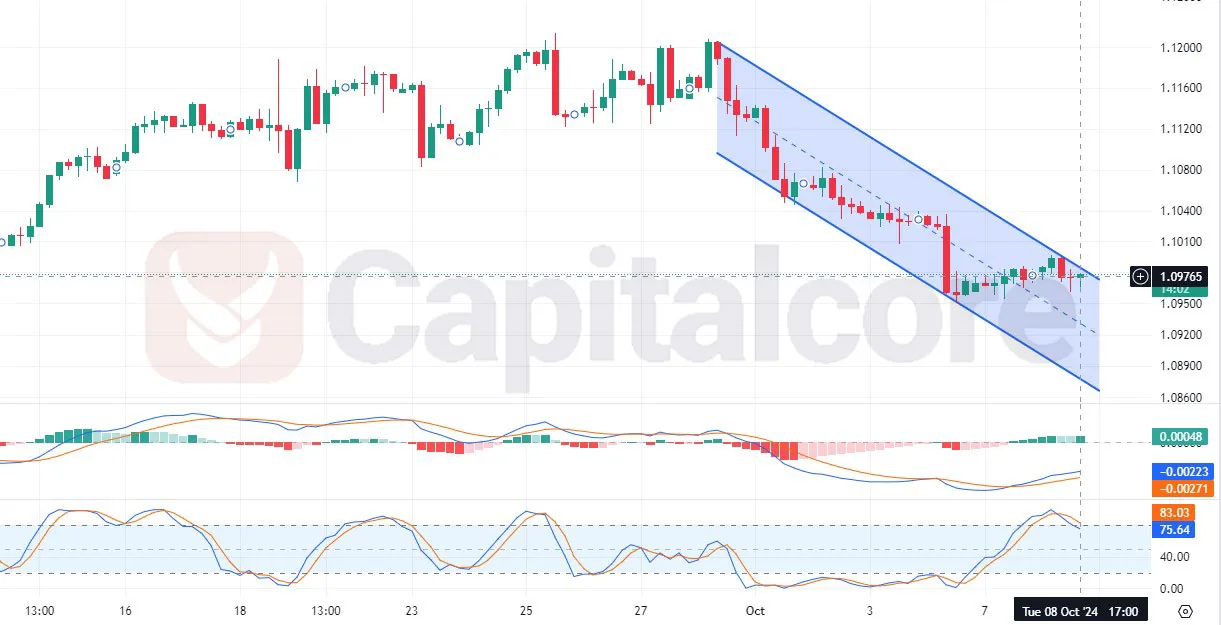
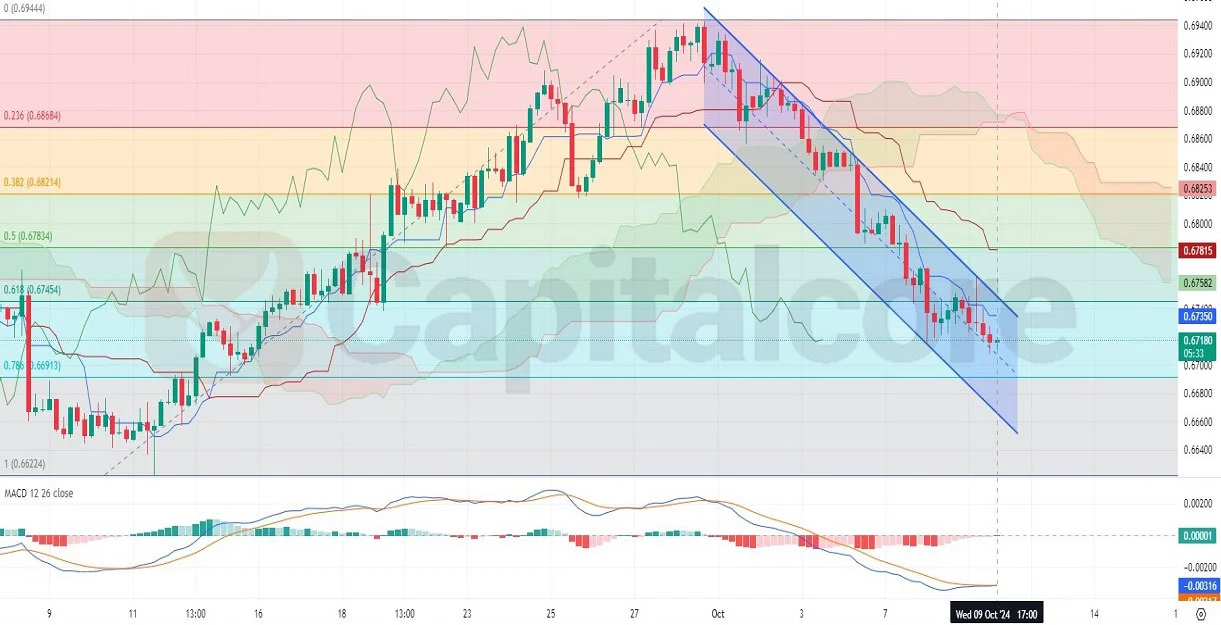
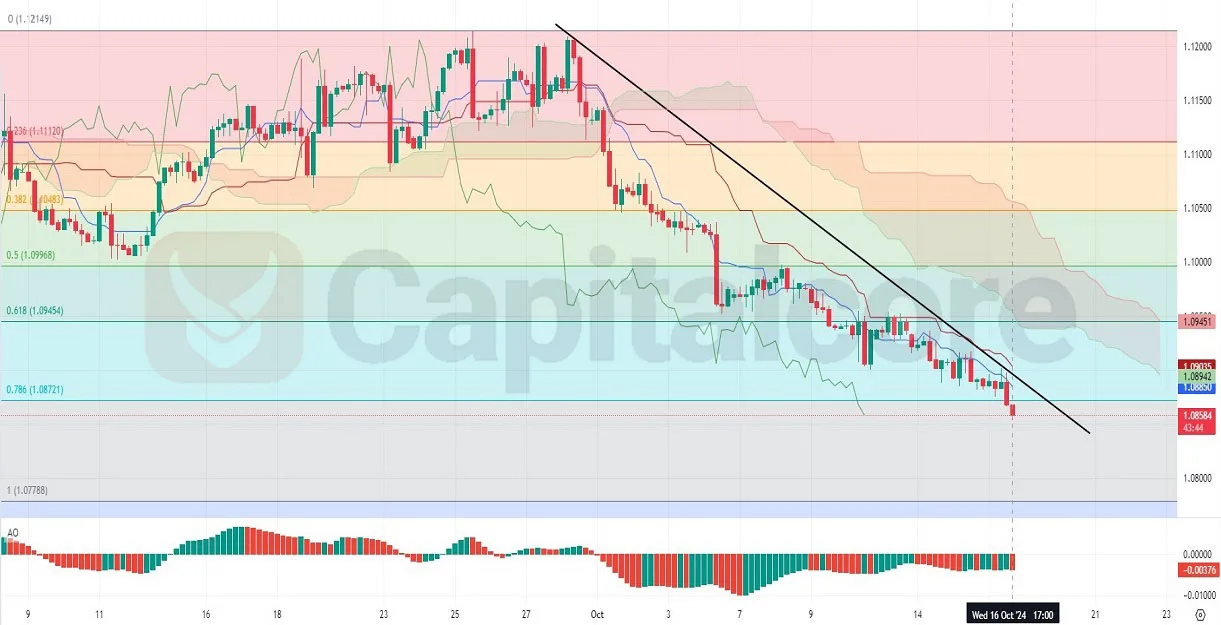
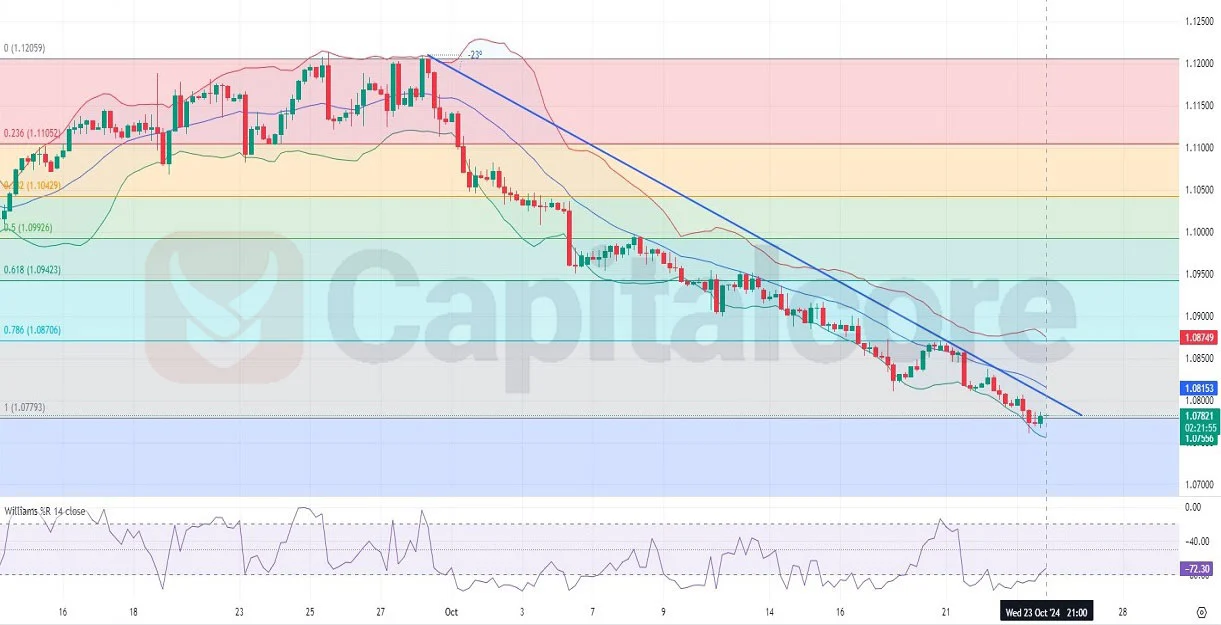
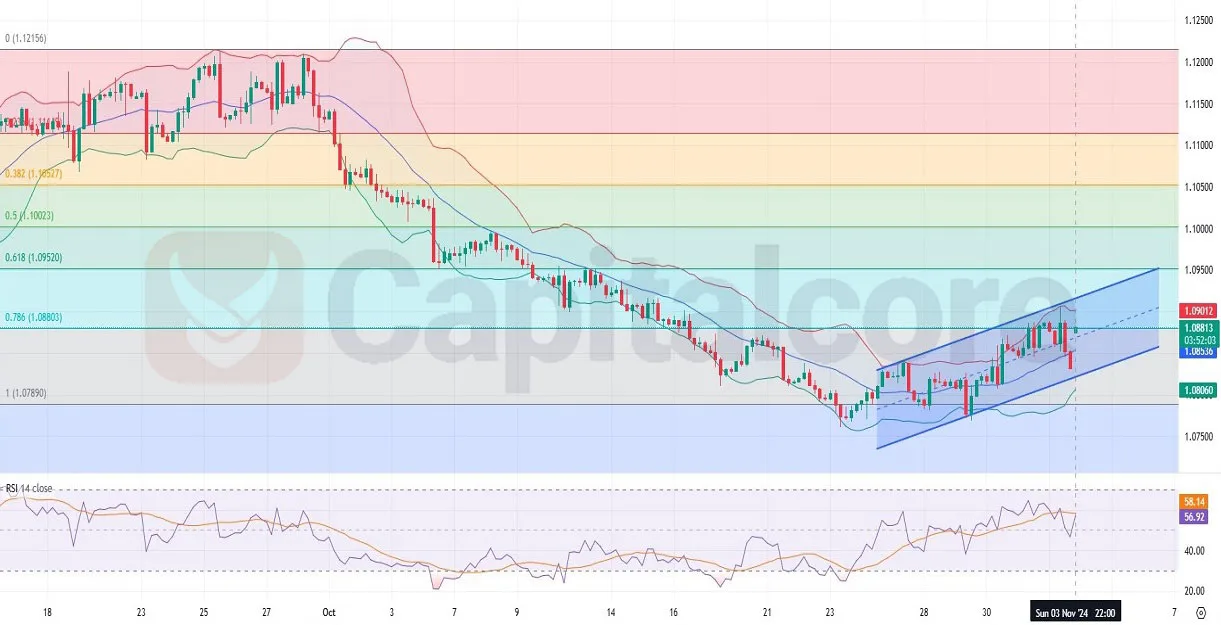
On the EUR/USD H4 chart, the pair’s price action shows a clear downtrend within a descending channel. The last five candles have displayed mixed momentum, with three bullish green candles followed by two bearish red candles. The Parabolic SAR dots are positioned above the price, indicating continued selling pressure and the Fiber’s bearish outlook. Additionally, the MACD indicator is showing a bearish bias, with the histogram in negative territory and both the MACD and signal lines trending downward. This suggests that the bearish momentum may persist in the near term as long as the price remains under pressure from both the Parabolic SAR and the weakening MACD.

DISCLAIMER: Please note that the above analysis is not an investment suggestion by “Capitalcore LLC”. This post has been published only for educational purposes.

Capitalcore

Re: Daily Market Forecast By Capitalcore

USD/CAD Bullish Momentum on H4 Chart

The USD CAD currency pair, also known as the "Loonie," represents the exchange rate between the US dollar (USD) and the Canadian dollar (CAD). As a major forex pair, it is influenced by a variety of economic factors from both countries, including energy prices, monetary policies, and economic data releases. The Loonie pair is often traded by investors looking to capitalize on the strength or weakness of the US dollar relative to the Canadian dollar, with a particular focus on macroeconomic trends and oil price fluctuations.
Today's economic calendar includes significant data releases such as the US Non-Farm Payrolls (NFP) and Unemployment Rate, which are likely to have a strong impact on USD performance. An increase in NFP or a lower-than-expected Unemployment Rate would bolster the USD, potentially pushing USDCAD price higher, while weaker-than-expected data could weigh on the currency. Meanwhile, Canada’s Ivey PMI, a key gauge of business conditions, is also in focus. A stronger-than-forecast reading from the PMI would be bullish for the CAD, potentially limiting any USD strength. Additionally, hawkish comments from John Williams of the Federal Reserve could boost the dollar as traders anticipate tighter monetary policy in the future. All these factors create a high level of volatility in the USD/CAD market, making today a key moment for traders of the pair.
https://capitalcore.com/wp-content/uploads/2024/10/H4-USDCAD-Chart-Technical-and-Fundamental-Analysis-on-10.04.2024.webp
Chart Notes:
• Chart time-zone is UTC (+03:00)
• Candles’ time-frame is 4h.

On the technical side, the USD/CAD H4 chart shows a clear bullish trend, with 8 of the last 10 candles closing in the green. The price is currently testing the 0.382 Fibonacci retracement level at 1.35534, with bullish momentum pushing towards higher levels. The MACD histogram is showing increasing bullish momentum, and the MACD lines are in the process of a bullish crossover, signaling continued upward pressure. The Awesome Oscillator (AO) is also positive, reinforcing the bullish sentiment. The USD/CAD price is trading within a rising channel, indicating a steady uptrend, and if it breaks through the 0.382 Fibonacci level, the next resistance is likely at the 0.236 level around 1.35800. Overall, the chart signals potential further upside, but the 1.35534 level remains a crucial hurdle for bulls to overcome.

DISCLAIMER: Please note that the above analysis is not an investment suggestion by “Capitalcore LLC”. This post has been published only for educational purposes.

Capitalcore

Posts: 76 to 77 of 77

Pages Previous 1 2 3 4

You must login or register to post a reply

Forex Software → Market Analysis → Daily Market Forecast By Capitalcore

Similar topics in this forum