forex software

Create and Test Forex Strategies

forex software

Skip to forum content

Forex Software

Create and Test Forex Strategies

You are not logged in. Please login or register.


(Page 3 of 3)

Forex Software → Market Analysis → Daily Market Forecast By Capitalcore

Pages Previous 1 2 3

You must login or register to post a reply

RSS topic feed

Posts: 51 to 72 of 72

Re: Daily Market Forecast By Capitalcore

Gold (XAU/USD) H4 Technical Analysis and Market Outlook

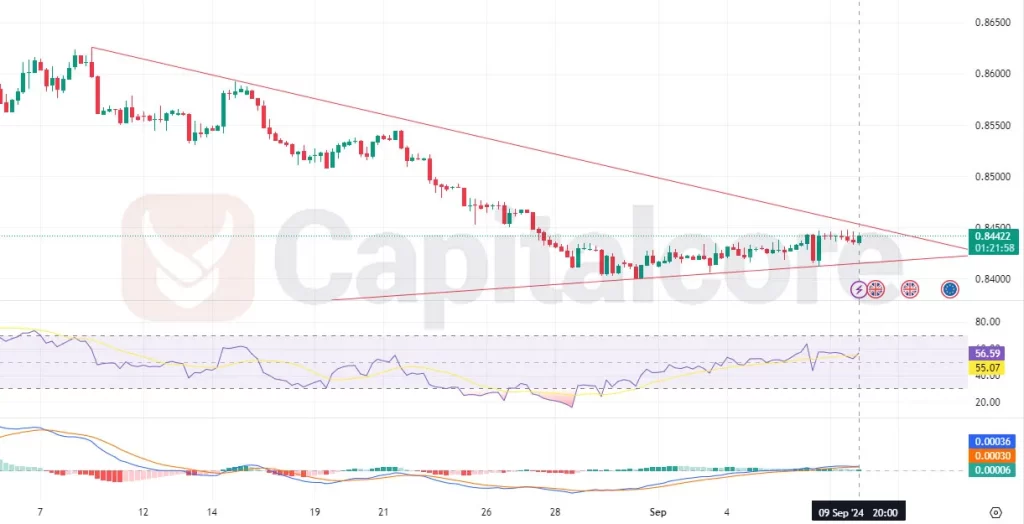
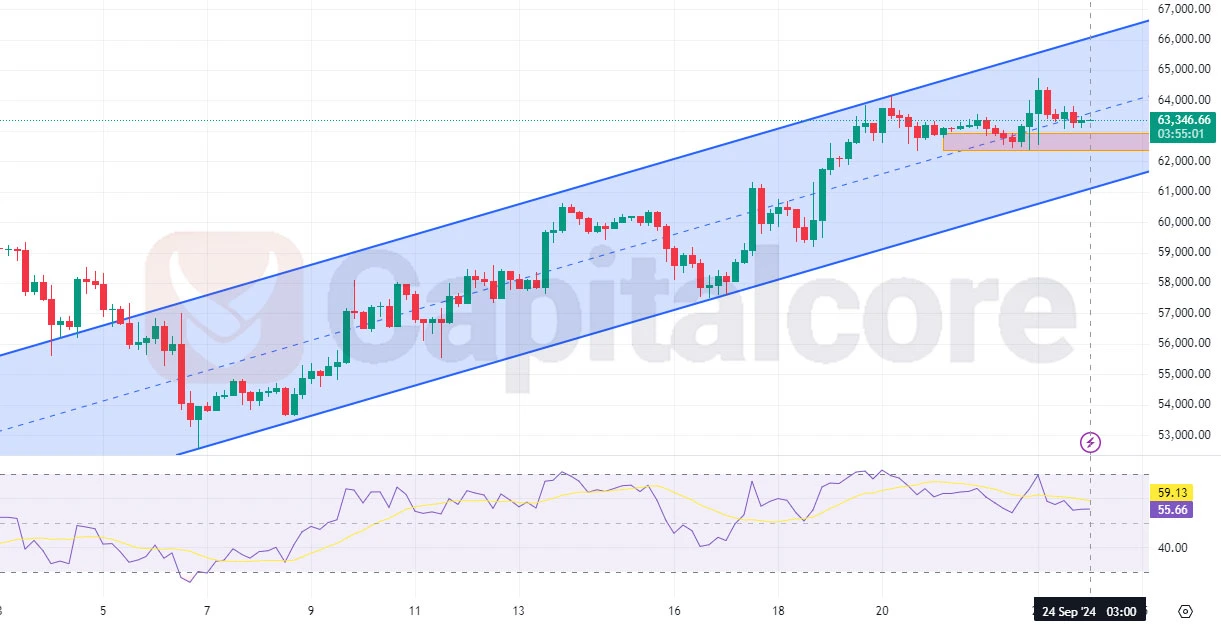
Gold, often referred to by its trading symbol XAU/USD, has recently surged to a new all-time high (ATH), capturing the attention of traders and investors worldwide. The H4 chart reveals an ascending triangle pattern, typically a bullish continuation pattern, suggesting potential for further upward movement. However, the price is currently testing the upper resistance line of this triangle around the $2,517 level, indicating a critical point where the market may decide on its next direction.
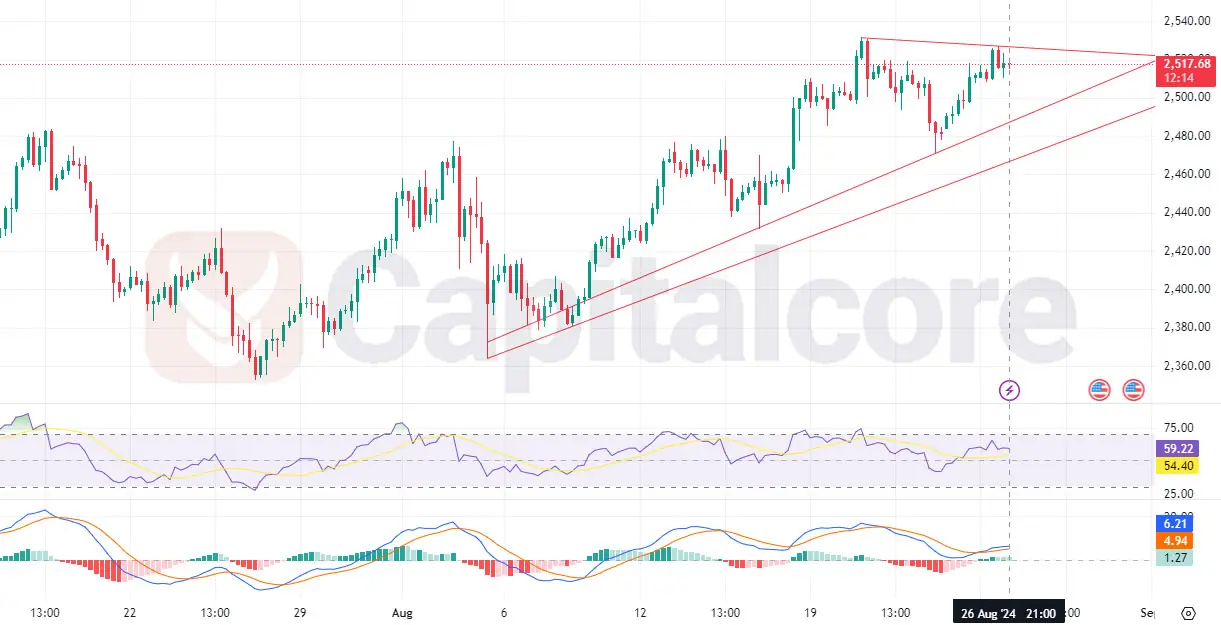
https://capitalcore.com/wp-content/uploads/2024/08/gold.webp
Chart Notes:
• Chart time-zone is UTC (+03:00)
• Candles’ time-frame is 4h.

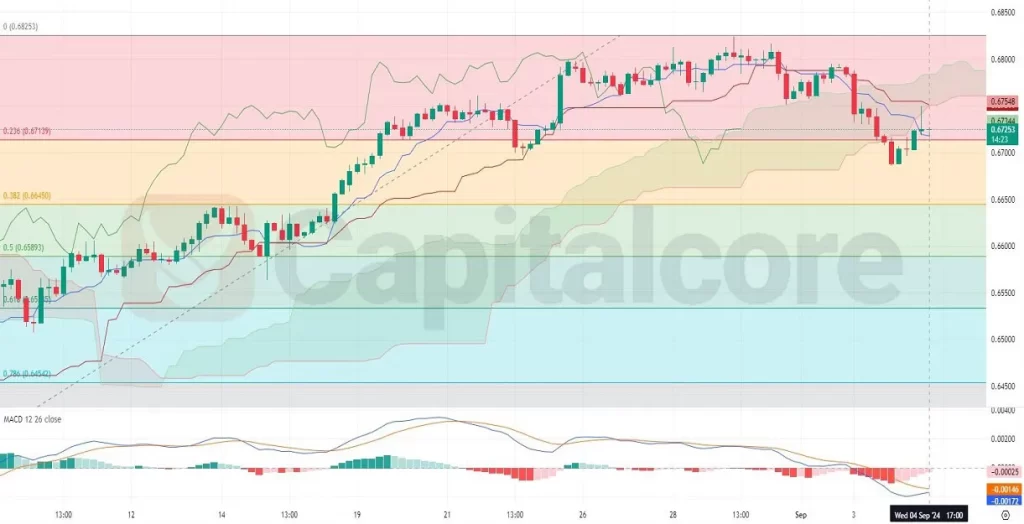
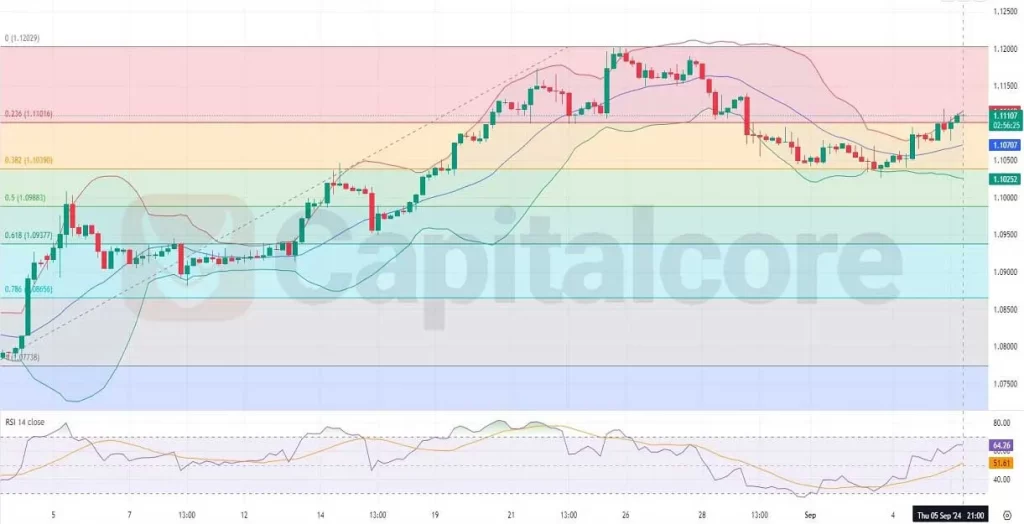
The RSI (Relative Strength Index) is positioned near 59, showing that the market is not yet overbought, providing room for further bullish action. Meanwhile, the MACD (Moving Average Convergence Divergence) histogram is positive, with the MACD line trending above the signal line, both signs of sustained bullish momentum. The upcoming economic data releases today could influence gold’s price action, with traders closely watching for cues that could either confirm a breakout above the current resistance or a potential pullback towards support around the $2,460 level. These movements are crucial for those involved in gold price analysis, prediction, and tracking price action around its recent ATH.

• DISCLAIMER: Please note that the above analysis is not an investment suggestion by “Capitalcore LLC”. This post has been published only for educational purposes.

Capitalcore

Re: Daily Market Forecast By Capitalcore

EUR/GBP: Key Support Levels in Focus

The EUR/GBP pair, commonly referred to as the “Chunnel,” is a widely traded currency pair that represents the exchange rate between the Euro and the British Pound. Currently, this pair is experiencing a bearish trend, evident in its movement on the H4 chart. The price has been steadily declining, breaking below key Fibonacci retracement levels, with the 0.618 level at 0.84757 unable to hold as support. This downward movement is further confirmed by the MACD indicator, which shows negative divergence, with the MACD line below the signal line and histogram bars in negative territory. Additionally, the RSI is firmly in the oversold zone, around 20, indicating strong selling pressure, although it may also suggest that this bearish momentum could be overextended.
https://capitalcore.com/wp-content/uploads/2024/08/eurgbp-1.webp
Chart Notes:
• Chart time-zone is UTC (+03:00)
• Candles’ time-frame is 4h.
Given this technical setup, the EUR/GBP pair is likely to face continued downward pressure unless there is a clear bullish reversal. Traders should keep an eye on critical support levels near 0.84293, where the price is currently consolidating. A decisive break below this support could lead to further declines, aligning with the bearish outlook highlighted by both the MACD and RSI indicators. For those following “EUR/GBP technical analysis,” “EUR/GBP bearish trend,” and “EUR/GBP support levels,” these indicators and price movements provide valuable insights into potential market behavior and trading opportunities.

• DISCLAIMER: Please note that the above analysis is not an investment suggestion by “Capitalcore LLC”. This post has been published only for educational purposes.

Capitalcore

Re: Daily Market Forecast By Capitalcore

EUR/USD Price Action Analysis Ahead of Key Events

The EUR/USD forex pair, often referred to by its nickname "Fiber," is the most traded currency pair in the world, representing the exchange rate between the Euro (EUR) and the US Dollar (USD). Today’s fundamental analysis revolves around key upcoming events, including speeches from influential figures like Raphael Bostic of the Federal Reserve and Joachim Nagel of the Deutsche Bundesbank. These events are expected to provide insights into future monetary policies, with hawkish tones likely benefiting their respective currencies. Additionally, US economic data releases on GDP, unemployment claims, and trade balance will be closely monitored by traders for further indications on economic health and potential interest rate adjustments. Such fundamental factors can drive volatility in the EUR USD forex pair, making these announcements critical for intraday trading strategies.
https://capitalcore.com/wp-content/uploads/2024/08/H4-EURUSD-Technical-Analysis-on-08.29.2024.webp
Chart Notes:
• Chart time-zone is UTC (+03:00)
• Candles’ time-frame is 4h.

The H4 chart of EURUSD, analyzed with Ichimoku Cloud, RSI, and Fibonacci retracement levels, indicates a consolidation phase after a recent downtrend. The price is currently moving between the 0 and 0.236 Fibonacci retracement levels, suggesting a corrective pullback. Following a touch of the 0.236 level, two bullish candles have emerged, indicating potential upward momentum. This recovery is further supported by the price trading above the Ichimoku Cloud, although it recently touched the upper cloud boundary before rebounding. The Relative Strength Index (RSI) is currently showing a value below 50, signaling a lack of strong bullish momentum. If the price continues to hold above the Ichimoku cloud and breaks above the 0.236 Fibonacci level, a further move upwards could be anticipated, whereas a failure to do so may signal a continuation of the bearish trend.

• DISCLAIMER: Please note that the above analysis is not an investment suggestion by “Capitalcore LLC”. This post has been published only for educational purposes.

Capitalcore

54 (edited by FXGLORY 2024-09-02 17:16:34)

Re: Daily Market Forecast By Capitalcore

Thanks for great content!

55 (edited by FXGLORY 2024-09-02 17:17:10)

Re: Daily Market Forecast By Capitalcore

You can also check FXGlory for daily analysis!

Re: Daily Market Forecast By Capitalcore

USD/JPY H4 Chart Signals Bullish Breakout

The USD/JPY currency pair, often referred to as the "Gopher," is a popular forex trading pair that tracks the exchange rate between the US Dollar and the Japanese Yen. It is one of the most traded currency pairs globally, offering high liquidity and volatility, making it a favorite among traders. Today's trading dynamics are likely to be influenced by economic indicators from both Japan and the US, including the Japanese Ministry of Finance's data on capital expenditures and the Jibun Bank Manufacturing PMI.
Fundamentally, the USD/JPY pair may experience increased volatility today due to key economic data releases. The Japanese capital expenditures report, a significant indicator of economic health, suggests that if the actual figures exceed the forecast, the Yen could strengthen as increased business investment signals optimism in the economy. Additionally, the Jibun Bank Manufacturing PMI is set to provide insights into Japan's manufacturing sector's health, with readings above 50 indicating expansion. However, with US banks closed for Labor Day, reduced liquidity in USD trading could result in erratic price movements. Traders should be cautious of potential spikes in volatility due to the lower trading volume, which might amplify reactions to the Japanese economic releases.
https://capitalcore.com/wp-content/uploads/2024/09/H4-Technical-analysis-on-USDJPY-09.02.2024--1024x524.webp
Chart Notes:
• Chart time-zone is UTC (+03:00)
• Candles’ time-frame is 4h.

From a technical perspective, the USD/JPY H4 chart indicates a light bullish trend, with recent price action dominated by bullish candlesticks. The pair is currently trading near the upper Bollinger Band, signaling strong upward momentum. The price has been oscillating between the middle and upper Bollinger Bands, suggesting a prevailing bullish sentiment. The Bollinger Bands are widening, which typically indicates increasing volatility. Furthermore, the price is situated between the 0.5 and 0.382 Fibonacci retracement levels, a zone that often serves as a resistance area. If the price breaks above this zone, it may continue its upward trajectory; otherwise, a reversal could be possible if the bearish candles gain dominance. The Willy indicator shows mixed signals but leans slightly towards overbought conditions, warranting caution for potential corrections.

• DISCLAIMER: Please note that the above analysis is not an investment suggestion by “Capitalcore LLC”. This post has been published only for educational purposes.

Capitalcore

Re: Daily Market Forecast By Capitalcore

NZDUSD Price Action Breaks Key Fibonacci Level

The NZDUSD, commonly referred to as the “Kiwi,” is a major forex pair consisting of the New Zealand Dollar (NZD) and the United States Dollar (USD). As a commodity currency pair, NZD/USD is influenced by global economic trends, commodity prices, and interest rate differentials. The pair is popular among traders for its liquidity and the potential for high volatility, often responding sharply to economic data and geopolitical developments.
Today’s key economic events could significantly impact the NZDUSD pair, particularly any updates related to New Zealand's trade balance, which plays a critical role in the currency's valuation. Positive data from New Zealand could strengthen the Kiwi, while any negative sentiment from the US market could drive the NZD USD forex pair lower. Additionally, any changes in the Federal Reserve’s stance on interest rates could also lead to volatility, as traders assess the future path of monetary policy in the US. Market participants will closely monitor these developments, which could set the tone for short-term price movements in the NZDUSD forex pair.
https://capitalcore.com/wp-content/uploads/2024/09/NZDUSD-H4-Technical-Analysis-on-09.03.2024-1024x524.webp
Chart Notes:
• Chart time-zone is UTC (+03:00)
• Candles’ time-frame is 4h.

The H4 chart of NZDUSD displays a clear bearish trend, with 13 out of the last 19 candles being bearish, including the most recent one. The price has moved from the upper Bollinger Band towards the middle band and then to the lower band, where it is currently hovering, indicating strong selling pressure. The expansion of the Bollinger Bands suggests increasing volatility, supporting the downward movement. The price has recently broken below the 0.236 Fibonacci retracement level and is now between the 0.382 Fibonacci level, highlighting a significant retracement from its recent highs. The RSI indicator is trending below 50 and approaching oversold territory, currently around 33.18, suggesting that while the bearish momentum is strong, there might be a potential for a short-term correction or consolidation before continuing its downward trajectory.

• DISCLAIMER: Please note that the above analysis is not an investment suggestion by “Capitalcore LLC”. This post has been published only for educational purposes.

Capitalcore

Re: Daily Market Forecast By Capitalcore

AUDUSD bullish reversal on the H4 chart

The AUD/USD currency pair, also known as the "Aussie," is one of the most traded forex pairs, representing the strength and dynamics of the Australian dollar against the US dollar. With Australia being a resource-rich economy and the US being the world’s largest economy, the AUD USD pair is influenced by commodity prices, interest rate differentials, and overall market risk sentiment. Today, the market's attention is focused on the upcoming news from the Australian Bureau of Statistics regarding trade balance, as well as speeches by RBA Governor Michele Bullock, which may offer clues on future monetary policy. Additionally, key USD economic indicators, such as job cuts and labor market data, will further impact the direction of this pair. If Australia’s export data beats expectations or the RBA signals hawkish intentions, the Aussie could strengthen, while weak US labor data could also support a rise in AUD/USD.
https://capitalcore.com/wp-content/uploads/2024/09/H4-AUDUSD-Technical-Analysis-on-09.05.2024-1024x524.webp
Chart Notes:
• Chart time-zone is UTC (+03:00)
• Candles’ time-frame is 4h.

Analyzing the AUD/USD H4 chart, we see several technical factors at play. The pair has been in a clear downtrend, moving from the 0 Fibonacci level down to below the 0.236 Fibonacci retracement level. However, the recent Aussie’s price action shows a recovery, with four out of the last five candles being positive, pushing the price above the 0.236 Fibonacci level. If this momentum continues, AUD/USD could aim to return to the 0 Fibonacci level. In terms of Ichimoku, the price dropped below the cloud but is now making an effort to re-enter and test it, indicating potential bullish momentum. Additionally, the MACD is showing signs of a possible bullish crossover, supported by a decreasing bearish histogram, which could signal further upward movement in the short term for AUD USD forex pair.

• DISCLAIMER: Please note that the above analysis is not an investment suggestion by “Capitalcore LLC”. This post has been published only for educational purposes.

Capitalcore

Re: Daily Market Forecast By Capitalcore

EURUSD H4 RSI and Fibonacci Levels in Focus

EUR/USD forex pair, often referred to as "Fiber," is one of the most traded currency pairs in the Forex market, reflecting the value of the Euro against the U.S. Dollar. This pair is highly influenced by the economic and political events in both the Eurozone and the United States, making it a vital indicator of the global economy's health. Today’s upcoming news includes significant economic reports from both the Eurozone and the U.S., which are expected to impact the direction of EUR/USD price.
From a fundamental perspective, key reports from the Eurozone, such as industrial output, foreign trade balance, and employment data, will be essential to monitor. Better-than-expected results could strengthen the Euro, especially if industrial output and foreign trade data outperform forecasts, indicating robust economic health. On the U.S. side, the upcoming Non-Farm Payrolls (NFP) and unemployment rate data are likely to dictate the market's sentiment toward the U.S. Dollar. A positive NFP figure would indicate a stronger labor market, potentially boosting the Dollar. Additionally, speeches from key Federal Reserve officials, like John Williams and Christopher Waller, may provide clues on future U.S. monetary policy. Any hints of further interest rate hikes could support the Dollar, pressuring the EUR/USD lower.
https://capitalcore.com/wp-content/uploads/2024/09/H4-EURUSD-Technical-And-Fundamental-Analysis-On-09.06.2024-1024x524.webp
Chart Notes:
• Chart time-zone is UTC (+03:00)
• Candles’ time-frame is 4h.

In the technical analysis based on the EUR/USD H4 chart, the pair is showing a clear uptrend, supported by the last three bullish candles. The price is currently moving from the middle Bollinger Band toward the upper band, even touching the upper line. This suggests increasing volatility and a possible continuation of the upward movement. Additionally, the price has moved from the 0.382 Fibonacci retracement level to the 0.236 level and is now hovering near this point, showing potential to rise further toward the 0.0 Fibonacci retracement level. The Bollinger Bands are widening, indicating higher market volatility, while the RSI is gradually climbing, signaling further bullish momentum. If the price breaks the 0.236 Fibonacci level convincingly, the next target could be the 0.0 Fibonacci level around 1.12029, with strong support at the 1.1050 region.

• DISCLAIMER: Please note that the above analysis is not an investment suggestion by “Capitalcore LLC”. This post has been published only for educational purposes.

Capitalcore

Re: Daily Market Forecast By Capitalcore

USDJPY Technical Analysis Hints at Further Losses

The USDJPY forex pair, commonly referred to as "The Ninja," is known for its volatility and is a major currency pair in the global foreign exchange market. It represents the strength of the US Dollar (USD) against the Japanese Yen (JPY), making it sensitive to economic indicators from both Japan and the United States. As of today, traders are eyeing key economic data from Japan, including the Bank of Japan’s release on outstanding loans, the current account figures from the Ministry of Finance, and quarterly GDP data, all of which can influence the JPY. In the US, wholesale inventories and consumer credit data are expected, potentially impacting the USD. These reports, especially the GDP and loan data, could cause fluctuations in the USDJPY, as they reflect consumer confidence and economic growth in Japan, while inventory data may signal shifts in business spending in the US.
https://capitalcore.com/wp-content/uploads/2024/09/H4-Technical-and-Fundamental-Analysis-on-USDJPY-on-09.09.2024-1024x524.webp
Chart Notes:
• Chart time-zone is UTC (+03:00)
• Candles’ time-frame is 4h.

Analyzing the USDJPY H4 chart, we see a clear bearish trend, reinforced by the price being below the Ichimoku cloud, a strong indicator of downward momentum. The recent Fibonacci retracement levels further highlight the price’s fall below the 0.786 level, which suggests that a deeper retracement might be underway. The chart shows that 7 of the last 10 candles are bearish, with the last three continuing this pattern, signaling strong selling pressure. The RSI indicator is also trending lower, currently below 30, which suggests oversold conditions, though there may still be room for further downside movement. Overall, the USDJPY’s technical indicators point to continued bearish momentum in the short term, with potential support around the 1 Fibonacci level.

• DISCLAIMER: Please note that the above analysis is not an investment suggestion by “Capitalcore LLC”. This post has been published only for educational purposes.

Capitalcore

Re: Daily Market Forecast By Capitalcore

Bearish Pressure Mounts on EUR/GBP

The EUR/GBP, often referred to as the "Chunnel," represents the exchange rate between the Euro and the British Pound, two of Europe's most widely traded currencies. Currently, this pair is facing bearish pressure as it tests a descending trendline on the H4 chart. MACD signals are weakening, with the histogram declining and the signal line converging near the MACD line. Additionally, the RSI stands at 56.59, showing a neutral position but with a declining bullish slope. The recent price action hints at the potential for a bearish wave if the bullish trendline below the current price of 0.84422 fails to hold.
https://capitalcore.com/wp-content/uploads/2024/09/9-9-2024-1024x524.webp
Chart Notes:
• Chart time-zone is UTC (+03:00)
• Candles’ time-frame is 4h.

Upcoming economic data for both the Eurozone and the UK are key factors that could shift the market's predictions. With German Final CPI expected at -0.1% and UK employment data, including the Claimant Count Change and Unemployment Rate, traders should watch closely. A break below the bullish trendline could lead to increased bearish momentum, favoring sellers, while a hold above this level might provide temporary support for the bulls, though technical indicators currently suggest a bearish bias.

• DISCLAIMER: Please note that the above analysis is not an investment suggestion by “Capitalcore LLC”. This post has been published only for educational purposes.

Capitalcore

Re: Daily Market Forecast By Capitalcore

EUR/USD H4 Chart Analysis with MACD and Fibonacci

The EUR/USD forex pair, often referred to as "Fiber," is one of the most actively traded currency pairs in the forex market, representing the economies of the European Union and the United States. Its liquidity and volatility make it a favorite among traders, especially during times of major economic releases from either region. Today, key European and US data, such as the Eurozone Wholesale Price Index and the US Producer Price Index (PPI), will be the focal points, offering insights into inflationary pressures in both economies. Higher-than-expected PPI or Wholesale Price Index results could signal potential price increases passed on to consumers, impacting inflation and potentially affecting ECB or Fed rate decisions.
Fundamentally, the euro currency may see significant movement today, driven by the Wholesale Price Index (WPI) in the Eurozone and unemployment data from Istat, both of which indicate the broader economic health. Rising wholesale prices could further strain inflationary pressures, making the ECB's monetary policy increasingly important. On the US side, PPI data is crucial as it could signal inflationary changes, prompting traders to look for clues about the Fed’s future rate hikes. With the recent ECB decisions on rates and the looming US data, volatility is expected, especially if the data deviates significantly from forecasts.
https://capitalcore.com/wp-content/uploads/2024/09/H4-EURUSD-Technical-And-Fundamental_Analysis-on-09-12.2024-1024x524.webp
Chart Notes:
• Chart time-zone is UTC (+03:00)
• Candles’ time-frame is 4h.

The EUR/USD H4 chart displays a clear downtrend, as the price has been consistently bearish over the past four candles. It has descended from the upper Bollinger Band and is now hovering between the middle and lower bands, indicating increasing bearish pressure. The Bollinger Bands have widened slightly, suggesting potential for further price movement, with volatility picking up. The Fibonacci retracement levels show that the price is fluctuating between the 0.382 and 0.5 levels, highlighting a potential support area near the 1.09116 level. However, the MACD indicator shows bearish momentum, as the histogram bars are increasing in the negative region, signaling that the price could continue its downward movement.
As the Fiber price approaches the lower bands and key Fibonacci levels, traders should watch for a break below the 1.09116 level, which could trigger further selling pressure. However, a reversal near the middle Bollinger Band could suggest consolidation or potential bullish recovery if it holds support at the 0.5 Fibonacci level.

• DISCLAIMER: Please note that the above analysis is not an investment suggestion by “Capitalcore LLC”. This post has been published only for educational purposes.

Capitalcore

Re: Daily Market Forecast By Capitalcore

NZDUSD H4 Trading Strategy and Key Zones

The NZD/USD currency pair, often referred to by its nickname "Kiwi," is a popular pair in the forex market, representing the exchange rate between the New Zealand Dollar and the US Dollar. Traders and investors follow it closely due to New Zealand's commodity-based economy and the US Dollar's status as the world's reserve currency. Upcoming economic reports from both countries, including New Zealand's Performance of Manufacturing Index and the US Import Price Index and consumer sentiment from the University of Michigan, will likely influence market movements today.
Fundamentally, traders are paying attention to the US Import Price Index, which could indicate inflationary pressures, and the University of Michigan's consumer sentiment and inflation expectations, which provide insights into consumer spending and inflation outlooks. A higher-than-expected reading for both reports would be bullish for the USD, potentially pushing NZD/USD downward. However, New Zealand's PMI, if it shows expansion, could support the Kiwi, creating mixed signals for the pair. Traders should watch these reports as they will directly impact the pair's short-term direction, especially as inflation data becomes more critical in the context of central bank policies.
https://capitalcore.com/wp-content/uploads/2024/09/H4-NZDUSD-Technical-And-Fundamental_Analysis-on-09-13.2024.webp
Chart Notes:
• Chart time-zone is UTC (+03:00)
• Candles’ time-frame is 4h.

Technically, the NZD/USD H4 chart shows a bullish momentum building, as the pair is moving towards the Ichimoku cloud but still trades below it. The last three candles have been bullish, with the price currently sitting around the 0.382 Fibonacci retracement level. If the price can break above this level, there is potential for it to reach the 0.5 or 0.618 Fibonacci levels. The Williams %R indicator shows that the pair may be overbought in the short term, signaling possible resistance ahead. Traders should watch how the price reacts to the 0.382 Fibonacci level as it will dictate the next move upward or a possible retracement.

• DISCLAIMER: Please note that the above analysis is not an investment suggestion by “Capitalcore LLC”. This post has been published only for educational purposes.

Capitalcore

Re: Daily Market Forecast By Capitalcore

USDJPY bearish trend continues on H4 chart

USD/JPY forex pair, also known as the "Gopher," is one of the most traded forex pairs globally, reflecting the relationship between the U.S. dollar and the Japanese yen. The pair is highly sensitive to market sentiment, risk appetite, and economic developments in both the U.S. and Japan. Today’s economic landscape is shaped by the upcoming release of the New York Manufacturing Index from the U.S., which serves as a leading indicator of economic health. If the actual index is higher than forecasted, it will support the dollar, signaling improving business conditions. However, due to the closure of Japanese banks for Respect-for-the-Aged Day, market liquidity could be low, leading to irregular volatility and a higher influence of speculators.
https://capitalcore.com/wp-content/uploads/2024/09/H4-USDJPY-Technical-And-Fundamental_Analysis-on-09-16-2024.webp
Chart Notes:
• Chart time-zone is UTC (+03:00)
• Candles’ time-frame is 4h.

Analyzing the USD/JPY H4 chart, the price is currently trading below the Ichimoku cloud, indicating bearish momentum. The cloud has widened, suggesting the potential for a stronger downtrend, though the last four candles show a slight bullish correction. The price is fluctuating between the 0.786 and 1 Fibonacci levels, having corrected slightly after touching the 1 level. The MACD shows a weak bullish divergence, but the histogram remains negative, signaling that any bullish momentum may be short-lived. Overall, the trend remains bearish, and further declines are expected after this minor correction.

• DISCLAIMER: Please note that the above analysis is not an investment suggestion by “Capitalcore LLC”. This post has been published only for educational purposes.

Capitalcore

Re: Daily Market Forecast By Capitalcore

USDCAD H4 chart technical overview today

The USDCAD forex pair, often referred to as the "Loonie," is a popular currency pair that represents the exchange rate between the US Dollar (USD) and the Canadian Dollar (CAD). As a commodity-based currency, the Canadian Dollar is closely tied to oil prices, while the US Dollar's strength is influenced by macroeconomic factors. The upcoming CAD news, especially from Statistics Canada and CMHC regarding housing starts and consumer price indexes, is expected to drive volatility, especially since inflation and construction are key economic indicators.
From a fundamental perspective, the Canadian Dollar could strengthen today if housing starts data and inflation reports exceed forecasts, signaling a robust economy. On the USD side, traders will focus on retail sales and manufacturing production figures, which are key to gauging US consumer demand and inflationary pressure. If US data underperforms while Canadian data impresses, this may tilt the USDCAD pair toward further CAD gains.
https://capitalcore.com/wp-content/uploads/2024/09/H4-USDCAD-Technical-Analysis-on-09-17-2024.webp
Chart Notes:
• Chart time-zone is UTC (+03:00)
• Candles’ time-frame is 4h.

Analyzing the USDCAD H4 chart, several technical indicators provide insights. The price has been in a slightly bullish trend, consolidating within the upper half of the Bollinger Bands, indicating upward momentum. The MACD histogram is showing a positive divergence, suggesting slight bullish pressure. The price is currently between the 0.236 and 0 Fibonacci retracement levels, hinting at potential resistance. However, if the bullish candles continue to dominate, a breakout above the 0.236 Fib level could push the pair higher.

• DISCLAIMER: Please note that the above analysis is not an investment suggestion by “Capitalcore LLC”. This post has been published only for educational purposes.

Capitalcore

Re: Daily Market Forecast By Capitalcore

USD/CAD Current Market Overview

USD/CAD, also known as the “Loonie,” reflects the exchange rate between the U.S. dollar and the Canadian dollar. The pair has recently shown signs of bullish momentum, but this trend is beginning to lose steam, as evidenced in the latest price action. The chart displays a gradually weakening upward slope, suggesting that buyers might be losing control. Today, both the U.S. and Canadian economies are expected to release significant data, including U.S. housing starts and the Federal Reserve’s statement on interest rates, which could cause volatility. Additionally, the Bank of Canada (BoC) is expected to release the Summary of Deliberations, adding more potential for movement in the pair.
https://capitalcore.com/wp-content/uploads/2024/09/9-18-USDCAD-analysis.webp
Chart Notes:
• Chart time-zone is UTC (+03:00)
• Candles’ time-frame is 4h.

Technically, the Relative Strength Index (RSI) has broken out of its bullish structure, indicating a possible shift toward bearish sentiment. Meanwhile, the Moving Average Convergence Divergence (MACD) is showing signs of a bearish wave potentially forming, with the MACD line approaching the signal line from above. Given the fundamental backdrop, including crude oil inventory reports, interest rate decisions, and projections, these indicators suggest caution for traders as a potential downturn may follow in the coming sessions.

• DISCLAIMER: Please note that the above analysis is not an investment suggestion by “Capitalcore Ltd”. This post has been published only for educational purposes.

Capitalcore

Re: Daily Market Forecast By Capitalcore

GBPUSD H4 Chart Indicators Outlook and Forecast

The GBPUSD forex pair, often referred to as "Cable," is a major currency pair that represents the British Pound against the US Dollar. This pair is widely traded in the forex market, and its movements are influenced by economic factors from both the UK and the US. Traders keep a close eye on it, especially when significant economic data or central bank announcements are expected.
For today's fundamental outlook on Cable, the upcoming releases from the Bank of England are highly anticipated by traders. The central bank's hawkish stance is expected to positively impact the GBP, especially if the Monetary Policy Committee (MPC) members vote for an interest rate hike or lean toward tightening policies. Insights from the minutes of the MPC meeting and the inflation letter due to CPI fluctuations will provide critical clues about the UK's economic health. On the US side, Treasury International Capital (TIC) flows and Philadelphia Fed Business Outlook Survey may affect the dollar, especially if demand for domestic securities surges, or if manufacturers display confidence in business conditions. Both of these indicators are pivotal for USD valuations in the coming trading sessions.
https://capitalcore.com/wp-content/uploads/2024/09/H4-Technical-Analysis-on-GBPUSD-on-09-19-2024.webp
Chart Notes:
• Chart time-zone is UTC (+03:00)
• Candles’ time-frame is 4h.

In the Cable’s attached H4 chart, we can see a bullish trend for GBP/USD with a combination of both bearish and bullish candles, but the overall movement shows price appreciation. The Ichimoku Cloud, which acts as a dynamic support and resistance level, confirms the bullish outlook, with the price currently above the cloud. Furthermore, the pair trades between the 0.786 and 1 Fibonacci retracement levels, which signals potential resistance around the upper level. The MACD indicator shows a bullish divergence, with the histogram reflecting increasing buying momentum, suggesting the upward trend could continue. However, traders should remain cautious as minor corrections are still possible.

• DISCLAIMER: Please note that the above analysis is not an investment suggestion by “Capitalcore LLC”. This post has been published only for educational purposes.

Capitalcore

Re: Daily Market Forecast By Capitalcore

EURGBP H4 Technical Analysis: Bearish Trend in Focus

The EURGBP currency pair, often referred to by traders as "Chunnel" or the "Euro-Pound," represents the exchange rate between the Euro and the British Pound. Euro-Pound price is influenced heavily by macroeconomic data from both the Eurozone and the United Kingdom. For today, Euro news includes the Producer Price Index (PPI) and Consumer Confidence Index, both serving as important indicators of inflation and economic sentiment. ECB President Christine Lagarde's speech at the Michel Camdessus Central Banking Lecture could also provide key insights into future monetary policy, which may influence the Euro. On the UK side, news surrounding consumer confidence and retail sales will be critical in shaping market sentiment. With both regions facing inflationary pressures, today's data releases and speeches are expected to heighten volatility in the EURGBP pair.
https://capitalcore.com/wp-content/uploads/2024/09/H4-Technical-Analysis-on-EURGBP-on-09-20-2024.webp
Chart Notes:
• Chart time-zone is UTC (+03:00)
• Candles’ time-frame is 4h.

Analyzing the EURGBP H4 chart, we can observe that the pair has been in a bearish trend, with four bullish candles out of the last eleven. The price has declined from the upper Bollinger Band to the middle band and touched the lower band, indicating increased volatility. After bouncing off the lower band, the last two candles have turned bullish, suggesting a potential short-term recovery. Currently, the Chunnel’s price is trading between the 1.0 Fibonacci level and the 0.786 level, highlighting a potential area of support. The RSI stands near the oversold zone, signaling that the bearish momentum may be weakening, and a bullish reversal could be imminent. Traders should watch for the price movement between these critical Fibonacci levels and observe the RSI for any divergence, which could provide further confirmation of a trend reversal.

• DISCLAIMER: Please note that the above analysis is not an investment suggestion by “Capitalcore LLC”. This post has been published only for educational purposes.

Capitalcore

Re: Daily Market Forecast By Capitalcore

EURUSD Daily Chart Technical Overview and Indicators

The EURUSD forex pair, often referred to by its nickname "Fiber," represents the trading relationship between the Euro and the U.S. Dollar, the two most traded currencies globally. This currency pair is heavily influenced by macroeconomic factors from both the Eurozone and the United States, making it a favorite among traders for its high liquidity and volatility. The upcoming release of Purchasing Managers' Index (PMI) data from the Eurozone today and the economic outlook discussion by key Federal Reserve members in the U.S. are likely to influence market sentiment and drive volatility in the pair.
The upcoming S&P Global PMI data for both manufacturing and services in the Eurozone is critical, as values above 50 indicate expansion, boosting the Euro, while values below 50 suggest contraction, leading to potential weakness. Similarly, speeches from Federal Reserve officials such as Raphael Bostic and Austan Goolsbee could hint at future monetary policy directions, especially if hawkish tones are observed, which would strengthen the U.S. Dollar. If the Euro PMI surprises to the upside, it could help push EUR USD price higher; conversely, stronger-than-expected comments from Fed officials might weigh on the Euro.
https://capitalcore.com/wp-content/uploads/2024/09/H4-Technical-Analysis-on-EURUSD-on-09-23-2024-.webp
Chart Notes:
• Chart time-zone is UTC (+03:00)
• Candles’ time-frame is 4h.

In the H4 chart of EUR/USD, the pair has been in an upward trend recently, trading within the upper half of the Bollinger Bands. While the price touched the upper band, it has pulled back slightly over the last few candles, with the most recent candle being bearish. The price is currently hovering between the middle and upper Bollinger Bands, indicating that the pair may still maintain its bullish bias as long as it remains above the middle band. Moreover, the price is oscillating between the 0 and 0.236 Fibonacci retracement levels, suggesting a consolidation phase after recent gains.
The MACD indicator shows a weakening bullish momentum, with the histogram declining and the MACD lines appearing close to a potential bearish crossover. This could indicate short-term bearish pressure. However, as long as the price holds above key Fibonacci support levels, particularly around the 0.236 retracement, the bullish outlook might still prevail. Traders should closely monitor a potential breakout or breakdown of these levels to gauge the next significant price movement.

• DISCLAIMER: Please note that the above analysis is not an investment suggestion by “Capitalcore LLC”. This post has been published only for educational purposes.

Capitalcore

Re: Daily Market Forecast By Capitalcore

BTC/USD Price Forecast: Bullish Momentum within Channel

The BTC/USD pair has been trading within a well-defined bullish channel, as seen in the recent price action on the H4 chart. After a steady upward movement, the price has now entered a correction phase and is currently testing a key support zone near $63,273. This level represents a critical area to watch as the price approaches the lower bound of the ascending channel, offering a potential bounce-back point. Traders observing BTC price analysis and BTC/USD technical setups should note that the RSI is approaching neutral territory, suggesting that the recent bearish correction might be nearing its end.
https://capitalcore.com/wp-content/uploads/2024/09/H4-Technical-and-Fundamental-insight-and-analysis-on-BTC-on-09.24.2024.webp
Chart Notes:
• Chart time-zone is UTC (+03:00)
• Candles’ time-frame is 4h.

From a technical perspective, a hold above this support zone could indicate a continuation of the broader bullish trend. Should BTC/USD maintain support at current levels, there is a strong possibility of further upward movement towards $66,000 and beyond. However, a break below the channel could trigger a deeper pullback. For those monitoring BTC exchange rates and seeking insights into BTC price forecasts, this critical juncture in the price movement offers significant opportunities for both bulls and bears alike. Stay vigilant for further developments as the market consolidates within this key price range.

• DISCLAIMER: Please note that the above analysis is not an investment suggestion by “Capitalcore LLC”. This post has been published only for educational purposes.

Capitalcore

Re: Daily Market Forecast By Capitalcore

USDCHF Bullish Outlook with Strong Economic Data

The USD/CHF currency pair, commonly referred to as the "Swissie," represents the exchange rate between the US Dollar (USD) and the Swiss Franc (CHF). This pair is influenced by global economic events and interest rate differentials between the US and Switzerland. Today’s market focus is on upcoming US economic data releases and Federal Reserve statements, which are expected to impact the USD. With US Federal Reserve Governor Adriana Kugler due to speak about the economic outlook, traders are watching for any signs of hawkish policies that could support the USD. Additionally, key economic indicators like the GDP data and jobless claims are expected to provide a clearer picture of US economic health. If these releases come out stronger than forecast, the USD could see a bullish reaction, lifting USD/CHF higher. Meanwhile, the Swiss National Bank’s previous stance on maintaining strict monetary policies provides ongoing support to CHF, but attention remains on future SNB meetings for potential policy shifts.
https://capitalcore.com/wp-content/uploads/2024/09/H4-Technical-and-Fundamental-insight-and-analysis-on-USDCHF-on-09.26.2024.webp
Chart Notes:
• Chart time-zone is UTC (+03:00)
• Candles’ time-frame is 4h.

In the uploaded H4 USD/CHF chart, technical indicators support a bullish outlook. The price has shown a sharp upward trend with five consecutive bullish candles, bouncing from the lower Bollinger Band and approaching the upper band, which aligns slightly above the 0.786 Fibonacci retracement level. The current price lies between the 0.618 and 0.786 Fib levels, indicating that it is testing resistance. Bollinger Bands suggest expanding volatility, while the MACD histogram shows an increasing bullish momentum with the lines crossing into positive territory, signaling potential for further upside. Traders should monitor whether the price breaks above the upper Bollinger Band, which could signal continuation, or if it meets resistance near the 0.786 Fib level.

• DISCLAIMER: Please note that the above analysis is not an investment suggestion by “Capitalcore LLC”. This post has been published only for educational purposes.

Capitalcore

Re: Daily Market Forecast By Capitalcore

GBPUSD H4 Chart Bullish Momentum Outlook

The GBP/USD currency pair, commonly known as "Cable," represents the exchange rate between the British pound and the US dollar. This pair is widely traded in the forex market due to the economic strength of both countries. Today's GBP USD fundamental analysis hinges on key economic data from both the UK and the US, with particular attention to the Confederation of British Industry's (CBI) Distributive Trades Survey for the UK and multiple reports from the US, including a speech by Federal Reserve Governor Lisa Cook and the release of key personal consumption and trade data.
Fundamentally, GBPUSD could see volatility driven by these news events. Positive UK CBI data may boost the pound if sales volumes are better than forecasted, signaling consumer strength in the British economy. In contrast, the US dollar could strengthen if Federal Reserve Governor Lisa Cook gives hawkish signals about future monetary policy, or if consumer spending and trade data exceed expectations. Traders will focus on both countries' economic health, where strong US data could continue to support the dollar, while any weakness may allow the pound to rise against it, especially if UK retail figures outperform.
https://capitalcore.com/wp-content/uploads/2024/09/H4-Technical-and-Fundamental-insight-and-analysis-on-GBPUSD-on-09.27.2024.webp
Chart Notes:
• Chart time-zone is UTC (+03:00)
• Candles’ time-frame is 4h.

In terms of technical analysis, the H4 chart for GBP/USD reveals a bullish trend. The price is moving within a rising channel and is positioned in the upper half of the Bollinger Bands, nearing the upper band, which often indicates strong bullish momentum. The price is also sitting between the 0.786 and 1 Fibonacci retracement levels, suggesting that it is approaching a critical resistance zone. Additionally, the RSI indicator shows the pair is not yet overbought but is approaching higher levels, suggesting that the bullish trend still has room to run before a potential reversal. Traders should watch for a breakout or rejection at these key Fibonacci levels, especially as fundamental news unfolds.

• DISCLAIMER: Please note that the above analysis is not an investment suggestion by “Capitalcore LLC”. This post has been published only for educational purposes.

Capitalcore

Posts: 51 to 72 of 72

Pages Previous 1 2 3

You must login or register to post a reply

Forex Software → Market Analysis → Daily Market Forecast By Capitalcore

Similar topics in this forum