forex software

Create and Test Forex Strategies

forex software

Skip to forum content

Forex Software

Create and Test Forex Strategies

You are not logged in. Please login or register.


(Page 8 of 9)

Forex Software → Market Analysis → Daily Analysis By FXGlory

Pages Previous 1 6 7 8 9 Next

You must login or register to post a reply

RSS topic feed

Posts: 176 to 200 of 204

176 (edited by FXGLORY 2024-07-23 00:42:14)

Re: Daily Analysis By FXGlory

USDJPY H4 Technical and Fundamental Analysis for 07.23.2024


https://fxglory.com/wp-content/uploads/2024/07/USDJPY_H4_Chart_Daily_Technical_and_Fundamental_Analysis_for_07-1024x522.webp


Time Zone: GMT +3
Time Frame: 4 Hours (H4)


Fundamental Analysis:
The USD/JPY news analysis today is influenced by several fundamental factors, including economic indicators from the United States and Japan. For the USD, upcoming data from the National Association of Realtors and the Federal Reserve Bank of Richmond are crucial. Home resales, which reflect consumer confidence and economic health, can significantly impact the USD. Similarly, the Richmond Fed Index provides insights into manufacturing activity, which is vital for economic growth. For the JPY, the S&P Global Manufacturing PMI is a key indicator. This index reflects the health of the manufacturing sector and overall economic conditions in Japan.


Price Action:
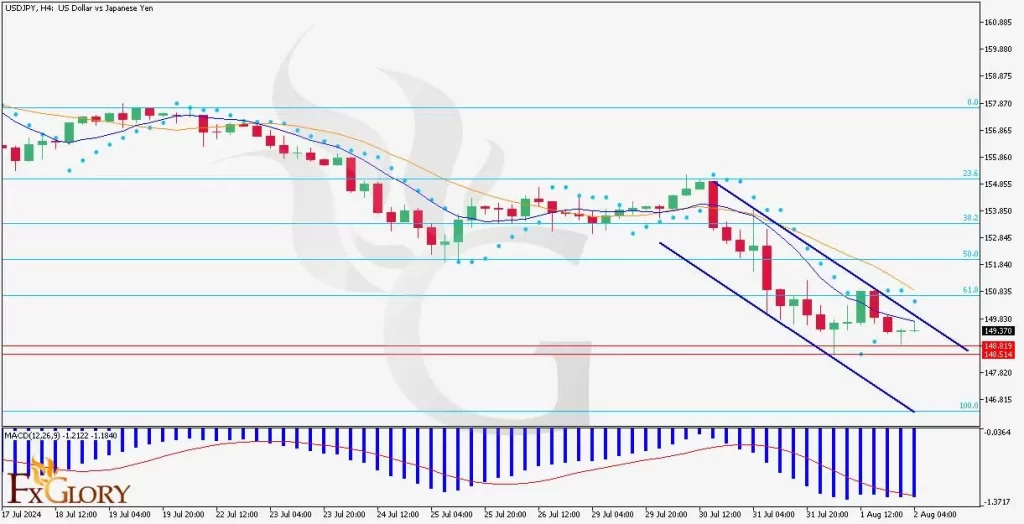
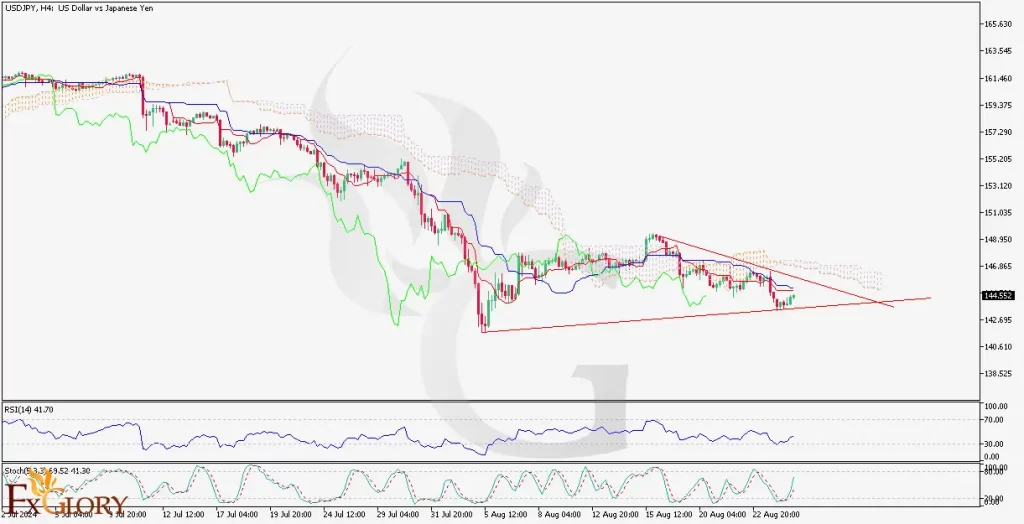
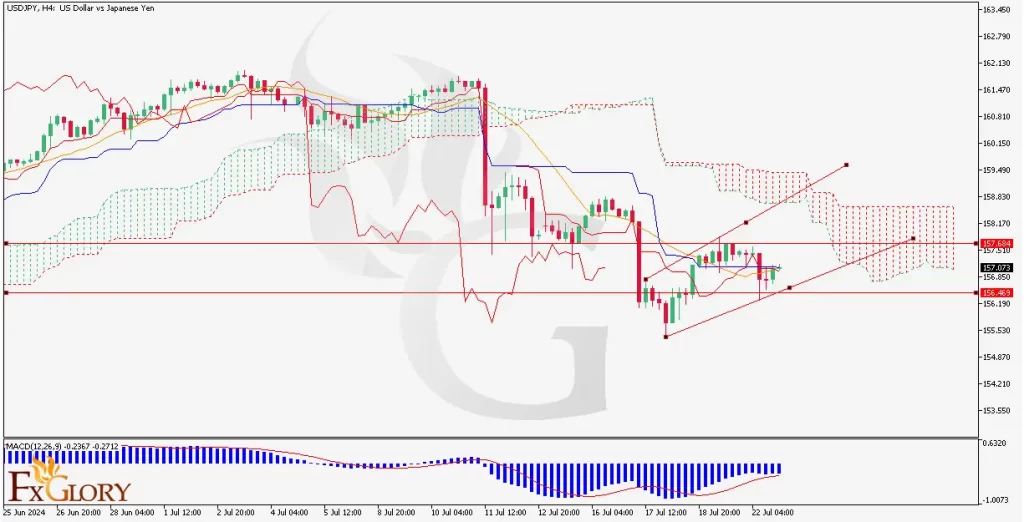
The USD/JPY H4 chart, shows the pair’s bearish trend, with recent price movements forming lower highs and lower lows. The USD/JPY pair, also known as the Gopher has its price currently trending below the Ichimoku Cloud, indicating a bearish sentiment. The pair has recently found support near 156.46 and resistance around 157.68. The formation of a descending channel suggests further downside potential unless there is a strong reversal signal.


Key Technical Indicators:
Ichimoku Cloud:
The price is below the Ichimoku Cloud on USDJPY H4 chart, indicating a bearish trend. The Tenkan-sen is below the Kijun-sen , reinforcing the bearish outlook for this pair. The Chikou Span is also below the price, further confirming the bearish sentiment for USD against JPY.
MACD (Moving Average Convergence Divergence):
The MACD line is below the signal line, and the histogram is negative, indicating bearish momentum. The recent contraction of the histogram suggests a potential weakening of the bearish momentum.


Support and Resistance:
Support Levels:
The key support level is at 156.46, which has been tested multiple times and has held.
Resistance Levels:
The primary resistance level is at 157.68, with another significant level at 158.07.


Conclusion and Consideration:
The Gopher’s technical analysis on the H4 chart exhibits a strong bearish trend supported by the Ichimoku Cloud and MACD indicators. The USD/JPY price action suggests a continuation of the downward movement unless a significant reversal signal occurs. Traders should watch for any breakouts above the resistance level of 157.68 or below the support level of 156.46 for potential trade opportunities. It's essential to monitor upcoming economic data releases for the USD and JPY, as these can impact the pair's direction. As always, employing proper risk management strategies, including stop losses, is crucial in this volatile market.


Disclaimer: The provided analysis is for informational purposes only and does not constitute investment advice. Traders should conduct their own research and analysis before making any trading decisions.


FXGlory
07.23.2024

Re: Daily Analysis By FXGlory

USD/CAD H4 Technical and Fundamental Analysis for 24.07.2024


https://fxglory.com/wp-content/uploads/2024/07/USDCADH4-1024x524.webp


Time Zone: GMT +3
Time Frame: 4 Hours (H4)


Fundamental Analysis:

The USD/CAD news analysis today is driven by several economic indicators and significant announcements. For the Canadian dollar, the key factors affecting the value of CAD include the Bank of Canada (BoC) Monetary Policy Report, the BoC Rate Statement, and the Overnight Rate decision. These announcements will provide insights into Canada's economic outlook and monetary policy direction, directly affecting the CAD's strength. For the US dollar, critical economic data releases such as the Flash Manufacturing PMI, Flash Services PMI, and New Home Sales numbers are influential. The PMI figures are expected to show slight changes, with Manufacturing PMI forecasted at 51.6 and Services PMI at 55.3. New Home Sales are anticipated to increase from 619K to 639K, indicating growth in the housing sector. These data points will impact USD performance and the overall USD/CAD forecast today.


Price Action:

The USD/CAD H4 candlestick chart shows the price climbing within a bullish channel, currently facing resistance at the top of the channel. Despite the price increase, the trade volume on this pair is reducing, signaling a potential end to the bullish phase. The price is also at the top line of the Bollinger Bands, indicating overbought conditions.


Key Technical Indicators:

RSI (Relative Strength Index): The RSI on USDCAD chart is currently above 70, indicating overbought conditions. This suggests a potential for a price correction or a pause in the bullish momentum.
Bollinger Bands: USDCAD price is touching the upper band, reinforcing the overbought scenario. Traders should watch for a possible price pullback to the middle or lower bands.


Support and Resistance:

Support Levels: The nearest support level on this pair is at 1.37610, followed by a more substantial support at 1.37300.

Resistance Levels: The immediate resistance level for USDCAD price is at 1.37785, with a significant resistance at 1.37920, which aligns with the top of the bullish channel.


Conclusion and Consideration:

The USD/CAD technical analysis today indicates a strong bullish trend on the H4 chart, but with signs of overbought conditions as highlighted by the RSI and Bollinger Bands. The reducing trade volume further suggests a possible end to the bullish phase. Given the upcoming economic data releases and the BoC's announcements, traders should remain cautious. The BoC Monetary Policy Report and Rate Statement, along with USD economic indicators like the Flash PMIs and New Home Sales, will provide critical insights for trading strategies. Employ proper risk management and stay alert to news updates for informed trading decisions.


Disclaimer: The provided analysis is for informational purposes only and does not constitute investment advice. Traders should conduct their own research and analysis before making any trading decisions.


FXGlory
24.07.2024

Re: Daily Analysis By FXGlory

EURUSD H4 Technical and Fundamental Analysis for 25.07.2024


https://fxglory.com/wp-content/uploads/2024/07/EURUSD_H4_Daily_Technical_and_Fundamentan_Analysis_for_07_25_2024-1024x522.webp


Time Zone: GMT +3
Time Frame: 4 Hours (H4)


Fundamental Analysis:
The EUR/USD forecast today is currently influenced by a series of upcoming economic events and data releases. For the USD, key events include speeches from FOMC members Bowman and Logan, as well as President Biden's announcement. High-impact data such as the Advance GDP q/q, Unemployment Claims, and Durable Goods Orders will also play crucial roles. These events are likely to provide significant volatility in the market. In the Eurozone, the Ifo Business Climate Index and ECB-related announcements will shape market sentiment. Strong US economic data and hawkish tones from FOMC members may strengthen the USD, potentially pushing the EUR/USD pair, also known as the Fiber, lower.


Price Action:
The EUR/USD H4 chart has recently broken below the Ichimoku cloud, indicating a shift to a bearish trend. The pair is experiencing a downward movement, forming lower highs and lower lows, typical of a bearish trend. The pair’s price action suggests continued downward pressure, with the price finding resistance at the lower boundary of the Ichimoku cloud.


Key Technical Indicators:
Ichimoku Cloud:
The price breaking below the Ichimoku cloud is a bearish signal. The future cloud is bearish as well, with Span A below Span B, indicating potential continued downward momentum.
RSI (Relative Strength Index): The RSI is around 35.39, which is close to the oversold territory. This indicates that while the bearish momentum is strong, there may be limited room for further immediate decline before a potential correction.
MACD (Moving Average Convergence Divergence): The MACD indicator shows a negative histogram with the MACD line below the signal line, reinforcing the bearish sentiment. This suggests that downward momentum is currently prevailing.


Support and Resistance:
Support Levels:
Immediate support is found at 1.08345, with stronger support at 1.08000.
Resistance Levels: Immediate resistance is at 1.08574, followed by 1.08870 and 1.09039. A break above these levels would be required to negate the current bearish trend.


Conclusion and Consideration:
The EUR/USD technical analysis on the H4 chart is exhibiting bearish tendencies, confirmed by the price breaking below the Ichimoku cloud and negative signals from the MACD. The RSI suggests the pair is nearing oversold conditions, which could lead to a short-term corrective bounce. However, the overall sentiment remains bearish unless significant resistance levels are breached. As for the Fiber’s fundamental analysis today, traders should closely monitor the upcoming economic data releases and FOMC speeches for further direction. Proper risk management, such as setting stop losses, is crucial in this volatile environment.


Disclaimer: The provided analysis is for informational purposes only and does not constitute investment advice. Traders should conduct their own research and analysis before making any trading decisions.


FXGlory
25.07.2024

179 (edited by FXGLORY 2024-07-26 05:02:11)

Re: Daily Analysis By FXGlory

GOLD H4 Daily Technical and Fundamental Analysis for 26.07.2024


https://fxglory.com/wp-content/uploads/2024/07/GOLD-H4-Daily-Technical-and-Fundamental-Analysis-and-Prediction-On-26.07.2024-1024x524.webp


Time Zone: GMT +3
Time Frame: 4 Hours (H4)


Fundamental Analysis
The GOLD market (GOLD/USD, XAU/USD) is closely watched by traders due to its safe-haven status and sensitivity to economic data. Today, several key economic indicators from the U.S. are expected to impact the gold market. The Core PCE Price Index m/m, forecasted at 0.2%, is crucial as it influences inflation expectations and the Federal Reserve's monetary policy. Lower-than-expected data could weaken the USD, potentially boosting gold prices. Additionally, Personal Income and Personal Spending data will provide insights into consumer health and economic activity. Revised University of Michigan Consumer Sentiment and Inflation Expectations also play significant roles, reflecting consumer confidence and future inflation outlook. The ongoing G20 meetings may introduce additional volatility as global economic policies and issues are discussed, affecting currency and commodity markets, including gold.


Price Action
Analyzing the H4 chart for GOLD/USD, we observe a strong bearish trend with the price moving within a descending channel. The recent candles show a clear downward movement, reflecting selling pressure. Despite a few attempts at bullish corrections, the overall momentum remains bearish. The GOLD price is currently trading below the Ichimoku Cloud, indicating continued bearish sentiment. The recent interaction with the Fibonacci retracement levels suggests minor support, but the price has largely respected the bearish trend.


Key Technical Indicators
Ichimoku Cloud: The current XAUUSD price is below the Ichimoku Cloud, indicating a bearish outlook. The cloud itself is bearish, further supporting the downtrend. This suggests that selling pressure remains strong, and the bearish trend is likely to continue.
RSI (14): The RSI is currently at 31.81, indicating that the market is approaching oversold conditions. While this might suggest a potential for a short-term bounce, the overall bearish momentum could persist until a significant reversal signal is observed.
Volumes: The trading volume shows a gradual increase in selling activity, supporting the bearish trend. Higher volumes on down moves suggest strong participation from sellers, reinforcing the bearish outlook.
Parabolic SAR (0.2): The Parabolic SAR dots are positioned above the candles, indicating a bearish signal. This trend-following indicator confirms the current downtrend, suggesting that the selling pressure is likely to continue.


Support and Resistance
Support Levels: Immediate support is at the 23.6% Fibonacci retracement level around 2366.91, followed by further support at 2330.96.
Resistance Levels: Immediate resistance is at the 38.2% Fibonacci retracement level around 2389.16, with further resistance at the 50% level near 2403.71.


Conclusion and Consideration
The GOLD/USD pair on the H4 chart indicates a strong bearish trend, supported by technical indicators like the Ichimoku Cloud, RSI, Fibonacci retracement levels, and Parabolic SAR. The current price action suggests continued downward pressure, though oversold RSI levels may hint at a potential short-term bounce. Fundamental factors, including today's key U.S. economic data and ongoing G20 meetings, could introduce volatility. Traders should remain cautious and watch for any significant news that might impact market sentiment.


Disclaimer: The GOLD analysis provided is for informational purposes only and does not constitute investment advice. Traders should conduct their own research and analysis before making any trading decisions. Market conditions can change rapidly, and it is essential to stay updated with the latest information.


FXGlory
26.07.2024

Re: Daily Analysis By FXGlory

GBPUSD H4 Technical and Fundamental Analysis for 29.07.2024


https://fxglory.com/wp-content/uploads/2024/07/GBPUSD_H4_Chart_Daily_Technical_and_Fundamental_Analysis_for_07_29_2024-1024x522.webp


Time Zone: GMT +3
Time Frame: 4 Hours (H4)


Fundamental Analysis:

The GBP/USD news analysis today is significantly influenced by economic indicators from both the United Kingdom and the United States. For the UK, factors such as changes in the money supply, mortgage approvals, and new credit issuance play crucial roles. The recent data from the Bank of England shows an increase in money circulation and credit issuance, suggesting an optimistic economic outlook. In the US, economic indicators such as interest rates, inflation, and job reports affect the dollar. The upcoming Bank of England reports will provide further insights into the UK's economic health, impacting the GBP/USD forecast today.


Price Action:

The GBP/USD H4 chart is exhibiting a downtrend, as indicated by the descending channel formed by the red trend lines. The price is consistently making lower highs and lower lows. The pair also known as the Cable, is struggling to break above the resistance provided by the upper trend line of the channel. This pattern indicates the pair’s bearish sentiment.


Key Technical Indicators:

Ichimoku Cloud:
The price has broken below the Ichimoku Cloud, indicating a bearish trend. The conversion line (Tenkan-sen) is below the baseline (Kijun-sen), supporting the bearish outlook. The cloud ahead is bearish, suggesting continued downward pressure.

RSI (Relative Strength Index):
The RSI is currently at 39.70, indicating the market is approaching oversold conditions. A value below 30 would signal an oversold market, potentially leading to a corrective bounce.

MACD (Moving Average Convergence Divergence):
The MACD line is below the signal line, and the histogram is in negative territory, signaling bearish momentum. The divergence between the MACD and the signal line suggests a strengthening downward momentum.


Support and Resistance:

Support Levels:
The immediate support level is around 1.26690, which aligns with the lower trend line of the descending channel.

Resistance Levels:
The nearest resistance is around 1.29215, where the price has previously attempted to break above but failed.


Conclusion and Consideration:
The GBP/USD technical analysis today shows the pair's bearish trend on the H4 timeframe, confirmed by the Ichimoku Cloud, MACD, and RSI indicators. Traders should look for potential sell opportunities, particularly if the price continues to respect the upper trend line of the descending channel. Monitoring upcoming economic releases from both the UK and the US will be crucial as they could influence the Cable’s price action. Traders should also be cautious of any corrective bounces that might occur if the RSI reaches oversold levels.


Disclaimer: The provided analysis is for informational purposes only and does not constitute investment advice. Traders should conduct their own research and analysis before making any trading decisions.


FXGlory
29.07.2024

Re: Daily Analysis By FXGlory

EURUSD H4 Technical and Fundamental Analysis for 30.07.2024


https://fxglory.com/wp-content/uploads/2024/07/EURUSD_H4_Chart_Daily_Technical_and_Fundamental_Analysis_for_07-2-1024x524.webp


Time Zone: GMT +3
Time Frame: 4 Hours (H4)


Fundamental Analysis:
The EUR/USD news analysis today is influenced by various fundamental factors such as macroeconomic indicators, central bank policies, and geopolitical events. For the Euro, recent data releases from INSEE indicate changes in consumer spending and GDP, which are vital for understanding the economic health of the Eurozone. Positive readings typically strengthen the Euro. On the US side, upcoming data on house prices and consumer confidence are crucial. The US Federal Reserve’s monetary policy decisions also play a significant role, with higher interest rates potentially boosting the USD, consequently affecting the pair also known as the Fiber.


Price Action:
The EUR/USD H4 chart shows the pair’s clear bearish trend, with the price moving below the Ichimoku cloud, indicating a strong downtrend. The price has recently tested and broken through significant support levels, and there is a descending channel evident, further confirming the bearish sentiment. The Fiber’s price action suggests continued downward pressure unless a significant reversal signal appears.


Key Technical Indicators:
Ichimoku Cloud:
The price is trading below the Ichimoku cloud, indicating bearish momentum. The future cloud is bearish, suggesting that the downtrend might continue. The Tenkan-Sen is below the Kijun-Sen, reinforcing the bearish outlook.
RSI (Relative Strength Index): The RSI is at 36.35, which is in the bearish zone but not yet oversold. This indicates that there might still be room for further downside before a potential reversal or correction.
Stochastic Oscillator: The Stochastic is at 20.22/14.21, indicating oversold conditions. This could suggest that a short-term bounce or correction might be on the horizon if the market finds some support.


Support and Resistance:
Support Levels:
The immediate support level is at 1.08148, with further support at 1.07600, the lower bound of the descending channel.
Resistance Levels: The nearest resistance is at 1.08331, followed by 1.08555 and 1.08842, which are the upper bounds of the recent price consolidation and descending channel.


Conclusion and Consideration:
The EUR/USD technical analysis today on the H4 chart shows a strong bearish trend reinforced by key technical indicators. The price is trading below the Ichimoku cloud, the RSI indicates bearish momentum, and the Stochastic suggests oversold conditions. Traders should monitor the support at 1.08148 closely; a break below this level could signal further downside. However, oversold conditions might lead to a short-term corrective bounce. As for the pair’s fundamental analysis, data releases from both the Eurozone and the US could provide additional volatility and direction. Risk management is crucial in such a volatile environment, and setting appropriate stop-loss levels is advised.


Disclaimer: The provided analysis is for informational purposes only and does not constitute investment advice. Traders should conduct their own research and analysis before making any trading decisions.


FXGlory
30.07.2024

Re: Daily Analysis By FXGlory

EURJPY H4 Technical and Fundamental Analysis for 31.07.2024


https://fxglory.com/wp-content/uploads/2024/07/EURJPYH4-1024x524.webp


Time Zone: GMT +3
Time Frame: 4 Hours (H4)


Fundamental Analysis:

The EUR/JPY pair is influenced by various fundamental factors, including economic indicators from the Eurozone and Japan. For the Euro (EUR), recent data from the Eurozone's economic performance, particularly GDP growth and inflation rates, are pivotal. Reports from the European Central Bank (ECB) regarding monetary policy also play a crucial role. For the Japanese Yen (JPY), key indicators include the S&P Global Manufacturing PMI and the Bank of Japan's stance on monetary policy. The overall economic health and consumer confidence in both regions are significant drivers for the EUR/JPY pair.


Price Action:

The EUR/JPY H4 chart shows a bearish trend, with the recent price action forming lower highs and lower lows. The pair's price has broken below the Ichimoku Cloud, indicating a bearish sentiment. The EUR/JPY pair has recently found support near 164.15 and resistance around 168.01. The formation of a descending pattern suggests further downside potential unless a strong reversal signal emerges.


Key Technical Indicators:

Ichimoku Cloud:

The price is below the Ichimoku Cloud on the EUR/JPY H4 chart, indicating a bearish trend. The Tenkan-sen is below the Kijun-sen, reinforcing the bearish outlook for this pair. The Chikou Span is also below the price, further confirming the bearish sentiment for EUR against JPY.

MACD (Moving Average Convergence Divergence):

The MACD line is below the signal line, and the histogram is negative, indicating bearish momentum. The recent contraction of the histogram suggests a potential weakening of the bearish momentum.


Support and Resistance:

Support Levels:

The key support level is at 164.15, which has been tested multiple times and has held.

Resistance Levels:

The primary resistance level is at 168.01, with another significant level at 166.08.


Conclusion and Consideration:

The EUR/JPY technical analysis on the H4 chart exhibits a strong bearish trend supported by the Ichimoku Cloud and MACD indicators. The EUR/JPY price action suggests a continuation of the downward movement unless a significant reversal signal occurs. Traders should watch for any breakouts above the resistance level of 168.01 or below the support level of 164.15 for potential trade opportunities. It's essential to monitor upcoming economic data releases for the Euro and the Yen, as these can impact the pair's direction. As always, employing proper risk management strategies, including stop losses, is crucial in this volatile market.

Disclaimer:

The provided analysis is for informational purposes only and does not constitute investment advice. Traders should conduct their own research and analysis before making any trading decisions.

FXGlory
31.07.2024

Re: Daily Analysis By FXGlory

GBPUSD H4 Technical and Fundamental Analysis for 08.01.2024


https://fxglory.com/wp-content/uploads/2024/08/GBPUSD_H4_Chart_Daily_Technical_and_Fundamental_Analysis_for_08_01_2024-1024x524.webp


Time Zone: GMT +3
Time Frame: 4 Hours (H4)


Fundamental Analysis:
The GBP/USD news analysis today is influenced by a variety of fundamental factors. The British Pound is currently affected by the economic outlook in the UK, including inflation rates, interest rates set by the Bank of England, and the overall economic performance as reflected in GDP and employment data. The US Dollar, on the other hand, is influenced by similar factors in the United States, including Federal Reserve policies, inflation rates, and employment figures. Today's economic calendar includes several important data releases for the USD, such as Unemployment Claims and ISM Manufacturing PMI, which are expected to have a high impact on the currency. These releases could provide significant volatility and direction to the GBP/USD pair, also known as the “Cable”.


Price Action:
The GBP/USD H4 chart shows the pair trading in a descending channel with clear lower highs and lower lows, indicating the pair’s bearish trend. However, the Cable’s recent price action suggests a consolidation phase around the 1.2830 - 1.2865 range, which may be forming a base for a potential reversal or continuation pattern. The price is currently testing the upper boundary of the channel, indicating a crucial decision point.


Key Technical Indicators:
Ichimoku Cloud: The price is trading below the Ichimoku cloud, suggesting a bearish outlook. The cloud ahead is bearish, providing potential resistance for any upward movement.
RSI (Relative Strength Index): The RSI is around the neutral 49 level, suggesting neither overbought nor oversold conditions. This indicates a lack of strong momentum in either direction, aligning with the current consolidation phase.
MACD (Moving Average Convergence Divergence): The MACD line is below the signal line, and the histogram is in negative territory, indicating bearish momentum. However, the narrowing histogram suggests weakening bearish momentum, which could precede a bullish crossover.


Support and Resistance:
Support Levels: The immediate support levels for the currency pair are at 1.2827 and 1.2810, providing crucial price points where buying interest might emerge to prevent further decline.
Resistance Levels: The resistance levels are at 1.2846 and 1.2865, acting as key barriers where selling pressure might intensify, potentially halting any upward movement.


Conclusion and Consideration:
The GBP/USD technical analysis today shows that the pair is currently in a consolidation phase within a broader downtrend. Key indicators such as the Ichimoku cloud and MACD suggest a bearish bias, while the RSI shows a neutral stance. The upcoming economic releases for the USD, particularly the Unemployment Claims and ISM Manufacturing PMI, could introduce significant volatility to the pair’s forecast. Traders should monitor these data points closely, as they could determine the pair's next direction. A break above the 1.2865 resistance could signal a potential trend reversal, while a drop below 1.2827 could confirm the continuation of the bearish trend.


Disclaimer: The provided analysis is for informational purposes only and does not constitute investment advice. Traders should conduct their own research and analysis before making any trading decisions.


FXGlory
08.01.2024

184 (edited by FXGLORY 2024-08-02 05:01:59)

Re: Daily Analysis By FXGlory

USDJPY H4 Technical and Fundamental Analysis for 08.02.2024


https://fxglory.com/wp-content/uploads/2024/08/USDJPY-H4-Technical-and-Fundamental-Daily-Analysis-for-02.08.2024-1024x524.webp


Time Zone: GMT +3
Time Frame: 4 Hours (H4)


Fundamental Analysis:
The USD/JPY currency pair reflects the exchange rate between the US Dollar (USD) and the Japanese Yen (JPY). Today, the USD is poised for significant volatility with key economic releases including Average Hourly Earnings, Non-Farm Employment Change, and the Unemployment Rate. The Average Hourly Earnings forecast is at 0.3%, which is a leading indicator of consumer inflation. A higher-than-expected figure is positive for the USD. The Non-Farm Employment Change forecast stands at 176K, indicating potential job growth. The Unemployment Rate is forecasted at 4.1%, and a lower-than-expected figure would be favorable for the USD. These indicators are crucial as they impact consumer spending and overall economic health, which traders will scrutinize closely.


Price Action:
The USDJPY pair analysis on the H4 timeframe shows a clear bearish trend. The price has been consistently moving within a descending channel, highlighted by lower highs and lower lows. Recently, the price has tested the lower boundary of the channel, indicating continued bearish pressure. The presence of red candlesticks dominates, confirming the downward momentum. Traders should note the current consolidation near the lower channel line, which might suggest a potential pause or reversal, but the overall trend remains bearish.


Key Technical Indicators:
Moving Averages (MA 17 and MA 9): The 9-period MA is below the 17-period MA, indicating a bearish trend. This alignment supports the downward price movement observed in recent sessions. The convergence and subsequent crossing of the MAs have reinforced the selling pressure.
Parabolic SAR: The Parabolic SAR dots have shifted above the candles, signaling a bearish trend. Despite a brief change indicated by two spots below the candles, the last three dots have switched back above, confirming the resumption of the bearish trend.
MACD (Moving Average Convergence Divergence): The MACD line has crossed below the signal line, indicating bearish momentum. The histogram supports this with increasing negative values, suggesting that the selling pressure is intensifying. This bearish crossover aligns with the overall downward trend of the pair.


Support and Resistance:
Support: Immediate support is located at 148.514, a level that has been tested multiple times recently. This support aligns with the lower boundary of the descending channel and a critical consolidation area.
Resistance: The nearest resistance level is at 150835, which coincides with the 61.8% Fibonacci retracement level. This level has acted as a significant barrier in recent attempts to reverse the trend.


Conclusion and Consideration:
The USDJPY pair on the H4 chart indicates sustained bearish momentum, supported by the alignment of the moving averages, Parabolic SAR, and MACD indicators. The USDJPY price action within the descending channel suggests that the bears are still in control. Traders should consider the impact of the upcoming US economic data releases, which could introduce significant volatility and potentially alter the trend dynamics. It is crucial to monitor these indicators and adjust positions accordingly.


Disclaimer: The USDJPY provided analysis is for informational purposes only and does not constitute investment advice. Traders should conduct their own research and analysis before making any trading decisions. Market conditions can change rapidly, and it is essential to stay updated with the latest information. Always consider risk management strategies and consult with a financial advisor if necessary.


FXGlory
08.02.2024

Re: Daily Analysis By FXGlory

EURUSD H4 Technical and Fundamental Analysis for 05.08.2024


https://fxglory.com/wp-content/uploads/2024/08/EURUSD-Technical-andf-Fundamental-Analysis-for-05.08.2024--1024x524.webp


Fundamental Analysis:

The EUR/USD news analysis is set to be influenced by several low-impact news releases today, including the Spanish, Italian, French, German, and overall Eurozone Services PMI. These PMI releases are crucial as they provide insight into the economic health and business conditions in the services sector. A reading above 50.0 indicates industry expansion, while below signifies contraction. Moreover, the Sentix Investor Confidence and Producer Price Index (PPI) m/m data will further contribute to market sentiment. For the US Dollar (USD), the key events to watch are the medium-impact Final Services PMI with a forecast of 56.0, and the high-impact ISM Services PMI expected to be at 51.4. Both these indicators are critical as they reflect the economic health and business conditions in the US non-manufacturing sector.


Price Action:

The EURUSD pair on the H4 timeframe recently exhibited a significant bullish momentum. The price action indicates a breakout from the previous downtrend, marked by a steep rise in the past few sessions. The sharp increase in price has broken through several resistance levels, indicating strong bullish sentiment.


Key Technical Indicators:

Parabolic SAR: The Parabolic SAR (Stop and Reverse) indicator has placed its last spots below the candles, suggesting a bullish trend. The sharp increase in price aligns with the SAR’s indication, confirming a strong upward momentum.
Alligator: The Alligator indicator, consisting of the Jaw (blue line), Teeth (red line), and Lips (green line), shows a widening of the lines. This indicates a trending market. The Lips (green) have crossed above the Teeth (red) and Jaw (blue), which supports the bullish trend and suggests that the market is waking up to a new upward direction.
MACD (Moving Average Convergence Divergence): The MACD line has crossed above the signal line with the histogram showing increasing bullish momentum. This crossover and the rising histogram bars indicate a strengthening bullish trend, reinforcing the recent upward price action.


Support and Resistance Levels:
Support Levels: The immediate support level is at 1.0840 (23.6% Fibonacci retracement level), followed by 1.0784 (0.0% Fibonacci retracement level).
Resistance Levels: The key resistance level to watch is at 1.0917, followed by 1.0960 (61.8% Fibonacci retracement level).


Conclusion and Consideration:
The EURUSD H4 chart exhibits a robust bullish trend driven by strong upward price action and supported by key technical indicators such as Parabolic SAR, Alligator, and MACD. The market’s recent breakout from the downtrend signals potential for further gains. However, traders should consider the upcoming economic news releases for both EUR and USD, which could introduce volatility and impact the price direction.


Disclaimer: The EURUSD provided analysis is for informational purposes only and does not constitute investment advice. Traders should conduct their own research and analysis before making any trading decisions. Market conditions can change rapidly, and it is essential to stay updated with the latest information.


FXGlory
05.08.2024

Re: Daily Analysis By FXGlory

AUDNZD H4 Technical and Fundamental Analysis for 06.08.2024


https://fxglory.com/wp-content/uploads/2024/08/AUDNZDH4-1024x524.webp


Time Zone: GMT +3
Time Frame: 4 Hours (H4)


Fundamental Analysis:
The AUD/NZD currency pair represents the exchange rate between the Australian Dollar (AUD) and the New Zealand Dollar (NZD). The recent economic data from both countries indicate potential influences on this pair. Australia's economic releases, including Retail Sales and Trade Balance, show a robust economic environment. Higher-than-expected Retail Sales figures suggest strong consumer spending, which is positive for the AUD. On the other hand, New Zealand's employment data, such as the Unemployment Rate and Employment Change, also show positive trends, which can strengthen the NZD. However, given the overall economic conditions and central bank policies, the AUD appears poised for a bullish movement against the NZD.


Price Action:
The AUDNZD pair analysis on the H4 timeframe shows a potential end to the recent bearish trend. The price has broken out of a descending trend line, suggesting a possible reversal or a pause in the bearish momentum. The candlestick pattern indicates a recovery, with green candles emerging after hitting a significant support level.


Key Technical Indicators:
MACD (Moving Average Convergence Divergence): The MACD indicator shows a bullish crossover, where the MACD line has crossed above the signal line, indicating a potential shift to bullish momentum. The histogram also supports this with increasing positive values, suggesting that the buying pressure is intensifying.
RSI (Relative Strength Index): The RSI has recovered from the oversold area, moving above the 30 level, which signals the end of bearish momentum and the start of a potential bullish run.


Support and Resistance:
Support: Immediate support is located at 1.08555, a level that has been tested recently and held firm, indicating strong buying interest at this level.
Resistance: The nearest resistance level is at 1.09416, which coincides with recent highs and the breakout area of the descending trend line.


Conclusion and Consideration:
The AUDNZD pair on the H4 chart indicates a potential bullish reversal, supported by the MACD and RSI indicators. The breakout of the descending trend line and the price recovery from the support level of 1.08555 suggest that the bulls might be taking control. Traders should consider this bullish scenario and look for buying opportunities on retracements, particularly around the 1.08555 support area. Monitoring upcoming economic releases from both Australia and New Zealand will be crucial, as they can introduce significant volatility and potentially alter the trend dynamics.


Disclaimer: The AUDNZD provided analysis is for informational purposes only and does not constitute investment advice. Traders should conduct their own research and analysis before making any trading decisions. Market conditions can change rapidly, and it is essential to stay updated with the latest information. Always consider risk management strategies and consult with a financial advisor if necessary.


FXGlory
06.08.2024

Re: Daily Analysis By FXGlory

EURCAD H4 Technical and Fundamental Analysis for 07.08.2024


https://fxglory.com/wp-content/uploads/2024/08/eurcad-h4-1024x524.webp


Time Zone: GMT +3
Time Frame: 4 Hours (H4)


Fundamental Analysis:
The EURCAD currency pair represents the exchange rate between the Euro (EUR) and the Canadian Dollar (CAD). Recent economic data from both the Eurozone and Canada indicate potential influences on this pair.
Euro (EUR)
•German Industrial Production m/m: The latest data shows an increase of 1.0%, a significant recovery from the previous -2.5%. This indicates a rebound in Germany's industrial sector, which is positive for the EUR.
•German Trade Balance: The trade balance stands at 21.7B, slightly below the previous 24.9B. While this shows a slight decrease, the large surplus continues to support the EUR.
Canadian Dollar (CAD)
•Ivey PMI: The latest figure is 60.0, lower than the previous 62.5. A PMI above 50 generally indicates expansion, but the drop suggests a slowing pace of growth, which could weaken the CAD.
•BOC Summary of Deliberations: The Bank of Canada's recent deliberations will provide insight into future monetary policy, which is crucial for the CAD's strength. Any dovish tone could negatively impact the CAD.


Price Action:
The EURCAD pair has been through a bearish phase and is currently testing a significant support zone around the 1.50000 level. This area is crucial as it has held in the past, providing a potential floor for the pair.


Key Technical Indicators:
MACD (Moving Average Convergence Divergence): The MACD indicator shows that although the trend has been bearish, the MACD line is trending higher, suggesting decreasing bearish momentum. The histogram supports this with declining negative values.
RSI (Relative Strength Index): The RSI is in a neutral area, around 40, indicating that the pair is not currently oversold or overbought. This suggests that the current price level is a potential point of consolidation or reversal.

Support and Resistance:
Support: Immediate support is located at 1.50000. This level is critical as it has been tested recently and held firm, indicating strong buying interest.
Resistance: The nearest resistance level is at 1.50313, followed by 1.49961, which aligns with recent highs and the descending trend line.


Conclusion and Consideration:
The EURCAD pair on the H4 chart indicates a potential consolidation or reversal at the 1.50000 support level. The MACD and RSI indicators suggest that the bearish momentum might be waning, offering a possible opportunity for bulls. Traders should monitor this support area closely for potential buying opportunities, especially if the pair holds above 1.50000. Upcoming economic releases from both the Eurozone and Canada will be crucial, as they can introduce significant volatility and potentially alter the trend dynamics.


Disclaimer: The EURCAD provided analysis is for informational purposes only and does not constitute investment advice. Traders should conduct their own research and analysis before making any trading decisions. Market conditions can change rapidly, and it is essential to stay updated with the latest information. Always consider risk management strategies and consult with a financial advisor if necessary.


FXGlory
07.08.2024

188 (edited by FXGLORY 2024-08-09 05:09:58)

Re: Daily Analysis By FXGlory

USDCAD H4 Technical and Fundamental Analysis for 09.08.2024


https://fxglory.com/wp-content/uploads/2024/08/USDCAD-H4-Technical-And-Fundamental-Analysis-For-09.08.2024--1024x524.webp


Time Zone: GMT +3
Time Frame: 4 Hours (H4)


Fundamental Analysis:
The USDCAD currency pair is influenced today by significant economic data releases from Canada. The Canadian Employment Change report shows an increase of 26.9K jobs, which is higher than anticipated, signaling a strengthening labor market. Concurrently, the Canadian Unemployment Rate is reported at 6.5%. These figures indicate a robust economic environment in Canada, which could bolster the CAD against the USD. Traders will likely monitor these figures closely, as they could lead to increased volatility in the USDCAD pair. On the US side, no major data releases are expected, leaving the CAD's strength as the primary driver for today’s market moves.


Price Action:
On the H4 timeframe, USDCAD is currently exhibiting bearish momentum, following a breakdown from an ascending channel. The USDCAD price has moved lower after reaching a peak around 1.3938, and it is now hovering between the 50% and 61.8% Fibonacci retracement levels. The formation of lower highs and lower lows within the descending channel suggests continued bearish pressure. The recent candles show consolidation, indicating a potential pause or retracement before the next directional move.


Key Technical Indicators:
Alligator Indicator (Lips - Green, Teeth - Red, Jaws - Blue): The Alligator indicator shows the Lips below the Teeth and the Teeth below the Jaws, confirming the bearish trend. The widening of these lines further supports the continuation of the downtrend, with the current price action adhering closely to this structure.
MACD (Moving Average Convergence Divergence): The MACD histogram is below the zero line, and the MACD line is slightly below the signal line, indicating bearish momentum. The declining histogram bars suggest weakening bearish strength, which could indicate a potential for short-term consolidation or a minor bullish retracement.
%R (Williams %R): The %R is currently near the oversold region at -68.96. This suggests that the pair is approaching an area where a bullish correction might occur, although the strong downtrend could limit any significant upside movement.
Parabolic SAR (Stop and Reverse): The Parabolic SAR has recently placed dots below the candles, indicating a potential shift in momentum. However, given the prevailing downtrend and the positioning of other indicators, this could be a short-lived retracement unless supported by stronger buying pressure.


Support and Resistance:
Support: Immediate support is seen at the 1.3700 level, which aligns closely with the 61.8% Fibonacci retracement. A break below this could see the price moving towards the next significant support at 1.3600.
Resistance: The nearest resistance is at 1.3775, aligning with the 50% Fibonacci retracement. A move above this level might encounter further resistance at 1.3830.


Conclusion and Consideration:
The USDCAD pair on the H4 chart currently reflects a bearish outlook, with strong downtrend indicators and critical price levels being tested. Traders should closely watch the 61.8% Fibonacci retracement level for potential price reactions. The Canadian employment data suggests underlying strength in the CAD, which could continue to weigh on the pair. However, the potential for a minor bullish correction exists if the pair finds support at current levels.


Disclaimer: The provided analysis for USDCAD is for informational purposes only and does not constitute financial advice. Market conditions can change rapidly, and it is essential for traders to conduct their own research before making trading decisions. Consideration should be given to the potential risks involved in trading financial instruments.

Re: Daily Analysis By FXGlory

EURUSD H4 Technical and Fundamental Analysis for 12.08.2024


https://fxglory.com/wp-content/uploads/2024/08/EURUSD_H4_Chart_Daily_Technical_and_Fundamental_Analysis_for_08-1024x524.webp


Time Zone: GMT +3
Time Frame: 4 Hours (H4)


Fundamental Analysis:
The EUR/USD news analysis today is influenced by a combination of Eurozone and U.S. economic factors. Recently, the U.S. Treasury released its Monthly Treasury Statement, indicating a difference in the federal government's income and spending, which could potentially impact the U.S. Dollar depending on whether the deficit is larger or smaller than expected. Additionally, the Federal Reserve Bank of Cleveland's inflation expectations report could sway investor sentiment if the forecast differs significantly from the actual data. On the Euro side, the Wholesale Price Index (WPI) from Destatis, which indicates changes in the price of goods sold by wholesalers, will be a crucial indicator to monitor as it may hint at upcoming consumer inflation trends in the Eurozone. These factors combined suggest that market participants should remain cautious of any news releases that might have an effect on today’s EUR/USD forecast.


Price Action:
The EUR/USD H4 chart demonstrates a bearish trend for the pair also known as the ‘Fiber’, with the price nearing the Ichimoku Cloud, which it seems poised to break downward. The Fiber’s price action shows consolidation within a descending triangle pattern, indicating a potential continuation of the downtrend if the lower boundary of the pattern is breached. The recent candlesticks suggest indecision, but with a bearish bias, as indicated by the rejection of higher prices and the subsequent movement toward the triangle's lower trendline.


Key Technical Indicators:

Ichimoku Cloud:
The price is currently approaching the lower edge of the Ichimoku Cloud. A break below the cloud would signify a bearish continuation, potentially leading to further downside. The cloud ahead is thin, suggesting weak future support levels.
RSI (Relative Strength Index):
The RSI is at 51.27, hovering around the midline, which indicates a neutral stance. However, given the recent price action and the prevailing bearish trend, the RSI might dip further, signaling increasing selling pressure.
Stochastic Oscillator:
The MACD histogram shows decreasing momentum, with the MACD line close to crossing below the signal line. This potential bearish crossover could confirm a continuation of the downward trend.


Support and Resistance:

Support Levels:
The nearest resistance levels are at 1.09364 and 1.09195, which correspond to previous highs and could act as barriers to any upward movement.
Resistance Levels:
The immediate support is at 1.08962. If the price breaks below this level, it may find further support around 1.08350, which aligns with the lower boundary of the descending triangle.


Conclusion and Consideration:
The EUR/USD technical analysis on the pair’s H4 chart suggests a bearish outlook, particularly with the price nearing a critical support level within a descending triangle. The technical indicators align with this view, signaling potential downside risks if the support at 1.08962 is breached. Traders should keep an eye on the upcoming economic data releases as they could have significant effects on the Fiber’s fundamental analysis. Given the current technical setup, short positions might be favored, but caution is advised, especially around key support and resistance levels.


Disclaimer: The provided analysis is for informational purposes only and does not constitute investment advice. Traders should conduct their own research and analysis before making any trading decisions.


FXGlory
12.08.2024

190 (edited by FXGLORY 2024-08-13 00:15:39)

Re: Daily Analysis By FXGlory

GBP/AUD H4 Technical and Fundamental Analysis for 13.08.2024


https://fxglory.com/wp-content/uploads/2024/08/GBPAUD-H4-candlstickchart--1024x524.webp

Time Zone: GMT +3
Time Frame: 4 Hours (H4)


Fundamental Analysis:
The GBP/AUD forecast today is influenced by a mix of economic indicators from both the UK and Australia that paint a complex picture of the potential market directions. The UK sees a decrease in Claimant Count Change and a slight uptick in the Unemployment Rate, combined with a reduction in the Average Earnings Index. In contrast, Australia's economic indicators such as the Westpac Consumer Sentiment and NAB Business Confidence show a mixed economic sentiment, while the Wage Price Index suggests rising wage pressures. These data releases provide critical insights into the economic health of both nations, influencing the GBP/AUD trading strategy.


Price Action:
The GBP/AUD pair has been experiencing a bearish wave but shows signs of potential reversal. The price action is forming a descending triangle, with recent lows higher than previous ones, indicating weakening downward momentum. Traders should closely monitor this pattern for a breakout which could signal a new trend.


Key Technical Indicators:
RSI (Relative Strength Index): The RSI nears 45 and shows signs of a bullish reversal, which aligns with the weakening bearish momentum observed in the price action. This suggests that the current bearish trend might be losing strength.
MACD (Moving Average Convergence Divergence): The MACD indicates a decline in bearish momentum with the histogram showing less negativity, suggesting a potential shift towards a bullish market phase if the descending triangle resistance is breached.


Support and Resistance:
Support Levels:
The nearest support is at 1.93200, with additional support at 1.93000. These levels are crucial for maintaining the broader uptrend.
Resistance Levels:
The pair is facing resistance at 1.94655, with stronger resistance at 1.95555. A break above these levels could signal a continuation of the bullish trend.


Conclusion and Consideration:
The GBP/AUD H4 chart suggests that the bearish momentum is fading with key economic indicators and technical signals pointing towards a possible trend reversal. The outcome of the current patterns could be significantly influenced by further economic releases and market sentiment. Traders should maintain vigilance and adjust their strategies based on the evolving market conditions and economic data.


Disclaimer: The provided analysis is for informational purposes only and does not constitute investment advice. Traders should conduct their own research and analysis before making any trading decisions.

FXGlory
13.08.2024

Re: Daily Analysis By FXGlory

GBPUSD H4 Technical and Fundamental Analysis for 14.08.2024


https://fxglory.com/wp-content/uploads/2024/08/GBPUSDH4-candlstick-chart-1024x524.webp


Time Zone: GMT +3
Time Frame: 4 Hours (H4)


Fundamental Analysis:
The GBP/USD forecast today is shaped by ongoing developments in the UK and US economies. In the UK, recent data has shown a slight increase in the unemployment rate, which could suggest a cooling labor market, while inflation remains elevated, keeping the Bank of England on alert for further rate hikes. In the US, economic indicators like the Consumer Price Index (CPI) have shown resilience, keeping the Federal Reserve on a tightrope between taming inflation and sustaining economic growth. These factors create a complex environment for GBP/USD, as traders weigh the relative strength of both currencies.


Price Action:
The GBP/USD price recently broke above a significant dynamic resistance zone, indicating a potential end to the bearish phase that has dominated the market. The price action suggests that the pair is now entering a consolidation phase after this breakout, with the possibility of retesting the recently broken dynamic support zone before continuing its upward trajectory.


Key Technical Indicators:
RSI (Relative Strength Index): The RSI is currently in the overbought territory, hovering around 72. This suggests that the pair may be due for a short-term correction or consolidation before resuming its upward movement.
MACD (Moving Average Convergence Divergence): The MACD shows a strong buy signal, with the histogram indicating increasing bullish momentum. This aligns with the recent breakout above the resistance zone, supporting the case for further upside potential.


Support and Resistance:
Support Levels:
The nearest support is at 1.27353, which corresponds to the dynamic support zone recently broken. A retest of this level could provide a strong buying opportunity and this situation is predicted for GBPUSD. Additional support is noted at 1.26641, which would be critical if the pair sees a deeper pullback.
Resistance Levels:
Immediate resistance is seen around 1.28850. This area is forecasted to be an important area for GBPUSD A break above this level could accelerate the bullish trend. Further resistance is noted at 1.29410, which would be the next target for bulls if the current momentum continues.


Conclusion and Consideration:
The GBP/USD H4 chart analysis suggests that the bearish phase may have concluded, with the price now likely to enter a bullish trend following a potential retest of the dynamic support zone. However, traders should be cautious of the RSI being in overbought territory, indicating a possible short-term pullback or consolidation. The strong buy signal from the MACD further reinforces the potential for continued upward movement after any correction. As always, market participants should monitor upcoming economic data and global developments, adjusting their strategies accordingly.


Disclaimer: The provided analysis is for informational purposes only and does not constitute investment advice. Traders should conduct their own research and analysis before making any trading decisions.

FXGlory
14.08.2024

Re: Daily Analysis By FXGlory

AUDUSD H4 Technical and Fundamental Analysis for 15.08.2024


https://fxglory.com/wp-content/uploads/2024/08/AUDUSD_H4_Chart_Daily_Technical_and_Fundamental_Analysis_for_08_15_2024-1024x524.webp


Time Zone: GMT +3
Time Frame: 4 Hours (H4)


Fundamental Analysis:
The AUD/USD news analysis today is influenced by several key fundamental factors, these economic data are released from both Australia and the United States, most of the time leading to increased volatility in the pair commonly known as the “Aussie”. Australia's economic health, particularly in areas such as employment, inflation, and consumer spending, plays a crucial role in determining the strength of the Australian Dollar. On the other hand, the US Dollar is affected by economic indicators like retail sales, jobless claims, and manufacturing indexes. Given the interconnectedness of the global economy, shifts in US monetary policy, particularly interest rate decisions by the Federal Reserve, have a significant impact on the AUD/USD exchange rate. The upcoming economic data for the US, such as retail sales and unemployment claims, are likely to drive the pair’s market sentiment and could affect the Aussie’s forecast.


Price Action:
The AUD/USD H4 chart, shows a steady uptrend after a prolonged downtrend, as indicated by the price movements above the Ichimoku Cloud. The pair’s price action suggests that the pair is currently in a consolidation phase, with potential for continued bullish momentum. The price has recently bounced from a key support level and is now trading within a rising channel. The Aussie is facing resistance near the upper boundary of this channel, and a breakout above this level could signal a continuation of the uptrend.


Key Technical Indicators:
Ichimoku Cloud: The AUD/USD price is trending above the Ichimoku Cloud, indicating its bullish market environment. The cloud itself acts as a support zone, and the price's position above it suggests that the uptrend is still intact. However, the flat Kijun-Sen line might indicate some hesitation or consolidation in the near term.
RSI (Relative Strength Index): The RSI is hovering around 50, which is a neutral zone, suggesting that the market is not overbought or oversold. This level indicates that there is room for further price movement in either direction, but the current consolidation phase might lead to a continuation of the existing trend if the RSI begins to rise.
MACD (Moving Average Convergence Divergence): The MACD line is above the signal line, with a positive histogram, indicating that bullish momentum is still present. The increasing distance between the MACD line and the signal line suggests that the upward movement could continue if the current trend persists.


Support and Resistance:
Support Levels: The first support is located at 0.6596, which is the lower boundary of the rising channel and close to the Ichimoku Cloud. The next significant support level is at 0.6516, aligning with a previous swing low and the bottom of the cloud.
Resistance Levels: Immediate resistance is at 0.6640, which is the upper boundary of the rising channel. A breakout above this level could see the price move towards the next resistance at 0.6680, which coincides with a previous high.


Conclusion and Consideration:
The AUD/USD technical analysis today is showing signs of a potential continuation of the Aussie’s bullish trend, supported by the positive signals from the Ichimoku Cloud, MACD, and the price's position within the rising channel. The RSI indicates that the market is currently in a neutral state, allowing for further price movement in either direction. Traders should monitor the upcoming US economic data releases, as these could influence the strength of the USD and impact the AUD/USD fundamental outlook. A breakout above the 0.6640 resistance level could signal a continuation of the uptrend, while a drop below the 0.6596 support could indicate a potential reversal or deeper consolidation.


Disclaimer: The provided analysis is for informational purposes only and does not constitute investment advice. Traders should conduct their own research and analysis before making any trading decisions.


FXGlory
15.08.2024

Re: Daily Analysis By FXGlory

GBP/CAD H4 Technical and Fundamental Analysis for 16.08.2024


https://fxglory.com/wp-content/uploads/2024/08/GBPCAD-H4-Technical-and-Fundamental-Analysis-For-16.08.2024-1024x524.webp


Time Zone: GMT +3
Time Frame: 4 Hours (H4)


Fundamental Analysis:
The GBPCAD currency pair represents the exchange rate between the British Pound (GBP) and the Canadian Dollar (CAD). Today, the GBP might experience fluctuations due to upcoming economic data releases, such as the UK's retail sales figures, which can provide insight into consumer spending and economic health. Meanwhile, the CAD is likely to be influenced by the release of Canadian inflation data, which will be closely monitored for any indications of future monetary policy adjustments by the Bank of Canada. Additionally, oil prices, a critical factor for the CAD, remain volatile, potentially affecting the CAD's strength against the GBP.


Price Action:
In the H4 timeframe, the GBP/CAD has exhibited a bullish trend over the past week. The price has been moving within an ascending channel, as indicated by the clear higher highs and higher lows formation. The last three candles have been bullish, with the most recent candle closing near a key resistance level, suggesting strong buying momentum. However, the price is nearing the upper boundary of the ascending channel, which may act as a resistance zone, potentially leading to a consolidation phase or a minor pullback.


Key Technical Indicators:
Parabolic SAR (0.2): The Parabolic SAR indicator shows a bullish trend, with the last three dots placed below the candlesticks. This positioning of the Parabolic SAR below the price indicates continued upward momentum. The recent bullish candles reinforce the likelihood of further gains in the short term unless a reversal signal emerges.
Alligator Indicator: The Alligator indicator is currently bullish, with the green lips line (fastest moving average) crossing above the red teeth line (medium moving average) and the red teeth line positioned above the blue jaws line (slowest moving average). This alignment of the Alligator's lines indicates that the upward trend is strengthening, with the GBPCAD price likely to continue its bullish movement in the near term.
MACD (Moving Average Convergence Divergence): The MACD is in bullish territory, with the MACD line above the signal line. The histogram bars are positive, indicating that the bullish momentum is gaining strength. The widening gap between the MACD and the signal line suggests an acceleration in the upward trend, although traders should watch for any signs of divergence that could indicate a potential trend reversal.
%R (14): The Williams %R is currently around -8.62, indicating that the GBP CAD pair is in overbought territory. While this suggests that the bullish trend is strong, it also signals a potential for a short-term correction as the market may be overstretched. Traders should be cautious of a possible pullback or consolidation in the coming sessions.


Support and Resistance:
Support: Immediate support is located at 1.75615, which aligns with the 38.2% Fibonacci retracement level and the lower boundary of the ascending channel. This level has acted as a strong support in the past and could provide a base for further upward movement if the price tests this area.
Resistance: The nearest resistance level is at 1.76740, which corresponds to the 61.8% Fibonacci retracement level and the upper boundary of the ascending channel. A break above this level could open the door for further gains, potentially targeting the next resistance around 1.77500.


Conclusion and Consideration:
The GBP/CAD forex pair on the H4 chart shows strong bullish momentum supported by the Parabolic SAR, Alligator, MACD, and %R indicators. The current price action within the ascending channel indicates that the bulls remain in control. However, with the %R in overbought territory, there could be a risk of a short-term pullback or consolidation. Traders should be cautious around the 61.8% Fibonacci resistance level and consider any potential retracements as opportunities to re-enter the bullish trend.


Disclaimer: This GBPCAD technical and fundamental analysis is intended for informational purposes only and does not constitute investment advice. Market conditions can change rapidly, and it is essential to conduct your own analysis and stay updated with the latest information before making any trading decisions.


FXGlory
16.08.2024

Re: Daily Analysis By FXGlory

CADJPY H4 Technical and Fundamental Analysis for 19.08.2024


https://fxglory.com/wp-content/uploads/2024/08/CADJPY_H4_Chart_Daily_Technical_and_Fundamental_Analysis_for_08_19_2024-1024x524.webp


Time Zone: GMT +3
Time Frame: 4 Hours (H4)


Fundamental Analysis:
The CAD/JPY fundamental analysis today is influenced by various macroeconomic factors and market sentiment. The Canadian Dollar is often correlated with oil prices, as Canada is a major oil exporter. Rising oil prices typically strengthen the CAD. Meanwhile, the Japanese Yen, often seen as a safe-haven currency, is influenced by global risk sentiment and Japan’s economic indicators, such as machine orders and monetary policy. The upcoming release of Japan's machine orders data is crucial as it may affect the JPY by indicating the health of Japan’s manufacturing sector. A stronger-than-expected release could lead to a stronger Yen, putting pressure on the CAD/JPY forecast.


Price Action:
The CAD/JPY H4 chart shows that the pair has been in a consolidation phase after a previous downtrend. The price is currently moving within a channel, bounded by rising trendlines, suggesting a gradual upward movement. However, recent candles indicate a struggle to break above the immediate resistance, highlighting potential indecision in the market. The pair’s price action shows it has recently tested and held above a key support level, which could suggest a buildup for another upward push if it holds.


Key Technical Indicators:

Ichimoku Cloud:
The price is trading near the upper boundary of the Ichimoku Cloud, which acts as resistance. A break above this level could signal a potential bullish breakout, while failure to do so might lead to a retracement.
RSI (Relative Strength Index):
The RSI is currently at 55.90, indicating that the pair is in neutral to slightly bullish territory. There’s still room for upward movement before the market reaches overbought conditions.
MACD (Moving Average Convergence Divergence):
The MACD line is slightly above the signal line, and the histogram is in positive territory, suggesting that the bullish momentum is still intact but not overwhelmingly strong.


Support and Resistance:

Support Levels:
The key support levels are at 107.495 and 107.010, with the latter being crucial as it aligns with the lower trendline of the channel.
Resistance Levels:
Immediate resistance is found at 108.052, followed by a stronger resistance at 108.749. A break above these levels could lead to further gains toward 109.500.


Conclusion and Consideration:
The CAD/JPY technical analysis today on the pair’s H4 chart depicts a consolidation phase with the potential for an upward breakout if it can sustain above the current resistance levels. Traders should monitor the RSI for signs of overbought conditions and the MACD for any changes in momentum. Given the upcoming machine orders data from Japan, there may be increased volatility in the pair. Conservative traders might wait for a clear breakout from the current range before entering new positions. It’s also advisable to implement risk management strategies, such as stop-loss orders, especially given the pair's proximity to key resistance levels.


Disclaimer: The provided analysis is for informational purposes only and does not constitute investment advice. Traders should conduct their own research and analysis before making any trading decisions.


FXGlory
19.08.2024

Re: Daily Analysis By FXGlory

EURUSD H4 Technical and Fundamental Analysis for 21.08.2024


https://fxglory.com/wp-content/uploads/2024/08/EURUSDmH4-1024x524.webp


Time Zone: GMT +3
Time Frame: 4 Hours (H4)


Fundamental Analysis:
The EUR/USD pair, reflecting the exchange rate between the Euro and the US Dollar, is currently influenced by recent economic data releases from both the Eurozone and the United States. In the Eurozone, the latest PMI readings suggest a mixed economic outlook. The French Manufacturing PMI slightly improved to 44.4 from 44.0, indicating a marginal recovery, although the sector remains in contraction. The French Services PMI edged up to 50.2 from 50.1, pointing to stability in the services sector. Similarly, Germany’s Manufacturing PMI, while still weak at 43.4, showed a minor improvement from 43.2, whereas the Services PMI dipped slightly to 52.3 from 52.5, reflecting a slight slowdown. Meanwhile, in the United States, a significant drawdown in Crude Oil Inventories by -2.0M barrels, against expectations of a 1.4M increase, could signal potential supply constraints, influencing inflation expectations. Additionally, the upcoming FOMC Meeting Minutes will be crucial, as they are likely to offer insights into the Federal Reserve’s stance on future interest rates, a key driver of the USD's strength or weakness. These mixed economic signals suggest a cautious outlook for the EUR/USD pair, with the potential for heightened volatility depending on further developments in economic data and central bank policies.


Price Action:
On the H4 timeframe, the EUR/USD pair has experienced a robust bullish wave, propelling the price towards a significant resistance level. The recent price action has shown the formation of candlestick patterns at this resistance, indicating that the bullish momentum may be losing strength. This setup raises the possibility of a bearish correction, particularly as the price approaches this critical resistance. The technical indicators also reinforce this outlook. The MACD indicator is displaying signs of negative divergence, with the MACD line remaining below the signal line despite recent price highs, suggesting that the bullish momentum could be weakening. Similarly, the Williams %R is signaling overbought conditions, hovering near the -10 level, which typically precedes a market pullback.


Key Technical Indicators:

MACD (Moving Average Convergence Divergence): The MACD indicator is showing signs of a negative divergence, where the MACD line remains below the signal line despite the recent price highs. This divergence could indicate weakening bullish momentum and the potential for a bearish correction.
Williams %R (Percent Range): The Williams %R is also indicating overbought conditions, hovering near the -10 level, suggesting that the market might be due for a pullback.
Support and Resistance:
Support: Potential support levels to watch for a bearish correction include the 61.8% Fibonacci retracement at 1.0975, the 50% retracement at 1.0901, and the 38.2% retracement at 1.0831.
Resistance: The nearest resistance is at 1.1187, which corresponds with the current high and the 100% Fibonacci extension level.


Conclusion and Consideration:
The EUR/USD pair on the H4 chart is at a critical juncture, with potential for a bearish correction after a significant bullish wave. The negative divergence in the MACD and the overbought signal from the Williams %R suggest that a pullback could be imminent. Traders should consider short positions if the price action confirms a reversal at the current resistance level, targeting the key Fibonacci retracement levels as potential profit zones.


Disclaimer: The EURUSD provided analysis is for informational purposes only and does not constitute investment advice. Traders should conduct their own research and analysis before making any trading decisions. Market conditions can change rapidly, and it is essential to stay updated with the latest information. Always consider risk management strategies and consult with a financial advisor if necessary.


FXGlory
21.08.2024

Re: Daily Analysis By FXGlory

GBPUSD H4 Technical and Fundamental Analysis for 22.08.2024


https://fxglory.com/wp-content/uploads/2024/08/GBPUSD-H4-Technical-Analysis-for-08-22-2024-1024x524.webp


Time Zone: GMT +3
Time Frame: 4 Hours (H4)


Fundamental Analysis:
The GBP/USD news analysis today is currently influenced by several key economic indicators. For today, the focus is on the U.S. data releases, including Jobless Claims and PMI figures, which will provide insights into the U.S. economy's health. Stronger-than-expected data could bolster the U.S. Dollar, leading to potential changes in the GBP/USD exchange rate. On the other hand, the U.K.'s PMI data and CBI Industrial Trends Survey are essential for gauging the British economy's performance. Better-than-expected U.K. data could support the Pound, but overall for this pair that is also known as the “Cable”, its market sentiment will largely be driven by U.S. economic indicators due to their global impact.


Price Action:
The GBP/USD H4chart, depicts the pair in a clear uptrend, with the price moving within an ascending channel. The recent candles show the Cable’s strong bullish momentum, with the price making higher highs and higher lows. The pair’s price action suggests that the pair is likely to continue its upward trajectory, although the price is currently approaching significant resistance levels that could lead to a temporary pullback or consolidation.


Key Technical Indicators:

Ichimoku Cloud:
The price is well above the Ichimoku Cloud, which is a strong bullish signal. The Tenkan-sen (blue) and Kijun-sen (red) lines are in a bullish crossover, further supporting the upward momentum. The Chikou Span (green) is also positioned above the price, confirming the bullish trend.

RSI (Relative Strength Index):
The RSI is currently around 79.88, indicating that the pair is in overbought territory. While this suggests that the bullish momentum is strong, it also warns of a possible correction or consolidation in the near term as the market may need to cool off.


Support and Resistance:
Support Levels:
Immediate support is located at 1.3034, followed by stronger support at 1.2939, which coincides with the lower boundary of the Ichimoku Cloud.
Resistance Levels:
The pair is currently testing resistance at 1.3089, with the next significant resistance level around 1.3140.


Conclusion and Consideration:
The GBP/USD technical analysis today shows a strong bullish trend, supported by the Ichimoku Cloud and the ascending channel formation. However, the RSI indicates that the pair is overbought, suggesting that a correction could be imminent. Traders should consider the upcoming U.S. economic data releases, which could influence the pair's forecast today. A break above 1.3089 could lead to further gains, but caution is advised due to the overbought RSI. Proper risk management, including setting stop-losses below the lower channel boundary, is recommended to protect against potential market volatility.


Disclaimer: The provided analysis is for informational purposes only and does not constitute investment advice. Traders should conduct their own research and analysis before making any trading decisions.


FXGlory
22.08.2024

197 (edited by FXGLORY 2024-08-26 01:43:40)

Re: Daily Analysis By FXGlory

USDCAD H4 Technical and Fundamental Analysis for 08.26.2024


https://fxglory.com/wp-content/uploads/2024/08/USDCAD_H4_Chart_Daily_Technical_and_Fundamental_Analysis_for_08.26.2024--1024x536.jpg


Time Zone: GMT +3
Time Frame: 4 Hours (H4)


Fundamental Analysis:
The USD/CAD news analysis today is influenced by a variety of macroeconomic factors, including crude oil prices (since Canada is a major oil exporter), interest rate differentials between the Federal Reserve and the Bank of Canada, and economic indicators such as GDP growth, employment data, and inflation rates. Additionally, recent data releases related to U.S. durable goods orders are crucial as they indicate future production levels and economic strength. An actual reading higher than forecasted is generally seen as positive for the U.S. dollar. As a leading indicator of economic activity, a robust increase in these orders can signal that manufacturers anticipate stronger demand, which could support the USD against other currencies, including the CAD, subsequently affecting the pair also known as the “Loonie.”


Price Action:
The USD/CAD H4 chart shows the pair’s bearish trend, characterized by a series of lower highs and lower lows. The Loonie’s price action has seen a downward momentum, breaking below key support levels, and trending within a downward-sloping channel. The pair’s candlestick patterns indicate selling pressure, with a lack of significant bullish reversal signs at the moment. A breakdown below the current support zone could lead to further declines, confirming the continuation of the bearish trend.


Key Technical Indicators:
Ichimoku Cloud:
The price is trading below the Ichimoku cloud, indicating the pair’s bearish market sentiment. The cloud itself is acting as a resistance, and the lagging span (Chikou Span) confirms this bearish outlook as it is also below the price action. The future cloud is thin and bearish, suggesting that there is no immediate sign of reversal in this downtrend.
RSI (Relative Strength Index): The RSI is currently at 21, indicating that the market is in oversold territory. This suggests that while the bearish momentum is strong, there might be a potential for a short-term corrective bounce. However, oversold conditions alone do not indicate a reversal but rather that the current trend might be overstretched.
Stochastic Oscillator: The Stochastic indicator is also in the oversold region (around 10.92), which aligns with the RSI reading, indicating that the selling pressure might be nearing exhaustion. The possibility of a bullish crossover in the stochastic lines may hint at a potential short-term recovery, but confirmation is needed.


Support and Resistance:
Support Levels:
Immediate support is seen at the 1.35062 level, which aligns with the lower boundary of the current descending channel. A break below this level could open the way towards further downside targets around 1.3450.
Resistance Levels: The nearest resistance level is marked at 1.35574, followed by a more significant resistance at 1.36139, which corresponds to the upper boundary of the descending channel and the Ichimoku cloud’s lower edge.


Conclusion and Consideration:
The USD/CAD technical analysis today on the H4 timeframe is exhibiting its strong bearish sentiment, as evidenced by the technical indicators and the descending price channel. While oversold conditions on the RSI and Stochastic indicators suggest a possible short-term correction, the prevailing trend remains bearish. Traders should watch for the price action around the key support and resistance levels for potential breakout or reversal signals. The Loonie’s Fundamental analysis data, such as the upcoming durable goods orders release, could provide additional volatility and direction for the USD/CAD forecast. Risk management strategies, including the use of stop-loss orders, are advisable given the current market conditions.


Disclaimer: The provided analysis is for informational purposes only and does not constitute investment advice. Traders should conduct their own research and analysis before making any trading decisions.


FXGlory
08.26.2024

Re: Daily Analysis By FXGlory

USD/JPY H4 Technical and Fundamental Analysis for 08.27.2024


https://fxglory.com/wp-content/uploads/2024/08/USDJPYH4-1024x524.webp


Time Zone: GMT +3
Time Frame: 4 Hours (H4)


Fundamental Analysis:
The upcoming economic data releases from both the US and Japan are set to influence the USD/JPY pair's direction prediction. In the US, key indicators such as the S&P/CS Composite-20 HPI y/y, HPI m/m, CB Consumer Confidence, and Richmond Manufacturing Index will be released. The S&P/CS Composite-20 HPI y/y is expected to show a slight decrease from 6.8% to 6.2%, indicating a cooling in the housing market. Meanwhile, the CB Consumer Confidence index is expected to rise to 100.9 from a previous 100.3, suggesting improved consumer sentiment. The Richmond Manufacturing Index is projected to show an improvement from -17 to -14, which still indicates contraction but at a slower pace. These mixed data points could create a volatile trading environment for the USD.
On the Japanese side, the Services Producer Price Index (SPPI) y/y is forecasted to slightly decrease from 3.0% to 2.9%, signaling a potential slowdown in price pressures; which stands as an important forecast element for this fore pair. The BOJ Core CPI y/y is expected to remain stable at 2.1%, suggesting persistent inflation concerns within Japan. The stable inflation rate and the recent dovish stance of the Bank of Japan could continue to exert downward pressure on the JPY.


Price Action:
The USD/JPY pair is forming a bearish flag pattern on the H4 chart after a significant bearish wave, which suggests a potential continuation of the downward trend. The price is currently consolidating within this pattern, and a breakout to the downside could accelerate the bearish momentum. However, the presence of bullish technical indicators points to a possible short-term corrective wave.


Key Technical Indicators:
RSI (Relative Strength Index):
The RSI is currently at 41.70, indicating bearish sentiment, yet it is not in the oversold territory, suggesting room for further downside before a reversal might occur.
MACD (Moving Average Convergence Divergence): The Stochastic is approaching the 70 level, indicating potential for a bullish wave in the short term if it crosses above this threshold. This could signal a temporary upward correction within the broader bearish trend.


Support and Resistance:
Support Levels:
The nearest support is at the lower trendline of the bearish flag pattern, around 144.00. A break below this level could see the pair testing the next support near 142.50, which aligns with previous lows.
Resistance Levels: Immediate resistance is at the upper trendline of the bearish flag, around 145.00. A break above this level could target the next resistance at 146.50, potentially invalidating the bearish flag pattern and signaling a bullish reversal.

Conclusion and Consideration:
The USD/JPY H4 chart suggests that the pair is consolidating within a bearish flag pattern, with potential for further downside if key support levels are breached. Traders should closely monitor the upcoming economic data releases from both the US and Japan, as these could provide the catalyst for the next major move. Given the mixed signals from technical indicators and fundamental outlook, traders should be prepared for both bearish and short-term bullish scenarios, adapting their strategies accordingly to the evolving market conditions.


Disclaimer: The provided analysis is for informational purposes only and does not constitute investment advice. Traders should conduct their own research and analysis before making any trading decisions.


FXGlory
08.27.2024

Re: Daily Analysis By FXGlory

EURUSD H4 Technical and Fundamental Analysis for 28.08.2024


https://fxglory.com/wp-content/uploads/2024/08/EURUSDH4-1024x524.webp


Time Zone: GMT +3
Time Frame: 4 Hours (H4)


Fundamental Analysis:

The EUR/USD pair, reflecting the exchange rate between the Euro and the US Dollar, is currently navigating through various economic data releases from both the Eurozone and the United States. In the Eurozone, inflation data has presented a mixed picture. Germany's Preliminary Consumer Price Index (CPI) came in flat at 0.0% for the month, below expectations of a 0.3% increase, suggesting subdued inflationary pressures in Europe's largest economy. Meanwhile, Spain's Flash CPI showed a year-on-year increase of 2.4%, which is below the anticipated 2.8%, indicating lower inflationary momentum than expected. These figures suggest that inflation concerns might be less pronounced in the Eurozone, possibly leading to a more dovish stance from the European Central Bank.

On the US side, economic indicators such as the Preliminary Gross Domestic Product (GDP) q/q showed a stable 2.8% growth rate, aligning with market expectations. This stability is indicative of a resilient economic outlook in the US. Additionally, the Unemployment Claims remained consistent at 232K, further reinforcing a stable labor market. The Preliminary GDP Price Index, also stable at 2.3%, aligns with market forecasts, indicating controlled inflation in the US. These stable economic indicators in the US might support the Federal Reserve's current monetary policy stance, impacting the USD's strength relative to the Euro.


Price Action:

On the H4 timeframe, the EUR/USD pair has experienced a notable bullish wave, driving the price higher towards key resistance levels. Recent price action suggests that this bullish momentum may be waning, as indicated by candlestick patterns that show indecision or possible reversal near these resistance levels. A bearish correction could be on the horizon, particularly if the bullish momentum fails to break through the established resistance.


Key Technical Indicators:

Ichimoku Cloud: The Ichimoku Cloud analysis shows that Tenkan-sen (blue line) is about to cross below Kijun-sen (red line), a bearish signal suggesting potential trend reversal. The price has been trading above the cloud, indicating an uptrend, but the potential Tenkan-Kijun crossover is a warning of a shift in momentum.

Relative Strength Index (RSI): The RSI is showing a negative divergence, where the price makes higher highs, but the RSI fails to confirm those highs, indicating weakening bullish momentum. Currently, RSI is at 55.8787, which is in the neutral zone but leaning towards overbought conditions.

Volume Analysis: The volume has not significantly supported the recent bullish wave, implying that the upward momentum might lack the strength to sustain a further rally. Lower volume during price increases often indicates potential exhaustion of buying interest.


Support and Resistance:

Support: The nearest resistance level is at 1.1187, which is a recent high and could serve as a barrier for further upward movement. A break above this level could signal the continuation of the bullish trend.
Resistance: Key support levels to monitor include 1.1100, near the base of the Ichimoku cloud, and further below at 1.0975, where a significant Fibonacci retracement level lies.


Conclusion and Consideration:
The EUR/USD pair on the H4 chart is showing signs of a potential bearish correction following a strong bullish wave. Negative divergence in the RSI, a potential bearish Tenkan-sen and Kijun-sen crossover in the Ichimoku Cloud, and low volume support suggest that the bullish momentum may be fading. Traders should look for confirmation of a reversal through price action around the current resistance level before considering short positions. Profit-taking could be aimed at key support levels like 1.1100 and 1.0975, using tight stop-losses to manage risk effectively.


Disclaimer: The EUR/USD analysis provided is for informational purposes only and does not constitute investment advice. Traders should conduct their own research and analysis before making any trading decisions. Market conditions can change rapidly, and it is essential to stay updated with the latest information. Always consider risk management strategies and consult with a financial advisor if necessary.


FXGlory
28.08.2024

200 (edited by FXGLORY 2024-08-29 02:42:09)

Re: Daily Analysis By FXGlory

AUDUSD H4 Technical and Fundamental Analysis for 08.29.2024


https://fxglory.com/wp-content/uploads/2024/08/AUDUSDH4-Technical-Analysis-08.-29.2024--1024x524.webp


Time Zone: GMT
Time Frame: 4 Hours (H4)


Fundamental Analysis:
The Australian Dollar (AUD) against the US Dollar (USD) is experiencing potential volatility due to key economic events scheduled today. In the US, the market will closely watch Raphael Bostic's speech at the Federal Reserve Bank of Atlanta, where his comments may provide insights into future monetary policy directions, affecting the USD's strength. Moreover, important data releases like the GDP Second Release and Unemployment Claims are expected, which can offer clues about the US economy's health and labor market. On the AUD side, no major economic releases are scheduled for today, which may keep the currency influenced primarily by external factors, especially from the USD.


Price Action:
The AUDUSD forex pair is showing a bullish trend on the H4 chart. The pair is trading within an ascending channel, with the recent candles moving towards the upper boundary. The last two candlesticks have shown positive movement, with the most recent candle being bullish, indicating sustained upward momentum. The AUD/USD price is currently moving between the 61.8% and 100% Fibonacci retracement levels, edging closer to the 100% mark. This suggests a strong upward bias, with the potential to test higher resistance levels.


Key Technical Indicators:
Bollinger Bands: The Bollinger Bands have tightened, indicating reduced volatility and a potential buildup for a breakout. The price has been trading in the upper half of the bands and is now near the upper band, suggesting that the bullish momentum is still intact. This position implies a higher probability of further upward movement in the AUD USD price. However, traders should watch for any signs of reversal as the price approaches the upper band limit.
MACD (Moving Average Convergence Divergence): The MACD line is positioned above the signal line, and the histogram is showing positive but decreasing momentum. This indicates that while the bullish trend persists, the strength behind the movement is diminishing. Forex traders should watch for any potential crossover, which could signal a shift in momentum and a possible price correction in the AUD/USD pair.
RSI (Relative Strength Index): The RSI is currently at 61.23, which is below the overbought threshold of 70. This suggests that there is still room for upward movement before the AUD-USD reaches overbought conditions. The RSI supports the ongoing bullish trend and indicates that the market is not overly stretched.
Parabolic SAR: The Parabolic SAR dots have shifted below the price, indicating a bullish trend. This shift supports the upward movement, with the dots acting as potential support levels. As long as the Parabolic SAR remains below the price, the bullish bias in the AUD USD is likely to continue.


Support and Resistance Levels:
Support: The immediate support is at the 61.8% Fibonacci level, around 0.67100, followed by stronger support near 0.66865, which aligns with the 50% retracement level.
Resistance: The primary resistance is at the 100% Fibonacci retracement level, approximately 0.68345. If the price breaks above this level, the next target could be the upper boundary of the ascending channel.


Conclusion and Consideration:
The AUDUSD pair on the H4 chart shows continued bullish momentum, underpinned by positive price action and supported by the technical indicators like Bollinger Bands, MACD, RSI, and Parabolic SAR. While the trend remains upward, caution is advised due to the tightening Bollinger Bands and the decreasing momentum shown by the MACD histogram. Upcoming economic events and data releases, especially from the US, could introduce volatility and influence price movements. Traders should monitor these developments closely and consider employing risk management strategies to navigate potential market fluctuations.


Disclaimer: This AUDUSD analysis is for informational purposes only and does not constitute investment advice. Traders should conduct their own research and analysis before making any trading decisions. Market conditions can change rapidly, and it is essential to stay updated with the latest information.


FXGlory
08.29.2024

Posts: 176 to 200 of 204

Pages Previous 1 6 7 8 9 Next

You must login or register to post a reply

Forex Software → Market Analysis → Daily Analysis By FXGlory

Similar topics in this forum