forex software

Create and Test Forex Strategies

forex software

Skip to forum content

Forex Software

Create and Test Forex Strategies

You are not logged in. Please login or register.


(Page 67 of 72)

Forex Software → Market Analysis → Technical Analysis by FXOpen

Pages Previous 1 65 66 67 68 69 72 Next

You must login or register to post a reply

RSS topic feed

Posts: 1,651 to 1,675 of 1,778

1,651

Re: Technical Analysis by FXOpen

Gold Price (XAU/USD) Is Testing an Important Resistance Zone
https://i.imgur.com/SfMmlDQ.png

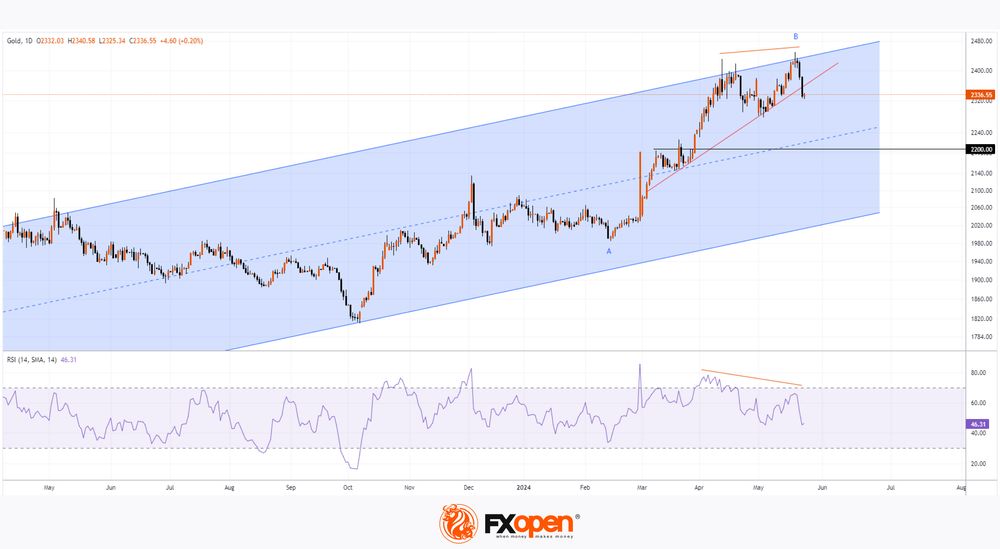
On April 16, we wrote why the $2,380 zone is an important resistance area.

The XAU/USD chart shows that:

1) After fading fluctuations (they formed a narrowing consolidation triangle - shown in green), the price of gold dropped sharply (shown by a black arrow) on April 22-23.

2) Then, the price found support in the form of the lower border of the ascending channel (shown in blue), which has been in effect since the beginning of March. This led to the formation of another consolidation pattern between the blue lines.

3) An upward breakdown of the red lines on May 9 could be interpreted as an attempt by the bulls to resume the upward trend within the blue channel, but we could expect that the green triangle with its axis around 2380 would provide resistance.

https://i.imgur.com/9kqmGpQ.jpeg

TO VIEW THE FULL ANALYSIS, VISIT THE FXOPEN BLOG

Disclaimer: This article represents the opinion of the Companies operating under the FXOpen brand only (excluding FXOpen EU). It is not to be construed as an offer, solicitation, or recommendation with respect to products and services provided by the Companies operating under the FXOpen brand, nor is it to be considered financial advice.

1,652

Re: Technical Analysis by FXOpen

Market Analysis: EUR/USD Sees Green as USD/JPY Gains Bullish Traction
https://i.imgur.com/5pSSkUd.png

EUR/USD is slowly gaining traction above the 1.0800 level. USD/JPY trimmed almost all losses and showing positive signs above 156.20.

Important Takeaways for EUR/USD and USD/JPY Analysis Today

  • The Euro started a decent increase above the 1.0750 pivot level.

  • There is a key bullish trend line forming with support near 1.0800 on the hourly chart of EUR/USD at FXOpen.

  • USD/JPY climbed higher above the 155.95 and 156.50 levels.

  • There is a connecting bullish trend line forming with support near 156.20 on the hourly chart at FXOpen.

EUR/USD Technical Analysis
https://i.imgur.com/iDMLYT0.jpeg

On the hourly chart of EUR/USD at FXOpen, the pair started a fresh increase from the 1.0725 zone. The Euro cleared a few key hurdles near 1.0750 to move into a positive zone against the US Dollar.

The pair settled above the 1.0800 level and the 50-hour simple moving average. A high was formed at 1.0830 and the pair is now consolidating gains. Immediate support is near the 23.6% Fib retracement level of the upward move from the 1.0775 swing low to the 1.0827 high at 1.0815.

The first major support on the EUR/USD chart is near 1.0800. There is also key bullish trend line forming with support near 1.0800 and the 50% Fib retracement level of the upward move from the 1.0775 swing low to the 1.0827 high.

The next key support is at 1.0790. If there is a downside break below 1.0790, the pair could drop toward 1.0750. The next support is near 1.0725, below which the pair could start a major decline.

On the upside, the pair is now facing resistance near the 1.0830 zone. The next major resistance is near 1.0850. An upside break above 1.0850 could set the pace for another increase. In the stated case, the pair might rise toward 1.0920.

TO VIEW THE FULL ANALYSIS, VISIT THE FXOPEN BLOG

Disclaimer: This article represents the opinion of the Companies operating under the FXOpen brand only (excluding FXOpen EU). It is not to be construed as an offer, solicitation, or recommendation with respect to products and services provided by the Companies operating under the FXOpen brand, nor is it to be considered financial advice.

1,653

Re: Technical Analysis by FXOpen

The S&P 500 Index Has Reached a Significant Resistance Level
https://i.postimg.cc/rwdVTJrB/sp500.png

Analyzing the S&P 500 chart (US SPX 500 mini on FXOpen) on April 26, we wrote about how the April decline could be a correction to the lower boundary of the channel within the 2024 rally. Following this, a logical development would be for the bulls to attempt to resume the upward trend and make another attempt to breach the 5250 level.

Today, May 15, the price of the S&P 500 index (US SPX 500 mini on FXOpen) is at the 5250 level after a bullish breakout of the trendline (shown in red) that delineated the correction.

The price has risen by approximately 4.5% since the beginning of May as earnings season has not been disappointing, and traders anticipate the Federal Reserve will ease monetary policy.

Is further index growth possible?

Ben Snyder, Senior US Equity Market Strategist at Goldman Sachs, is positive in the long term but notes that:
→ the S&P 500 index has already surpassed the 5200 target level indicated by the bank's analysts;
→ an obvious risk of growth lies in the fact that companies may need to significantly raise profit forecasts.

Fundamental background has a significant influence on the dynamics of the S&P 500 index (US SPX 500 mini on FXOpen). For example, yesterday Producer Price Index (PPI) data was released. According to ForexFactory: PPI m/m actual = 0.5%, expected = 0.3%, a month ago = -0.1%.

The initial market reaction was a decline in the price of the S&P 500 index (US SPX 500 mini on FXOpen) – perhaps market participants were spooked by rising producer prices and the prospect of higher Fed rates. However, this was followed by a statement from Fed Chair Powell, who reassured the markets. According to him:
→ the next Fed move is unlikely to be a rate hike;
→ the PPI data is more "mixed than hot", considering that the previous period's data was revised downwards.
https://i.postimg.cc/NfCsZV58/151-3.jpg

TO VIEW THE FULL ANALYSIS, VISIT THE FXOPEN BLOG

Disclaimer: This article represents the opinion of the Companies operating under the FXOpen brand only (excluding FXOpen EU). It is not to be construed as an offer, solicitation, or recommendation with respect to products and services provided by the Companies operating under the FXOpen brand, nor is it to be considered financial advice.

1,654

Re: Technical Analysis by FXOpen

The Stock Price of PepsiСo (PEP) Is Retracting from Its Yearly High
https://i.postimg.cc/vZ3V2MnQ/wsd.jpg

On April 23, the quarterly report of PepsiCo's performance for the first quarter was published, which was awaited anxiously.

The issue stemmed from the fact that in December 2023, the U.S. Food and Drug Administration (FDA) announced the recall of over 40 Quaker Oats products – a company owned by PepsiCo – due to potential salmonella contamination. This led to a 22% decline in sales volume of Quaker Food products in the first quarter.

However, the report exceeded expectations:
→ Earnings per share: Actual = $1.16, Expected = $1.518;
→ Gross revenue: Actual = $18.25 billion, Expected = $18.08 billion.

By April 25, the stock price of PepsiCo (PEP) reached its yearly high, surpassing the $180 mark.

Then, this week, specifically May 13, the stock price of PepsiCo (PEP) hit a new yearly high, exceeding $181.

https://i.postimg.cc/W12Z7thW/152-2.jpg

TO VIEW THE FULL ANALYSIS, VISIT THE FXOPEN BLOG

Disclaimer: This article represents the opinion of the Companies operating under the FXOpen brand only (excluding FXOpen EU). It is not to be construed as an offer, solicitation, or recommendation with respect to products and services provided by the Companies operating under the FXOpen brand, nor is it to be considered financial advice.

1,655

Re: Technical Analysis by FXOpen

The US Dollar Is Weakening Following Inflation Data
https://i.postimg.cc/cJM9yZfQ/yen2.png

Yesterday saw the release of key economic indicators for the US. According to ForexFactory:

→ Core Price Index (CPI) monthly: actual = 0.3%, expected = 0.4%, previous = 0.4%;

→ Core Price Index (CPI) annual: actual = 3.4%, expected = 3.4%, previous = 3.5%;

→ Retail Sales monthly: actual = 0.0%, expected = 0.4%, previous = 0.6%.

Concerns about rising inflation did not materialise. Reuters reports that unchanged retail sales suggest conditions are forming for interest rate cuts.

Financial markets reacted significantly, with the US dollar weakening:

→ As we reported yesterday, signs of slowing inflation increased market participants' belief in imminent rate cuts, leading to the S&P 500 stock index (US SPX 500 mini on FXOpen) reaching an all-time high;

→ Gold prices reached a high not seen since April 21;

→ Other currencies strengthened against the US dollar.

An interesting situation is developing on the USD/JPY chart. Applying Fibonacci ratios, we note three instances where price recovery halted around the 0.382 level:

→ Recovery from B to C following the impulsive decline from A to B;

→ Recovery from D to E after the impulsive decline from C to D;

→ Recovery from F to G after the 3-wave decline from A to F.

https://i.postimg.cc/fbh2rkSz/161-2.jpg

TO VIEW THE FULL ANALYSIS, VISIT THE FXOPEN BLOG

Disclaimer: This article represents the opinion of the Companies operating under the FXOpen brand only (excluding FXOpen EU). It is not to be construed as an offer, solicitation, or recommendation with respect to products and services provided by the Companies operating under the FXOpen brand, nor is it to be considered financial advice.

1,656

Re: Technical Analysis by FXOpen

Dollar Adjusts After the Publication of Inflation Data in the US
https://i.postimg.cc/Bv5d4krG/yen.png

Data on the Consumer Price Index (CPI) in the US, released yesterday, had a significant impact on the pricing of major currency pairs. According to the provided report:

  • The core Consumer Price Index, which excludes food and energy costs, increased by 0.3% from the previous month, while experts had forecasted 0.4%.

  • Retail sales remained unchanged at 0.0%, contrary to analysts' expectations of 0.4%.

As a result of the publication of such data, the dollar depreciated against almost all major currencies. For instance, the USD/JPY currency pair retreated from its peak at 156.60, the EUR/USD strengthened by more than 100 pips within a couple of hours, and buyers of the GBP/USD pair tested a significant resistance level at 1.2700.

The main reason for the sharp decline of the dollar against G-10 currencies is likely due to the possibility that slowing inflation growth and a weak labour market could prompt the Federal Reserve to change its monetary policy direction and reduce the base interest rate in the coming months.

USD/JPY

According to technical analysis of the USD/JPY pair on the daily timeframe, a "bearish engulfing" pattern has formed, the confirmation of which could contribute to a retest of the important area between 152.80-152.00. If dollar buyers manage to establish themselves above 154.90, the price may resume its upward movement towards recent highs around 156.00.

Macro-economic data that could influence the pricing of the pair in the upcoming trading sessions:

  • Today at 15:30 (GMT +3:00), the number of initial jobless claims in the US.

  • Today at 15:30 (GMT +3:00), the Philadelphia Fed Manufacturing Index (US).

https://i.postimg.cc/R0xkr4bR/1505.png

TO VIEW THE FULL ANALYSIS, VISIT THE FXOPEN BLOG

Disclaimer: This article represents the opinion of the Companies operating under the FXOpen brand only (excluding FXOpen EU). It is not to be construed as an offer, solicitation, or recommendation with respect to products and services provided by the Companies operating under the FXOpen brand, nor is it to be considered financial advice.

1,657

Re: Technical Analysis by FXOpen

Bitcoin Price Hits a Month's High, Breaking Key Resistance
https://i.postimg.cc/tTgfH5Fq/btc1.png

Yesterday's release of CPI figures suggests that inflation is slowing down and a rate cut could be on the horizon. This weakened the dollar and boosted the value of assets priced in dollars, including BTC/USD.

As a result, the price of Bitcoin hit a May high.

Meanwhile, there is sustained demand in the market driven by institutional participants investing in Bitcoin ETFs. According to media reports citing 13F filings:
→ JP Morgan invested $731,246 USD
→ Wells Fargo invested $141,817 USD in Grayscale's GBTC.
→ Similar activity is observed with other traditional banks like BNP Paribas and BNY Mellon, indicating a broader industry trend.
https://i.postimg.cc/9MNkX7BG/BTCUSD1605.jpg

TO VIEW THE FULL ANALYSIS, VISIT THE FXOPEN BLOG

Disclaimer: This article represents the opinion of the Companies operating under the FXOpen brand only (excluding FXOpen EU). It is not to be construed as an offer, solicitation, or recommendation with respect to products and services provided by the Companies operating under the FXOpen brand, nor is it to be considered financial advice.

1,658

Re: Technical Analysis by FXOpen

Market Analysis: AUD/USD and NZD/USD Set Sights on Additional Upside
https://i.postimg.cc/2SW33KMj/aud1.png

AUD/USD started a decent increase above the 0.6655 resistance. NZD/USD is also rising and could aim for a move above the 0.6140 resistance.

Important Takeaways for AUD/USD and NZD/USD Analysis Today

  • The Aussie Dollar found support at 0.6585 and recovered higher against the US Dollar.

  • There is a major bullish trend line forming with support at 0.6670 on the hourly chart of AUD/USD at FXOpen.

  • NZD/USD is consolidating gains above the 0.6100 support.

  • There is a key bullish trend line forming with support at 0.6100 on the hourly chart of NZD/USD at FXOpen.

AUD/USD Technical Analysis
https://i.postimg.cc/N0wFXxv6/audusd1705.jpg
On the hourly chart of AUD/USD at FXOpen, the pair formed a base above 0.6585. The Aussie Dollar started a decent increase above the 0.6630 resistance against the US Dollar, as mentioned in the previous analysis.

The bulls pushed the pair above the 0.6655 resistance zone. There was a close above the 0.6685 resistance and the 50-hour simple moving average. Finally, the pair tested the 0.6715 zone. A high was formed at 0.6714 before the pair corrected gains.

It tested the 0.6655 zone and is currently consolidating gains. There was a fresh increase above the 23.6% Fib retracement level of the downward move from the 0.6714 swing high to the 0.6654 low.

On the upside, the AUD/USD chart indicates that the pair is now facing resistance near the 50% Fib retracement level of the downward move from the 0.6714 swing high to the 0.6654 low at 0.6685. The first major resistance might be 0.6715.

An upside break above the 0.6715 resistance might send the pair further higher. The next major resistance is near the 0.6750 level. Any more gains could clear the path for a move toward the 0.6800 resistance zone.

If not, the pair might correct lower. Immediate support is near a major bullish trend line at 0.6670. The next support could be 0.6655. If there is a downside break below the 0.6655 support, the pair could extend its decline toward the 0.6630 zone. Any more losses might signal a move toward 0.6585.

TO VIEW THE FULL ANALYSIS, VISIT THE FXOPEN BLOG

Disclaimer: This article represents the opinion of the Companies operating under the FXOpen brand only (excluding FXOpen EU). It is not to be construed as an offer, solicitation, or recommendation with respect to products and services provided by the Companies operating under the FXOpen brand, nor is it to be considered financial advice.

1,659

Re: Technical Analysis by FXOpen

The Share Price of Alibaba (BABA) Has Reached Its Yearly High
https://i.postimg.cc/PfFmw031/ali.jpg

On 14 May, Alibaba released its first-quarter performance report:
→ Earnings per share: actual = $1.404, expected = $1.421;
→ Gross income: actual = $30.716 billion, expected = $30.502 billion.

The fact that earnings per share were slightly below expectations did not disappoint investors much, as on 16 May, Alibaba's share price (BABA) reached a yearly high, exceeding $86, forming a wide bullish candlestick with a close near the top (a sign of strong demand).

Positive sentiments were also driven by:
→ Another Chinese company, JD.com, released a report that exceeded expectations;
→ US regulators published information that well-known investor Michael Burry invested in Alibaba shares. David Tepper, head of the hedge fund Appaloosa Management, also holds a bullish outlook;
→ According to a note published on X (Twitter) by Citron Research analysts, Alibaba's share price could rise to $100.
https://i.postimg.cc/nz3qTWHb/171-2-1.jpg

TO VIEW THE FULL ANALYSIS, VISIT THE FXOPEN BLOG

Disclaimer: This article represents the opinion of the Companies operating under the FXOpen brand only (excluding FXOpen EU). It is not to be construed as an offer, solicitation, or recommendation with respect to products and services provided by the Companies operating under the FXOpen brand, nor is it to be considered financial advice.

1,660

Re: Technical Analysis by FXOpen

The Price of Silver Has Reached Its Highest Level in Over Three Years
https://i.postimg.cc/6p539QwK/silver.jpg

As indicated by the XAG/USD chart today, the intraday price of silver reached $29.84 per ounce yesterday, while the previous yearly high on 12 April was $29.79. The last time this price was seen was in February 2021.

It is worth noting that today the price of silver is behaving more bullishly than the price of gold, which is approximately 1.5% below its April high.

The main factor contributing to the rise in the price of silver is likely the weakening of the US dollar, as traders expect the Federal Reserve to ease monetary policy.

Can the price of silver continue to rise? Analysts are generally bullish. As CNBC reports:
→ Saxo Bank strategists recently stated in an analytical review that the price of silver could rise to $30, while gold could soon test the $2,400 level.
→ Analysts at ROTH Capital Partners forecast that the prices of gold and silver will rise even higher in the coming months. According to JC O'Hara, Chief Market Technician, if the price breaks the $30 level, "there will be few resistance levels until the $35/$37 range."

Let’s provide more data for a technical analysis of the silver market.
https://i.postimg.cc/XNdXLhxR/172-2.jpg

TO VIEW THE FULL ANALYSIS, VISIT THE FXOPEN BLOG

Disclaimer: This article represents the opinion of the Companies operating under the FXOpen brand only (excluding FXOpen EU). It is not to be construed as an offer, solicitation, or recommendation with respect to products and services provided by the Companies operating under the FXOpen brand, nor is it to be considered financial advice.

1,661

Re: Technical Analysis by FXOpen

Watch FXOpen's 13 - 17 May Weekly Market Wrap Video

Weekly Market Wrap With Gary Thomson: S&P500, US Dollar, Gold Price, PEP Stocks

Get the latest scoop on the week's hottest headlines, all in one convenient video. Join Gary Thomson, the COO of FXOpen UK, as he breaks down the most significant news reports and shares his expert insights.

  • The S&P500 Has Reached a Significant Resistance Level

  • US Dollar Adjusts after the Publication of Inflation Data in the US

  • Gold Price (XAU/USD) Is Testing an Important Resistance Zone

  • The Stock Price of PepsiCo (PEP) Is Retracting from its Yearly High

Stay in the know and empower yourself with our short, yet power-packed video.

Watch it now and stay updated with FXOpen.

Don't miss out on this invaluable opportunity to sharpen your trading skills and make informed decisions.

https://i.postimg.cc/1thMhVwk/maxresdefault-1.jpg

FXOpen YouTube


Disclaimer: This article represents the opinion of the Companies operating under the FXOpen brand only (excluding FXOpen EU). It is not to be construed as an offer, solicitation, or recommendation with respect to products and services provided by the Companies operating under the FXOpen brand, nor is it to be considered financial advice.

#fxopen #fxopenyoutube #fxopenint #weeklyvideo

1,662

Re: Technical Analysis by FXOpen

Coinbase (COIN) Stock Price Holds at Key Support Level
https://i.imgur.com/UNpV8Uo.jpeg

On Thursday, stock market traders were concerned about the sharp drop in Coinbase shares, listed on the Nasdaq, which fell by 9%. This was triggered by rumours that the Chicago-based CME Group is planning to launch cryptocurrency trading, posing a challenge to Coinbase, currently the leading cryptocurrency exchange in the US.

It is worth noting that CME already trades Bitcoin futures (since December 2017) and Ethereum futures (since February 2021). Is it possible for CME to launch spot cryptocurrency trading?

On one hand, interest in the cryptocurrency market has surged in 2024, with Bitcoin’s price up approximately 58% year-to-date, and around 146% over the past 12 months.

On the other hand, CME Group, as the world’s largest operator of exchange-traded derivatives, is considered a fundamental part of the US financial system. The SEC is unlikely to be favourable towards initiating cryptocurrency trading there, given their reputation for high risk.

Nevertheless, the sharp decline in Coinbase shares on Thursday did not continue into Friday.

https://i.imgur.com/x9jWML3.png

TO VIEW THE FULL ANALYSIS, VISIT FXOPEN BLOG

Disclaimer: This article represents the opinion of the Companies operating under the FXOpen brand only (excluding FXOpen EU). It is not to be construed as an offer, solicitation, or recommendation with respect to products and services provided by the Companies operating under the FXOpen brand, nor is it to be considered financial advice.

1,663

Re: Technical Analysis by FXOpen

Commodity Currencies Retreat from Local Highs
https://i.imgur.com/n4SHAhu.jpeg

Despite the cooling labour market in the US and declining inflation, the American currency continues to move towards new highs. For instance, the USD/JPY currency pair might update the current month's high at 156.70, the NZD/USD sharply declines after retesting 0.6140, and buyers of the USD/CAD pair have confidently secured a position above 1.3600.

USD/CAD

The corrective pullback in the USD/CAD pair ended just below 1.3600. According to technical analysis, on May 16th, a bullish "piercing line" pattern formed on the daily timeframe for USD/CAD. The completion of this pattern could lead to a retest of the key range 1.3690-1.3660. If the price remains above these levels in the coming weeks, the pair’s rise could resume towards 1.3850-1.3820. A drop below 1.3600 could contribute to a more extensive downward correction towards 1.3530-1.3470. Important indicators that may affect USD/CAD pricing in the coming trading sessions:

  • Today at 15:30 (GMT +3:00) - Canada’s Core Consumer Price Index (CPI) for April

  • Tomorrow at 17:00 (GMT +3:00) - US Existing Home Sales

https://i.imgur.com/SR6g1xz.png

TO VIEW THE FULL ANALYSIS, VISIT FXOPEN BLOG

Disclaimer: This article represents the opinion of the Companies operating under the FXOpen brand only (excluding FXOpen EU). It is not to be construed as an offer, solicitation, or recommendation with respect to products and services provided by the Companies operating under the FXOpen brand, nor is it to be considered financial advice.

1,664 (edited by Resolve 2024-05-21 14:29:30)

Re: Technical Analysis by FXOpen

Tech Stocks Back in Vogue as Nasdaq 100 Rallies to Record High
https://i.imgur.com/grbJjbe.png

The tech-heavy Nasdaq 100 index (US Tech 100 mini on FXOpen’s TickTrader platform) reached a new all-time high on Monday, closing the trading session at 18,684.2 according to FXOpen pricing, fueled by renewed investor enthusiasm for technology stocks.

This remarkable feat underscores the resurgence of the tech sector, which has been buoyed by speculation surrounding two key factors: the highly anticipated earnings report from semiconductor giant NVIDIA and the possibility of interest rate cuts by the Federal Reserve.

NVIDIA's Earnings Anticipation

NVIDIA, a leading player in the rapidly growing artificial intelligence (AI) market, is set to release its earnings report on Wednesday. Investors are eagerly awaiting this announcement, with expectations running high for another quarter of impressive financial performance.

The company's cutting-edge chips are in high demand for AI applications, positioning it as a frontrunner in this transformative technology.

The anticipation surrounding NVIDIA's earnings has ignited a frenzy in the tech sector, driving up share prices and contributing to the US Tech 100 mini's record-breaking performance. Investors are betting on NVIDIA's continued dominance in the AI space, which could further propel the stock and the broader tech market.

TO VIEW THE FULL ANALYSIS, VISIT FXOPEN BLOG

Disclaimer: This article represents the opinion of the Companies operating under the FXOpen brand only (excluding FXOpen EU). It is not to be construed as an offer, solicitation, or recommendation with respect to products and services provided by the Companies operating under the FXOpen brand, nor is it to be considered financial advice.

1,665

Re: Technical Analysis by FXOpen

Gold Price Reaches Historic High
https://i.imgur.com/Zw8oNIN.png

According to confirmed information, Iranian President Ebrahim Raisi, considered a potential successor to the country's supreme leader, Ayatollah Ali Khamenei, died in a helicopter crash in a mountainous area near the border with Azerbaijan. The helicopter also carried Foreign Minister Hossein Amir-Abdollahian and other officials, all of whom perished.

As news of the helicopter search in the inaccessible mountainous region spread, the price of gold rose significantly. Yahoo Finance reports that the gold rally was driven by uncertainty about the situation in Iran.

The XAU/USD chart indicates that yesterday, at the peak of the day, the price of gold reached $2450, an all-time high. Can the rally continue?

https://i.imgur.com/H3e4nPV.jpeg

TO VIEW THE FULL ANALYSIS, VISIT FXOPEN BLOG

Disclaimer: This article represents the opinion of the Companies operating under the FXOpen brand only (excluding FXOpen EU). It is not to be construed as an offer, solicitation, or recommendation with respect to products and services provided by the Companies operating under the FXOpen brand, nor is it to be considered financial advice.

1,666

Re: Technical Analysis by FXOpen

Market Analysis: GBP/USD Climbs Steadily While EUR/GBP Struggles
https://i.imgur.com/0drK0Jl.png

GBP/USD is gaining pace above the 1.2640 resistance. EUR/GBP declined steadily below the 0.8565 and 0.8550 support levels.

Important Takeaways for GBP/USD and EUR/GBP Analysis Today

  • The British Pound is attempting a fresh increase above 1.2700.

  • There is a key bullish trend line forming with support near 1.2690 on the hourly chart of GBP/USD at FXOpen.

  • EUR/GBP is trading in a bearish zone below the 0.8565 pivot level.

  • EUR/GBP is trading in a bearish zone below the 0.8565 pivot level.

GBP/USD Technical Analysis
https://i.imgur.com/jyQXDup.jpeg

On the hourly chart of GBP/USD at FXOpen, the pair remained well-bid above the 1.2520 level. The British Pound started a decent increase above the 1.2600 zone against the US Dollar.

The bulls were able to push the pair above the 50-hour simple moving average and 1.2640. The pair even climbed above 1.2700 and traded as high as 1.2726. Recently, there was a minor decline below the 23.6% Fib retracement level of the upward move from the 1.2656 swing low to the 1.2726 high, but the bulls were active above 1.2700.

On the upside, the GBP/USD chart indicates that the pair is facing resistance near 1.2725. The next major resistance is near 1.2740.

A close above the 1.2740 resistance zone could open the doors for a move toward 1.2780. Any more gains might send GBP/USD toward 1.2850. On the downside, there is a key support forming near a bullish trend line at 1.2690. It is close to the 50% Fib retracement level of the upward move from the 1.2656 swing low to the 1.2726 high.

If there is a downside break below 1.2690, the pair could accelerate lower. The next major support is at 1.2640. The next key support is seen near 1.2600, below which the pair could test 1.2520. Any more losses could lead the pair toward the 1.2500 support.

TO VIEW THE FULL ANALYSIS, VISIT THE FXOPEN BLOG

Disclaimer: This article represents the opinion of the Companies operating under the FXOpen brand only (excluding FXOpen EU). It is not to be construed as an offer, solicitation, or recommendation with respect to products and services provided by the Companies operating under the FXOpen brand, nor is it to be considered financial advice.

1,667

Re: Technical Analysis by FXOpen

GBP/USD Rate Surges to Two-Month High After Inflation News
https://i.imgur.com/Uh7yurK.png

Today, the Consumer Price Index (CPI) figures for the UK were published. According to ForexFactory:

→ Annual CPI: actual = 2.3%; expected = 2.1%; previous = 3.2%.

→ Annual Core CPI: actual = 3.9%; expected = 3.6%; previous = 4.2%.

Thus, it can be asserted that:

→ The current inflation level is at its lowest since 2021.

→ It is close to the target levels of 2%.

However, economists polled by Reuters had expected a sharper drop to 2.1%, based on falling energy prices.

Additionally, inflation in the services sector (a key indicator monitored by the Bank of England due to the dominance of this sector in the UK economy) only slightly decreased to 5.9% from 6%.

As a result, CNBC reports that market participants have reduced the likelihood of the Bank of England easing monetary policy:

→ The probability of a rate cut in June has decreased to 15% compared to 50% before the inflation news was published.

→ The probability of a rate cut in August was estimated at 40% compared to 70% before the publication.

The currency market reacted with a surge in volatility – the GBP/USD rate jumped to a two-month high, reaching the 1.27555 level. However, as the market absorbed the data, the price began to gradually decline.

https://i.imgur.com/u1VlefM.jpeg

TO VIEW THE FULL ANALYSIS, VISIT THE FXOPEN BLOG

Disclaimer: This article represents the opinion of the Companies operating under the FXOpen brand only (excluding FXOpen EU). It is not to be construed as an offer, solicitation, or recommendation with respect to products and services provided by the Companies operating under the FXOpen brand, nor is it to be considered financial advice.

1,668

Re: Technical Analysis by FXOpen

After Earnings Report, NVDA Stock Price Exceeds $1,000
https://i.imgur.com/JiKWRCu.png

For the first time in history, Nvidia's stock price has reached a four-digit number, and its market capitalisation has surpassed $2.5 trillion, ranking third globally after Microsoft and Apple. This surge is due to a strong earnings report, driven by high demand for AI chips:

→ Earnings per share: actual = $6.12, expected = $5.60;
→ Gross revenue: actual = $26.04 billion, expected = $24.59 billion.

Additionally, Nvidia announced a 10-for-1 stock split to make shares more accessible and attract new investors, which should support NVDA stock in the future.

While yesterday's main trading session closed around $950 per share, the price rose by approximately 6% in after-hours trading. Thus, NVDA's stock price has increased by over 100% since the beginning of the year. Can the rally continue?

On March 28, in the article "Stock Market Analysis: NVDA Losing Leadership?", we:
→ Noted signs of weakness relative to the S&P 500 index;
→ Constructed an ascending blue channel;
→ Suggested a potential pullback to the $800 level.

https://i.imgur.com/ztTiChq.jpeg

TO VIEW THE FULL ANALYSIS, VISIT THE FXOPEN BLOG

Disclaimer: This article represents the opinion of the Companies operating under the FXOpen brand only (excluding FXOpen EU). It is not to be construed as an offer, solicitation, or recommendation with respect to products and services provided by the Companies operating under the FXOpen brand, nor is it to be considered financial advice.

1,669

Re: Technical Analysis by FXOpen

EUR/USD Price Forms Bullish Reversal Amid Key News
https://i.imgur.com/LxPx3AI.png

Last night, the FOMC meeting minutes were released. According to USNews, there were no major surprises. However, the confirmation of persistent inflation – along with hints that some officials discussed potential future rate hikes – displayed a "hawkish" stance. The dollar index initially rose following the minutes' release but returned to pre-release levels this morning, suggesting the initial reaction might have been incorrect.

Subsequently, the Purchasing Managers' Index (PMI) data for key European economies was published. According to ForexFactory:
→ Flash Manufacturing PMI (France): actual = 46.7; expected = 45.8; previous = 45.3;
→ Flash Services PMI (France): actual = 49.4; expected = 51.8; previous = 51.3;
→ Flash Manufacturing PMI (Germany): actual = 45.4; expected = 43.4; previous = 42.5;
→ Flash Services PMI (Germany): actual = 53.9; expected = 53.5; previous = 53.2.

Overall, the actual PMI figures, considered a leading indicator of economic health, exceeded expectations and gave the euro a bullish push.

The combined effect of the euro's rise and the dollar's decline since midnight resulted in a four-hour EUR/USD chart candle with a long lower tail (indicated by an arrow), suggesting demand outweighs supply. A subsequent bullish candle could confirm this.

https://i.imgur.com/8Yw0cDL.jpeg

TO VIEW THE FULL ANALYSIS, VISIT THE FXOPEN BLOG

Disclaimer: This article represents the opinion of the Companies operating under the FXOpen brand only (excluding FXOpen EU). It is not to be construed as an offer, solicitation, or recommendation with respect to products and services provided by the Companies operating under the FXOpen brand, nor is it to be considered financial advice.

1,670

Re: Technical Analysis by FXOpen

USD to CAD Analytical Predictions in 2024, 2025 and Beyond
https://i.imgur.com/okN3HJf.jpeg

This comprehensive article delves into the intricacies of the USD to CAD exchange rate, exploring the factors that may influence its trajectory in 2024, 2025, and beyond. From economic outlooks to key market drivers, this article provides valuable insights for traders navigating the complexities of currency trading.

The Canadian Dollar's Recent Performance

Over the past several years, the USD/CAD exchange rate has experienced a variety of shifts, reflecting broader economic trends and specific events in both the United States and Canada. To see how the pair’s movements have unfolded over the years, head over to FXOpen’s free TickTrader platform to interact with live USD/CAD charts.

Throughout 2019, the USD/CAD exchange rate remained relatively stable, fluctuating between 1.35 and 1.30. This period was marked by heightened trade tensions between the US and its key trading partners, primarily China, which had a ripple effect on the pair due to both the US and Canada's significant trade relationships.

TO VIEW THE FULL ARTICLE, VISIT THE FXOPEN BLOG

Disclaimer: This article represents the opinion of the Companies operating under the FXOpen brand only (excluding FXOpen EU). It is not to be construed as an offer, solicitation, or recommendation with respect to products and services provided by the Companies operating under the FXOpen brand, nor is it to be considered financial advice.

1,671

Re: Technical Analysis by FXOpen

European Currencies Testing Key Levels: Contributing Factors
https://i.imgur.com/xBdfZAr.png

In recent trading sessions, a significant amount of crucial macroeconomic data has been released from the US, Europe, and the UK:

  • Wednesday: Consumer Price Index (CPI) in the UK (the figure came in higher than experts' forecast at 2.3% versus 2.1%)

  • Wednesday: Publication of the minutes from the latest Federal Reserve meeting

  • Thursday: US Manufacturing PMI (the figure exceeded experts' forecast at 50.9 versus 50.0)

This rich mix of data contributed to the USD/JPY pair testing 157.00, EUR/USD sellers attempting to break key support at 1.0800, and the GBP/USD pair halting its recent strengthening and returning to 1.2700.

EUR/USD

Technical analysis of the EUR/USD pair indicates the development of a bearish “dark cloud cover” pattern on the daily timeframe, formed on May 16. If the pair's sellers manage to break the support at 1.0800, the downward movement of the pair could extend towards 1.0730-1.0710. A resumption of the upward movement can be expected once the price moves above 1.0900. Today, several macroeconomic indicators are due for release, which could either reinforce the current trend or lead to the formation of reversal patterns:

  • Today at 09:00 (GMT+3:00) Germany's Q1 GDP

  • Today at 13:00 (GMT+3:00) Eurogroup Meeting

TO VIEW THE FULL ANALYSIS, VISIT THE FXOPEN BLOG

Disclaimer: This article represents the opinion of the Companies operating under the FXOpen brand only (excluding FXOpen EU). It is not to be construed as an offer, solicitation, or recommendation with respect to products and services provided by the Companies operating under the FXOpen brand, nor is it to be considered financial advice.

1,672

Re: Technical Analysis by FXOpen

Market Analysis: Gold Price and Crude Oil Price Signal Bearish Acceleration
https://i.imgur.com/6P4LdTA.png

Gold price started a sharp decline from $2,450. Crude oil prices declined steadily below the $80.00 support and moved into a bearish zone.

Important Takeaways for Gold and Oil Prices Analysis Today

  • Gold price climbed higher toward the $2,450 zone before there was a sharp decline against the US Dollar.

  • A key bearish trend line is forming with resistance near $2,375 on the hourly chart of gold at FXOpen.

  • Crude oil prices extended downsides below the $78.00 support zone.

  • A major bearish trend line is forming with resistance near $78.00 on the hourly chart of XTI/USD at FXOpen.

Gold Price Technical Analysis

On the hourly chart of Gold at FXOpen, the price rallied heavily above the $2,350 resistance. The price even spiked above $2,425 before the bears appeared.

A high was formed near $2,450 before there was a major decline. There was a move below the $2,400 support level. The bears even pushed the price below the $2,355 support and the 50-hour simple moving average.

https://i.imgur.com/LyL9jcS.jpeg

VIEW THE FULL ANALYSIS, VISIT THE FXOPEN BLOG

Disclaimer: This article represents the opinion of the Companies operating under the FXOpen brand only (excluding FXOpen EU). It is not to be construed as an offer, solicitation, or recommendation with respect to products and services provided by the Companies operating under the FXOpen brand, nor is it to be considered financial advice.

1,673

Re: Technical Analysis by FXOpen

S&P-500 Analysis: Good News is Bad News
https://i.imgur.com/BWVn5b8.png

Yesterday, S&P Global reported its Purchasing Managers' Index (PMI) values for the US, which exceeded expectations. According to ForexFactory:

→ Manufacturing PMI: actual = 50.9; expected = 50.0; previous = 50.0.

→ Services PMI: actual = 54.8 (the highest value since May 2023); expected = 51.2; previous = 51.3.

However, the high PMI values, indicating a healthy economy, led to a drop in the stock index. The S&P-500 index (US SPX 500 mini on FXOpen) fell by more than 1.5% following the publication.

What explains this case of "good news is bad news"?

The point is, amid high business activity, manufacturers reported rising prices for a range of resources, suggesting that goods inflation might strengthen in the coming months. Stock market participants might have interpreted this as a reason for the Federal Reserve to maintain high rates for a longer period – hence the sharp decline in the index.

"Companies remain cautious with respect to the economic outlook amid uncertainty over the future path of inflation and interest rates, and continue to cite worries over geopolitical instabilities and the presidential election," said Chris Williamson, Chief Business Economist at S&P Global Market Intelligence, in an interview with Reuters.

TO VIEW THE FULL ANALYSIS, VISIT THE FXOPEN BLOG

Disclaimer: This article represents the opinion of the Companies operating under the FXOpen brand only (excluding FXOpen EU). It is not to be construed as an offer, solicitation, or recommendation with respect to products and services provided by the Companies operating under the FXOpen brand, nor is it to be considered financial advice.

1,674

Re: Technical Analysis by FXOpen

Gold Price Drops Over 3.6% in 2 Days
https://i.postimg.cc/fbSvqXxZ/gold-2.png

The price of gold has fallen by more than 3.6% over 2 days, as indicated by today's XAU/USD chart. The day before yesterday, at the opening of the daily candle, the price of gold was $2421 per ounce, and yesterday at the close it was $2331.

This can be explained by market participants expecting higher Federal Reserve interest rates for a longer period. However, although gold is a hedge against inflation, it has two drawbacks:
→ It does not inherently generate income;
→ The gold market may be overvalued – after all, a historical peak was reached on May 20th.

Therefore, investors are increasingly paying attention to bonds – they also allow hedging against inflation, while their yields are rising.

https://i.postimg.cc/W1XKcMFk/gold-2.jpg

TO VIEW THE FULL ANALYSIS, VISIT THE FXOPEN BLOG

Disclaimer: This article represents the opinion of the Companies operating under the FXOpen brand only (excluding FXOpen EU). It is not to be construed as an offer, solicitation, or recommendation with respect to products and services provided by the Companies operating under the FXOpen brand, nor is it to be considered financial advice.

1,675

Re: Technical Analysis by FXOpen

Watch FXOpen's 20 - 24 May Weekly Market Wrap Video

Weekly Market Wrap With Gary Thomson: Nasdaq 100, NVIDIA, EUR/USD, Gold price

Get the latest scoop on the week's hottest headlines, all in one convenient video. Join Gary Thomson, the COO of FXOpen UK, as he breaks down the most significant news reports and shares his expert insights.

  • Tech Stocks Back in Vogue as Nasdaq 100 Rallies to Record High

  • After Earnings Report, NVDA Stock Price Exceeds $1,000

  • EUR/USD Price Forms Bullish Reversal Amid Key News

  • Gold Price Reaches Historic High

Stay in the know and empower yourself with our short, yet power-packed video.

Watch it now and stay updated with FXOpen.

Don't miss out on this invaluable opportunity to sharpen your trading skills and make informed decisions.

https://i.imgur.com/2MpvDtJ.jpeg

FXOpen YouTube


Disclaimer: This article represents the opinion of the Companies operating under the FXOpen brand only (excluding FXOpen EU). It is not to be construed as an offer, solicitation, or recommendation with respect to products and services provided by the Companies operating under the FXOpen brand, nor is it to be considered financial advice.

#fxopen #fxopenyoutube #fxopenint #weeklyvideo

Posts: 1,651 to 1,675 of 1,778

Pages Previous 1 65 66 67 68 69 72 Next

You must login or register to post a reply

Forex Software → Market Analysis → Technical Analysis by FXOpen

Similar topics in this forum