forex software

Create and Test Forex Strategies

forex software

Skip to forum content

Forex Software

Create and Test Forex Strategies

You are not logged in. Please login or register.


(Page 44 of 44)

Forex Software → Market Analysis → Forex Technical Analysis & Forecast by RoboForex

Pages Previous 1 42 43 44

You must login or register to post a reply

RSS topic feed

Posts: 1,076 to 1,099 of 1,099

Re: Forex Technical Analysis & Forecast by RoboForex

Technical Analysis & Forecast 07.02.2024

EURUSD, “Euro vs US Dollar”

The EURUSD pair has completed a correction wave to the 1.0745 level. By now, a consolidation range has formed around this level. Today the market has escaped this range upwards, suggesting a further correction to 1.0770. Once it is over, the decline wave could extend to 1.0700, from where the trend might continue to 1.0666.

https://roboforex.com/uploads/roboforecast/roboforex_com/99/2024/TA/february/07/EURUSDH1.png

Read more - Technical Analysis & Forecast 07.02.2024

Re: Forex Technical Analysis & Forecast by RoboForex

Ichimoku Cloud Analysis 08.02.2024 (GBPUSD, XAGUSD, USDCHF)

GBPUSD, “Great Britain Pound vs US Dollar”

GBPUSD is testing the signal lines of the indicator. The instrument is going below the Ichimoku Cloud, which suggests a downtrend. A test of the Kijun-Sen line at 1.2565 is expected, followed by a decline to 1.2485. An additional signal confirming the decline could be a rebound from the upper boundary of the bearish channel. The scenario can be cancelled by a breakout of the upper boundary of the Cloud with the price finding a foothold above 1.2730, which will mean further growth to 1.2820. Meanwhile, the decline could be confirmed by a breakout of the lower boundary of the ascending channel with the price finding a foothold under the 1.2605 level.

https://roboforex.com/uploads/roboforecast/roboforex_com/99/2024/Ichimoku/february/08/gbpusd.png

Read more - Ichimoku Cloud Analysis GBPUSD, XAGUSD, USDCHF

Re: Forex Technical Analysis & Forecast by RoboForex

Japanese Candlesticks Analysis 09.02.2024 (XAUUSD, NZDUSD, GBPUSD)

XAUUSD, “Gold vs US Dollar”

Gold has formed a Hammer pattern. Currently, the instrument might go by the reversal signal in an ascending wave. The growth target might be 2050.00. Upon testing the resistance, the price could break it and continue developing the uptrend. However, the quotes might pull back to 2025.00 before growth.

https://roboforex.com/uploads/roboforecast/roboforex_com/99/2024/Candles/february/09/XAUUSDH4.png

Read more - Japanese Candlesticks Analysis XAUUSD, NZDUSD, GBPUSD

Re: Forex Technical Analysis & Forecast by RoboForex

Ichimoku Cloud Analysis 12.02.2024 (GBPUSD, USDCAD, USDJPY)

GBPUSD, “Great Britain Pound vs US Dollar”

GBPUSD is rebounding from the lower boundary of the Cloud. The instrument is going below the Ichimoku Cloud, which suggests a downtrend. A test of the upper boundary of the Cloud at 1.2640 is expected, followed by a decline to 1.2475. An additional signal confirming the decline could be a rebound from the upper boundary of the bearish channel. The scenario can be cancelled by a breakout of the upper boundary of the Cloud with the price finding a foothold above 1.2675, which will mean further growth to 1.2765. Meanwhile, the decline could be confirmed by a breakout of the lower boundary of the ascending channel with the price finding a foothold under 1.2575.

https://roboforex.com/uploads/roboforecast/roboforex_com/99/2024/Ichimoku/february/12/gbpusd.png

Read more - Ichimoku Cloud Analysis GBPUSD, USDCAD, USDJPY

Re: Forex Technical Analysis & Forecast by RoboForex

Murrey Math Lines 13.02.2024 (AUDUSD, NZDUSD)

AUDUSD, “Australian Dollar vs US Dollar”

AUDUSD quotes are below the 200-day Moving Average on H4, indicating the prevalence of a downtrend. The RSI has rebounded from the resistance line. In this situation, a test of 2/8 (0.6469) is expected, followed by a breakout of this level and a subsequent decline to the support at 1/8 (0.6408). The scenario could be cancelled by rising above the resistance at 3/8 (0.6530), in which case the pair might grow to 4/8 (0.6591).

https://roboforex.com/uploads/roboforecast/roboforex_com/99/2024/Murrey/february/13/1.png

Read more - Murrey Math Lines AUDUSD, NZDUSD

Re: Forex Technical Analysis & Forecast by RoboForex

Technical Analysis & Forecast 14.02.2024

EURUSD, “Euro vs US Dollar”

The EURUSD pair has reached the estimated target of a decline wave at 1.0700. The structure of the last decline target implies a correction link to 1.0734 that might form today. Practically, a consolidation range might form between these two levels. With an escape from the range downwards, a decline link to 1.0680 is not excluded. With an escape upwards, the correction might extend to 1.0777.

https://roboforex.com/uploads/roboforecast/roboforex_com/99/2024/TA/february/14/EURUSDH1.png

Read more - Technical Analysis & Forecast 14.02.2024

Re: Forex Technical Analysis & Forecast by RoboForex

Murrey Math Lines 15.02.2024 (USDCHF, XAUUSD)

USDCHF, “US Dollar vs Swiss Franc”

USDCHF quotes are in the overbought area on H4. The RSI has breached the support line. As a result, in this situation, a downward breakout of +1/8 (0.8850) is expected, followed by a decline to the support at 7/8 (0.8728). The scenario could be cancelled by a rise above the resistance at +2/8 (0.8911), which will reshuffle the Murrey indication, after which new price targets will be set.

https://roboforex.com/uploads/roboforecast/roboforex_com/99/2024/Murrey/february/15/1.png

Read more - Murrey Math Lines USDCHF, XAUUSD

Re: Forex Technical Analysis & Forecast by RoboForex

Japanese Candlesticks Analysis 16.02.2024 (EURUSD, USDJPY, EURGBP)

EURUSD, “Euro vs US Dollar”

EURUSD has formed a Shooting Star reversal pattern near the resistance level on H4. Currently, the instrument is going by the reversal signal in a descending wave. The decline target might be the support at 1.0710. However, the price could correct to 1.0800 and extend the downtrend after the test of the resistance.

https://roboforex.com/uploads/roboforecast/roboforex_com/99/2024/Candles/february/16/EURUSDH4.png

Read more - Japanese Candlesticks Analysis EURUSD, USDJPY, EURGBP

Re: Forex Technical Analysis & Forecast by RoboForex

Ichimoku Cloud Analysis 19.02.2024 (GBPUSD, USDCHF, USDCAD)

GBPUSD, “Great Britain Pound vs US Dollar”

GBPUSD is correcting after a rebound from the support. The instrument is going below the Ichimoku Cloud, which suggests a downtrend. A test of the lower boundary of the Cloud at 1.2630 is expected, followed by a decline to 1.2465. An additional signal confirming the decline could be a rebound from the upper boundary of the bearish channel. The scenario can be cancelled by a breakout of the upper boundary of the Cloud with the price finding a foothold above 1.2675, which will mean further growth to 1.2765.

https://roboforex.com/uploads/roboforecast/roboforex_com/99/2024/Ichimoku/february/19/gbpusd.png

Read more - Ichimoku Cloud Analysis GBPUSD, USDCHF, USDCAD

Re: Forex Technical Analysis & Forecast by RoboForex

Murrey Math Lines 20.02.2024 (AUDUSD, NZDUSD)

AUDUSD, “Australian Dollar vs US Dollar”

AUDUSD quotes are below the 200-day Moving Average on H4, revealing the prevalence of a downtrend. The RSI has rebounded from the resistance line. In this situation, the pair is expected to drop to the nearest support at 2/8 (0.6469). The scenario could be cancelled by rising above the resistance at 4/8 (0.6591), which could lead to a trend reversal and provoke growth to the 5/8 (0.6652) level.

https://roboforex.com/uploads/roboforecast/roboforex_com/99/2024/Murrey/february/20/1.png

Read more - Murrey Math Lines AUDUSD, NZDUSD

Re: Forex Technical Analysis & Forecast by RoboForex

Technical Analysis & Forecast 21.02.2024

EURUSD, “Euro vs US Dollar”

The EURUSD pair formed a structure of a growth wave to 1.0838 and a decline structure to 1.0803 today. Currently, a growth link to 1.0820 is forming. Practically, a new consolidation range might go by these levels. With an escape upwards, the range might expand to 1.0850. With a downward escape, the potential for a new decline wave to 1.0755 could open. This is the first target.

https://roboforex.com/uploads/roboforecast/roboforex_com/99/2024/TA/february/21/EURUSDH1.png

Read more - Technical Analysis & Forecast 21.02.2024

Re: Forex Technical Analysis & Forecast by RoboForex

Japanese Candlesticks Analysis 22.02.2024 (XAUUSD, NZDUSD, GBPUSD)

XAUUSD, “Gold vs US Dollar”

Gold has formed a Hammer reversal pattern. Currently, the instrument is going by the reversal signal in an ascending wave. The growth target might be the 2040.00 level. Upon testing the resistance, the price could rebound from this level and continue developing the downtrend. However, the quotes might drop to the 2020.00 mark without testing the resistance.

https://roboforex.com/uploads/roboforecast/roboforex_com/99/2024/Candles/february/22/XAUUSDH4.png

Read more - Japanese Candlesticks Analysis XAUUSD, NZDUSD, GBPUSD

1,088

Re: Forex Technical Analysis & Forecast by RoboForex

Murrey Math Lines 21.03.2024 (USDCHF, XAUUSD)

USDCHF, “US Dollar vs Swiss Franc”

USDCHF quotes are above the 200-day Moving Average on H4, indicating a prevailing uptrend. The RSI has rebounded from the support line. In this situation, the price is expected to rebound from the 5/8 (0.8850) level and rise to the resistance at 6/8 (0.8911). The scenario could be cancelled by breaking below the support at 4/8 (0.8789), which could lead to a trend reversal, pushing the pair down to 3/8 (0.8728).

https://roboforex.com/uploads/roboforecast/roboforex_com/99/2024/Murrey/march/21/1.png

On M15, the upper line of the VoltyChannel is too far away from the current price, so a rebound from the 5/8 (0.8850) level on H4 will signal a price rise.

https://roboforex.com/uploads/roboforecast/roboforex_com/99/2024/Murrey/march/21/2.png

XAUUSD, “Gold vs US Dollar”

Gold quotes are above the 200-day Moving Average on H4, which indicates a prevailing uptrend. The RSI has reached the overbought area. In this situation, the price is expected to test the 6/8 (2187.50) level and rebound from it, rising to the resistance at 8/8 (2250.00). The scenario could be cancelled by a breakout of the 6/8 (2187.50) level. In this case, Gold quotes might decline to the support at 4/8 (2125.00).

https://roboforex.com/uploads/roboforecast/roboforex_com/99/2024/Murrey/march/21/3.png

Read more - Murrey Math Lines (USDCHF, XAUUSD)

Attention!
Forecasts presented in this section only reflect the author’s private opinion and should not be considered as guidance for trading. RoboForex bears no responsibility for trading results based on trading recommendations described in these analytical reviews.

Sincerely,
The RoboForex Team

1,089 (edited by Vlad RF 2024-03-22 11:25:18)

Re: Forex Technical Analysis & Forecast by RoboForex

Murrey Math Lines 22.03.2024 (Brent, S&P 500)

Brent
Brent quotes are above the 200-day Moving Average on H4, indicating a prevailing uptrend. The RSI is approaching the support line. In this situation, the price is expected to test the 6/8 (84.71) level and rebound from it, rising to the resistance at 8/8 (87.50). The scenario could be cancelled by breaking below the 6/8 (84.71) level. In this case, Brent quotes could drop to the support at 5/8 (82.81).

https://roboforex.com/uploads/roboforecast/roboforex_com/99/2024/Murrey/march/22/1.png

On M15, the price rise could be additionally confirmed by a breakout of the upper boundary of the VoltyChannel.

https://roboforex.com/uploads/roboforecast/roboforex_com/99/2024/Murrey/march/22/2.png

S&P 500
S&P 500 quotes are above the 200-day Moving Average on H4, indicating a prevailing uptrend. The RSI is testing the support level. In this situation, the price is expected to rise further to the nearest resistance at 8/8 (5312.5). The scenario could be cancelled by a breakout of the 7/8 (5234.4) level. In this case, the S&P 500 index could decline to the support at 6/8 (5156.2).

https://roboforex.com/uploads/roboforecast/roboforex_com/99/2024/Murrey/march/22/3.png

Read more - Murrey Math Lines (Brent, S&P 500)

Attention!
Forecasts presented in this section only reflect the author’s private opinion and should not be considered as guidance for trading. RoboForex bears no responsibility for trading results based on trading recommendations described in these analytical reviews.

Sincerely,
The RoboForex Team

1,090

Re: Forex Technical Analysis & Forecast by RoboForex

Murrey Math Lines 25.03.2024 (EURUSD, GBPUSD)

EURUSD, “Euro vs US Dollar”
The EURUSD pair stands below the 200-day Moving Average on H4, indicating the prevalence of a downtrend. The RSI is testing the support line. In this situation, a breakout of the 2/8 (1.0803) level is expected, followed by a decline to the support at 0/8 (1.0742). The scenario could be cancelled by rising above 3/8 (1.0833), in which case, the quotes might correct to the resistance at 4/8 (1.0864).

https://roboforex.com/uploads/roboforecast/roboforex_com/99/2024/Murrey/march/25/1.png

On M15, the lower boundary of the VoltyChannel is broken, which increases the probability of a further price decline.

https://roboforex.com/uploads/roboforecast/roboforex_com/99/2024/Murrey/march/25/2.png

GBPUSD, “Great Britain Pound vs US Dollar”
The GBPUSD pair stands below the 200-day Moving Average on H4, indicating the prevalence of a downtrend. However, a convergence has formed on the RSI. As a result, in this situation, the quotes are expected to break the 3/8 (1.2634) level, rising to the resistance at 4/8 (1.2695) afterwards. The scenario might be cancelled by a breakout of 2/8 (1.2573), in which case, the pair could continue falling and drop to the support at 1/8 (1.2512).

https://roboforex.com/uploads/roboforecast/roboforex_com/99/2024/Murrey/march/25/3.png

Read more - Murrey Math Lines (EURUSD, GBPUSD)

Attention!
Forecasts presented in this section only reflect the author’s private opinion and should not be considered as guidance for trading. RoboForex bears no responsibility for trading results based on trading recommendations described in these analytical reviews.

Sincerely,
The RoboForex Team

1,091

Re: Forex Technical Analysis & Forecast by RoboForex

Japanese Candlesticks Analysis 26.03.2024 (XAUUSD, NZDUSD, GBPUSD

XAUUSD, “Gold vs US Dollar”
Gold has formed a Harami reversal pattern. Currently, the instrument might go by the reversal signal in an ascending wave. The growth target could be 2230.00. Upon testing the resistance, the price might break it and continue developing the uptrend. However, the quotes could correct to 2150.50 before rising.

https://roboforex.com/uploads/roboforecast/roboforex_com/99/2024/Candles/march/26/XAUUSDH4.png

NZDUSD, “New Zealand Dollar vs US Dollar”
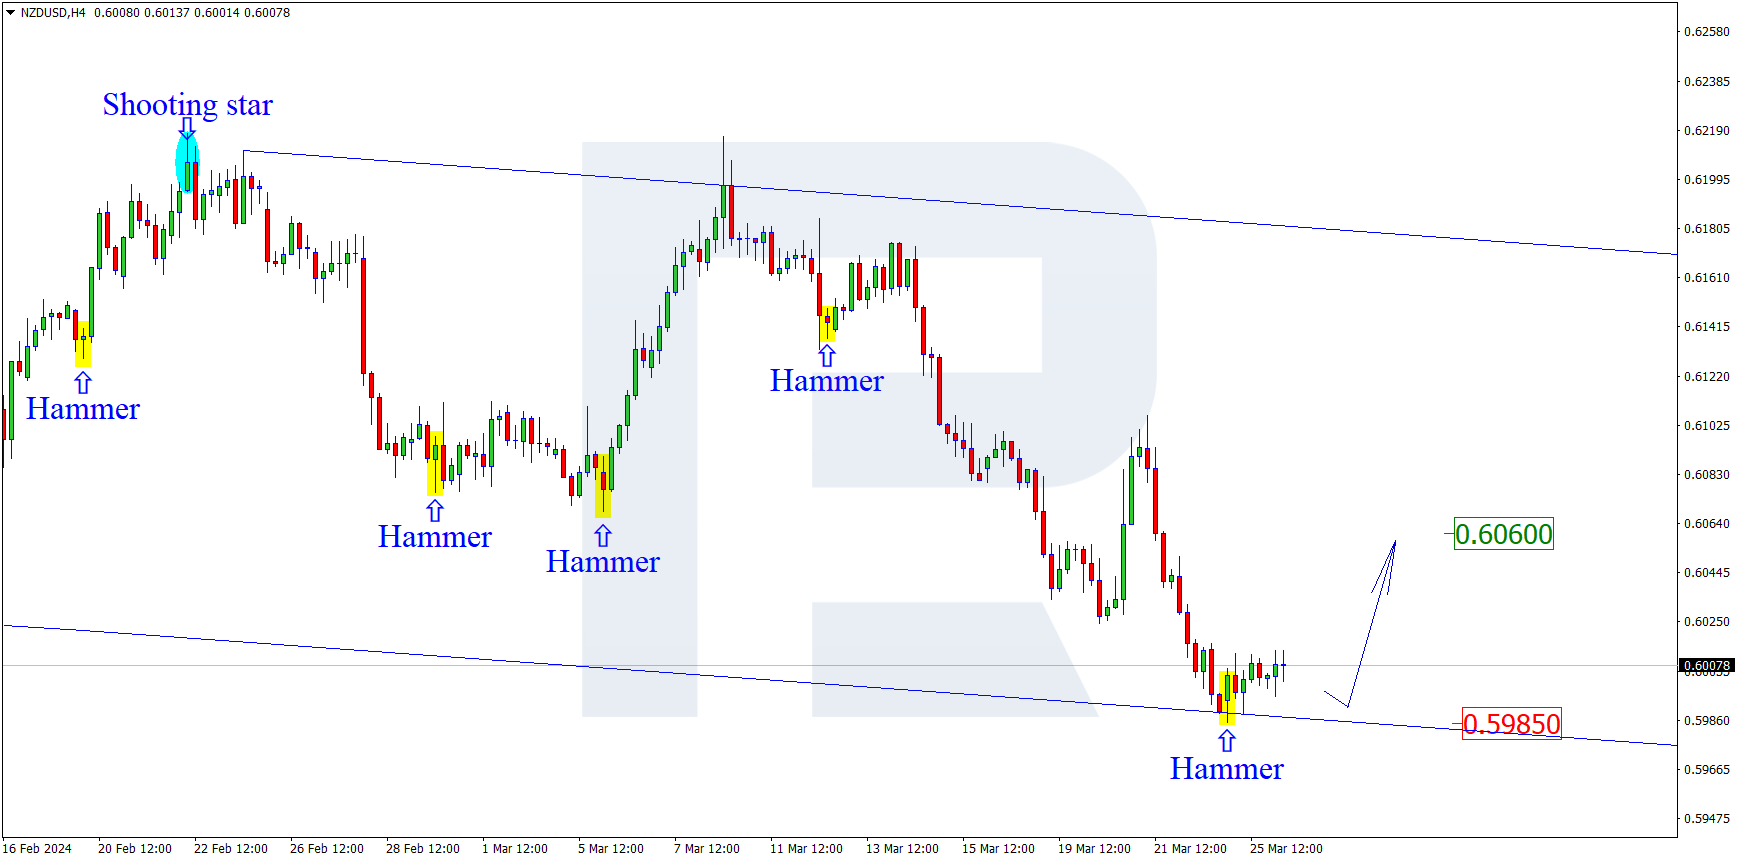
NZDUSD quotes have formed a Hammer reversal pattern on H4. Currently, the instrument is going by the reversal signal in an ascending wave. The growth target could be the 0.6060 level. After a rebound from the resistance, the quotes might continue developing the downtrend. However, the price could drop to 0.5985 without any correction.

https://roboforex.com/uploads/roboforecast/roboforex_com/99/2024/Candles/march/26/NZDUSDH4.png

GBPUSD, “Great Britain Pound vs US Dollar”
GBPUSD quotes have formed a Hammer reversal pattern on H4. Currently, the instrument is going by the reversal signal in an ascending wave. The growth target could be 1.2700. However, the price might pull back to 1.2610 and extend the uptrend after testing the support.

https://roboforex.com/uploads/roboforecast/roboforex_com/99/2024/Candles/march/26/GBPUSDH4.png

Read more - Japanese Candlesticks Analysis (XAUUSD, NZDUSD, GBPUSD)

Attention!
Forecasts presented in this section only reflect the author’s private opinion and should not be considered as guidance for trading. RoboForex bears no responsibility for trading results based on trading recommendations described in these analytical reviews.

Sincerely,
The RoboForex Team

1,092

Re: Forex Technical Analysis & Forecast by RoboForex

Murrey Math Lines 27.03.2024 (USDJPY, USDCAD)

USDJPY, “US Dollar vs Japanese Yen”
USDJPY quotes are in the overbought area on D1. The RSI is approaching the overbought area. In this situation, the price is expected to rebound from the +1/8 (151.56) level and decline to the support at 7/8 (148.43). The scenario could be cancelled by rising above the +1/8 (151.56) level. In this case, the pair might maintain its upward trajectory, reaching the resistance at +2/8 (153.12).

https://roboforex.com/uploads/roboforecast/roboforex_com/99/2024/Murrey/march/27/1.png

On M15, the price decline could be additionally supported by a breakout of the lower boundary of the VoltyChannel.

https://roboforex.com/uploads/roboforecast/roboforex_com/99/2024/Murrey/march/27/2.png

USDCAD, “US Dollar vs Canadian Dollar”
USDCAD quotes are approaching the overbought area on D1, while the RSI is approaching the resistance level. In this situation, the quotes are expected to test the 8/8 (1.3671) level, rebound from it, and drop to the support at 6/8 (1.3427). The scenario could be cancelled by surpassing the 8/8 (1.3671) level. In this case, the pair might rise to the resistance at +1/8 (1.3793).

https://roboforex.com/uploads/roboforecast/roboforex_com/99/2024/Murrey/march/27/3.png

Read more - Murrey Math Lines (USDJPY, USDCAD)

Attention!
Forecasts presented in this section only reflect the author’s private opinion and should not be considered as guidance for trading. RoboForex bears no responsibility for trading results based on trading recommendations described in these analytical reviews.

Sincerely,
The RoboForex Team

1,093 (edited by Vlad RF 2024-04-01 10:36:39)

Re: Forex Technical Analysis & Forecast by RoboForex

Murrey Math Lines 28.03.2024 (USDCHF, XAUUSD)

USDCHF, “US Dollar vs Swiss Franc”
USDCHF quotes are above the 200-day Moving Average on D1, indicating a prevailing uptrend. However, the RSI is in the overbought area. As a result, in this situation, the price is expected to break below the 6/8 (0.9033) level, falling to the support at 5/8 (0.8911). The scenario could be cancelled by rising above the resistance at 7/8 (0.9155). In this case, the pair might climb to the 8/8 (0.9277) level.

https://roboforex.com/uploads/roboforecast/roboforex_com/99/2024/Murrey/march/28/1.png

On M15, a breakout of the lower line of the VoltyChannel will increase the probability of a further price decline.

https://roboforex.com/uploads/roboforecast/roboforex_com/99/2024/Murrey/march/28/2.png

XAUUSD, “Gold vs US Dollar”
Gold quotes are above the 200-day Moving Average on D1, which indicates a prevailing uptrend. The RSI has rebounded from the support line. In this situation, the price is expected to rise to the nearest resistance at 8/8 (2250.00). The scenario could be cancelled by a breakout of the 7/8 (2187.50) level. In this case, Gold quotes might decline to the support at 6/8 (2125.00).

https://roboforex.com/uploads/roboforecast/roboforex_com/99/2024/Murrey/march/28/3.png

Read more - Murrey Math Lines (USDCHF, XAUUSD)

Attention!
Forecasts presented in this section only reflect the author’s private opinion and should not be considered as guidance for trading. RoboForex bears no responsibility for trading results based on trading recommendations described in these analytical reviews.

Sincerely,
The RoboForex Team

1,094 (edited by Vlad RF 2024-04-01 10:14:13)

Re: Forex Technical Analysis & Forecast by RoboForex

Murrey Math Lines 29.03.2024 (Brent, S&P 500)

Brent
Brent quotes are above the 200-day Moving Average on D1, which indicates the prevalence of an uptrend. The RSI has rebounded from the support line. In this situation, a rebound from 4/8 (87.50) level is expected, followed by a rise towards the resistance at 5/8 (90.62). The scenario could be cancelled by a breakout of 3/8 (84.38), followed by a trend reversal and a decline to 2/8 (81.25).

https://roboforex.com/uploads/roboforecast/roboforex_com/99/2024/Murrey/march/29/1.png

On M15, the upper boundary of the VoltyChannel is broken, which increases the probability of a price rise.

https://roboforex.com/uploads/roboforecast/roboforex_com/99/2024/Murrey/march/29/2.png

S&P 500
The S&P 500 quotes are in the overbought area on D1. The RSI is testing the resistance line. In this situation, a test of +2/8 (5312.5) is expected, followed by a rebound from this level and a price decline to the support at 8/8 (5000.00). The scenario could be cancelled by a rebound from +2/8 (5312.5), which might lead to the reshuffling of the Murrey indication, after which new price targets will be set.

https://roboforex.com/uploads/roboforecast/roboforex_com/99/2024/Murrey/march/29/3.png

Read more - Murrey Math Lines (Brent, S&P 500)

Attention!
Forecasts presented in this section only reflect the author’s private opinion and should not be considered as guidance for trading. RoboForex bears no responsibility for trading results based on trading recommendations described in these analytical reviews.

Sincerely,
The RoboForex Team

1,095

Re: Forex Technical Analysis & Forecast by RoboForex

Murrey Math Lines 02.04.2024 (AUDUSD, NZDUSD)

AUDUSD, “Australian Dollar vs US Dollar”
AUDUSD quotes are below the 200-day Moving Average on D1, revealing the prevalence of a downtrend. The RSI has broken the support line. In this situation, a breakout of 2/8 (0.6469) is expected, followed by a price decline to the support at 1/8 (0.6408). The scenario might be cancelled by rising above 3/8 (0.6530), in which case the quotes could increase to the resistance at 4/8 (0.6591).

https://roboforex.com/uploads/roboforecast/roboforex_com/99/2024/Murrey/april/02/1.png

On M15, the lower boundary of the VoltyChannel is broken, which increases the probability of a further price decrease.

https://roboforex.com/uploads/roboforecast/roboforex_com/99/2024/Murrey/april/02/2.png

NZDUSD, “New Zealand Dollar vs US Dollar”
NZDUSD quotes are below the 200-day Moving Average on D1, revealing the prevalence of a downtrend. However, the RSI has reached the oversold area. As a result, in this situation, a test of 1/8 (0.5920) is expected, followed by a rebound from this level and a price rise to the resistance at 2/8 (0.5981). This growth is interpreted as a correction of a downtrend. The scenario might be cancelled by a breakout of 1/8 (0.5920), in which case, the quotes could drop to the support at 0/8 (0.5859).

https://roboforex.com/uploads/roboforecast/roboforex_com/99/2024/Murrey/april/02/3.png

Read more - Murrey Math Lines (AUDUSD, NZDUSD)

Attention!
Forecasts presented in this section only reflect the author’s private opinion and should not be considered as guidance for trading. RoboForex bears no responsibility for trading results based on trading recommendations described in these analytical reviews.

Sincerely,
The RoboForex Team

1,096

Re: Forex Technical Analysis & Forecast by RoboForex

Ichimoku Cloud Analysis 03.04.2024 (XAUUSD, GBPUSD, USDCHF)

XAUUSD, “Gold vs US Dollar”
Gold has gained a foothold above the signal lines of the indicator. The instrument is going above the Ichimoku Cloud, which suggests an uptrend. A test of the Kijun-Sen line at 2265 is expected, followed by a rise to 2325. An additional signal confirming the rise could be a rebound from the lower boundary of the bullish channel. The scenario could be cancelled by a breakout of the lower boundary of the Cloud, with the price securing below 2215, which will signal a further decline to 2175.

https://roboforex.com/uploads/roboforecast/roboforex_com/99/2024/Ichimoku/april/03/gold.png

GBPUSD, “Great Britain Pound vs US Dollar”
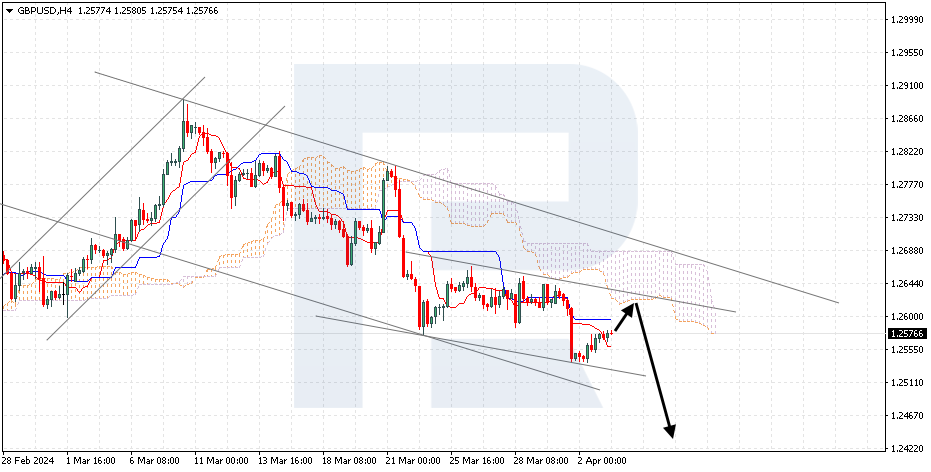
GBPUSD is correcting following a rebound from the lower boundary of a bearish channel. The pair is going below the Ichimoku Cloud, which suggests a downtrend. A test of the lower boundary of the Cloud at 1.2605 is expected, followed by a decline to 1.2455. An additional signal confirming the decline could be a rebound from the upper boundary of the descending channel. The scenario can be cancelled by a breakout of the Cloud’s upper boundary, with the price securing above 1.2705, indicating further growth to 1.2805.
https://roboforex.com/uploads/roboforecast/roboforex_com/99/2024/Ichimoku/april/03/gbpusd.png

USDCHF, “US Dollar vs Swiss Franc”
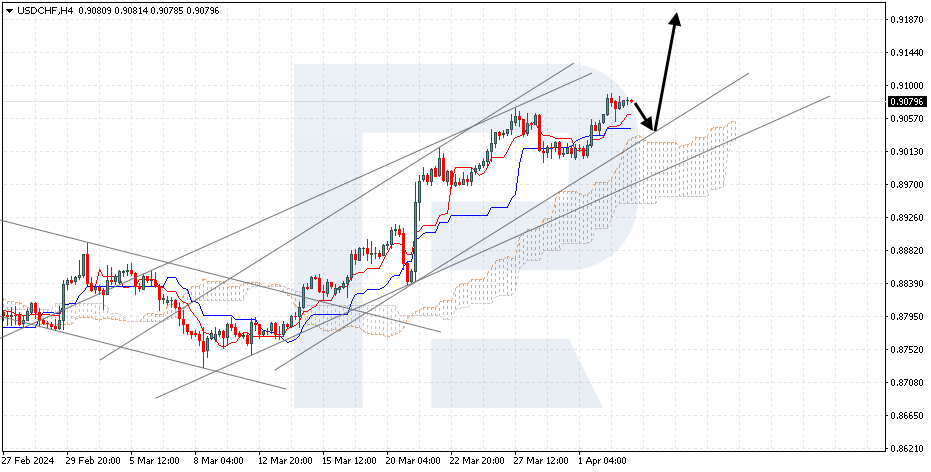
USDCHF has established itself above the resistance level. The pair is going above the Ichimoku Cloud, which suggests an uptrend. A test of the Kijun-Sen line at 0.9025 is expected, followed by a rise to 0.9205. An additional signal confirming the rise could be a rebound from the lower boundary of the bullish channel. The scenario could be cancelled by a breakout of the lower boundary of the Ichimoku Cloud, with the price securing below 0.8920, which will signal a further decline to 0.8825.
https://roboforex.com/uploads/roboforecast/roboforex_com/99/2024/Ichimoku/april/03/usdchf.png

Read more - Ichimoku Cloud Analysis (XAUUSD, GBPUSD, USDCHF)

Attention!
Forecasts presented in this section only reflect the author’s private opinion and should not be considered as guidance for trading. RoboForex bears no responsibility for trading results based on trading recommendations described in these analytical reviews.

Sincerely,
The RoboForex Team

1,097

Re: Forex Technical Analysis & Forecast by RoboForex

Murrey Math Lines 04.04.2024 (USDCHF, XAUUSD)

USDCHF, “US Dollar vs Swiss Franc”
USDCHF quotes are above the 200-day Moving Average on D1, revealing the prevalence of an uptrend. The RSI has broken the support line, escaping the overbought area. As a result, in this situation, a rebound from 6/8 (0.9033) is expected, followed by a price decline to the support at 5/8 (0.8911). The scenario could be cancelled by rising above the resistance at 6/8 (0.9033), in which case the pair might increase to the 7/8 (0.9155) level.

https://roboforex.com/uploads/roboforecast/roboforex_com/99/2024/Murrey/april/04/1.png

On M15, the lower boundary of the VoltyChannel is broken, which increases the price decline probability.

https://roboforex.com/uploads/roboforecast/roboforex_com/99/2024/Murrey/april/04/2.png

XAUUSD, “Gold vs US Dollar”
Gold quotes and the RSI are in their respective overbought areas in D1. In this situation, a rebound from the +1/8 (2312.50) level is expected, followed by a price decline to the support at 8/8 (2250.00). The scenario could be cancelled by a rise above +1/8 (2312.50), in which case gold quotes could reach the resistance at +2/8 (2390.80).

https://roboforex.com/uploads/roboforecast/roboforex_com/99/2024/Murrey/april/04/3.png

Read more - Murrey Math Lines (USDCHF, XAUUSD)

Attention!
Forecasts presented in this section only reflect the author’s private opinion and should not be considered as guidance for trading. RoboForex bears no responsibility for trading results based on trading recommendations described in these analytical reviews.

Sincerely,
The RoboForex Team

1,098

Re: Forex Technical Analysis & Forecast by RoboForex

Murrey Math Lines 05.04.2024 (Brent, S&P 500)

Brent
Brent quotes are above the 200-day Moving Average on D1, indicating a prevailing uptrend. However, the RSI is in the overbought area. As a result, in this situation, the price is expected to rebound from the 5/8 (90.62) level and drop to the support at 4/8 (87.50). The scenario could be cancelled by breaking above the 5/8 (90.62) level. In this case, Brent quotes could maintain their upward trajectory, potentially reaching the resistance at 6/8 (93.75).

https://roboforex.com/uploads/roboforecast/roboforex_com/99/2024/Murrey/april/05/1.png

On M15, the price decline could be additionally confirmed by a breakout of the lower boundary of the VoltyChannel.

https://roboforex.com/uploads/roboforecast/roboforex_com/99/2024/Murrey/april/05/2.png

S&P 500
S&P 500 quotes remain in the overbought area on D1. The RSI has broken the support line. In this situation, the price is expected to break below the +1/8 (5156.2) level and fall to the support at 8/8 (5000.00). The scenario could be cancelled by rising above +2/8 (5312.5), which might reshuffle the Murrey indication, setting new price movement targets.

https://roboforex.com/uploads/roboforecast/roboforex_com/99/2024/Murrey/april/05/3.png

Read more - Murrey Math Lines (Brent, S&P 500)

Attention!
Forecasts presented in this section only reflect the author’s private opinion and should not be considered as guidance for trading. RoboForex bears no responsibility for trading results based on trading recommendations described in these analytical reviews.

Sincerely,
The RoboForex Team

1,099 (edited by Vlad RF 2024-11-12 10:40:13)

Re: Forex Technical Analysis & Forecast by RoboForex

USDJPY rises for the second day: market preference for the US dollar takes priority

The USDJPY pair is increasing, with renewed interest in the US dollar gaining traction. Find out more in our analysis for 12 November 2024.

USDJPY technical analysis

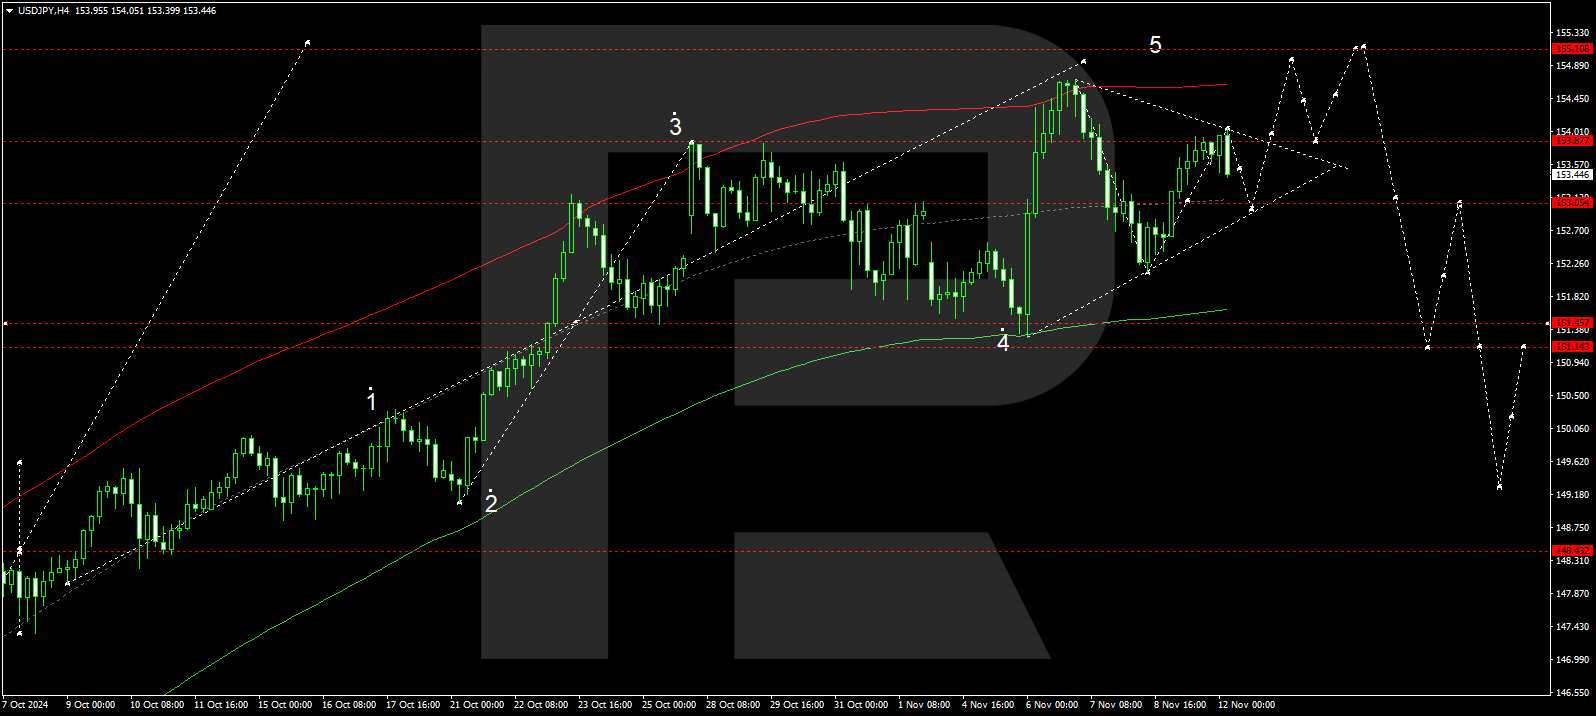
The USDJPY H4 chart shows that the market has completed a wave, reaching 154.05. A decline to 153.05 (testing from above) is expected today, 12 November 2024. After reaching this level, the price could rise to 155.00 and potentially continue the wave to the local target of 155.15.

https://roboforex.com/uploads/roboforecast/roboforex_com/99/2024/November/12/usdjpy-2024-11-12.png

The USDJPY pair remains positive, buoyed by market sentiment favouring the US dollar.

Read more - USDJPY Forecast

Attention!
Forecasts presented in this section only reflect the author’s private opinion and should not be considered as guidance for trading. RoboForex bears no responsibility for trading results based on trading recommendations described in these analytical reviews.

Sincerely,
The RoboForex Team

Posts: 1,076 to 1,099 of 1,099

Pages Previous 1 42 43 44

You must login or register to post a reply

Forex Software → Market Analysis → Forex Technical Analysis & Forecast by RoboForex

Similar topics in this forum