BTCUSD and XRPUSD Technical Analysis – 10th MAY 2022

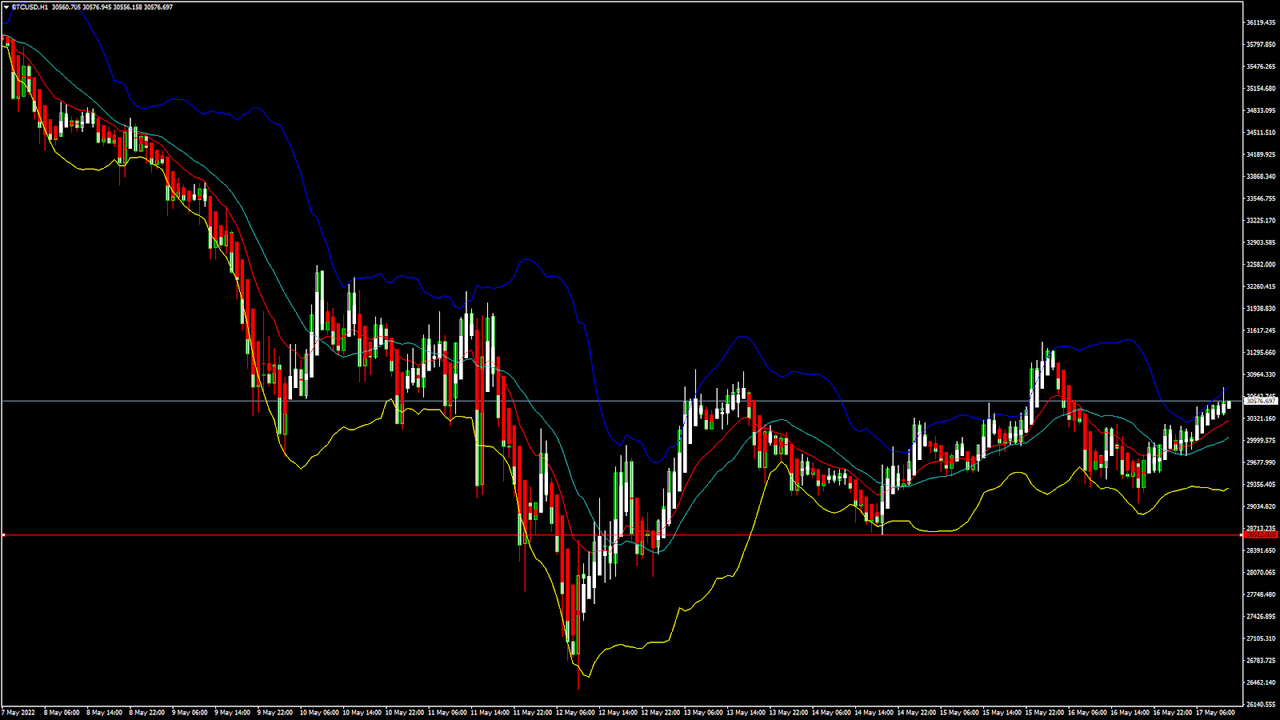
BTCUSD: Rounding Bottom Pattern Above $29,700
Bitcoin was not able to sustain its bullish momentum last week, and after touching a high of $40,000 on May 4th, started to decline heavily against the US dollar.
The short-selling continued pushing the price of BTC below the $30,000 handle, after which we can observe some consolidation.
We can see a pullback in the market at levels above $30,000, which is expected to continue towards $35,000.
We can clearly see a rounding bottom pattern above the $29,700 handle — which is a bullish reversal pattern signifying the end of a downtrend and a shift towards an uptrend.
The Stoch and Williams percent range are indicating an overbought level which means that in the immediate short term, a decline in the prices is expected.
The relative strength index is at 44 indicating a WEAK demand for bitcoin at the current market level.
Bitcoin is now moving below its 100 hourly simple and 200 hourly exponential MAs.
Some of the major technical indicators are giving a BUYsSignal, which means that in the immediate short term, we are expecting targets of $32,000 and $34,000.
The average true range is indicating LESSER market volatility with a mildly bullish momentum.
Bitcoin: bullish reversal seen above $29,700
The StochRSI is indicating an OVERBOUGHT level
The price is now trading just below its pivot level of $31,810
Some of the moving averages are giving a BUY market signal
Bitcoin: Bullish Reversal Seen Above $29,700

Bitcoin has moved out of the falling trend seen last week and now continues to consolidate its gains above the $30,000 handle in the European trading session. The bounce that we have seen above $30,000 is expected to continue this week, and we are now looking at targets of $32,000 and $35,000 in the medium-term range.
The immediate short-term outlook for bitcoin is mildly bullish; the medium-term outlook has turned neutral; the long-term outlook remains neutral under present market conditions.
We are now looking at possible reversal and short selling at 32,946 and 34,350 as indicated by the MA50 and MA100 crossover patterns. This is further validated by an overbought level seen in the Stoch and Williams percent range.
The price of BTCUSD is now facing its classic resistance level of $32,009, Fibonacci resistance level of $32,240 after which the path towards $34,000 will get cleared.
In the last 24hrs, BTCUSD has declined by -5.59% with a price change of 1872$, and has a 24hr trading volume of USD 81.634 billion. We can see an increase of 111% in the trading volume as compared to yesterday, which is due to the heavy selling seen across global cryptocurrency markets.
The Week Ahead
The price of bitcoin touched an intraday low of $29,829 in the Asian trading session, and an intraday high of $32561 in today’s European trading session.
The daily RSI is printing at 30 which means that the medium range demand continues to be weak. This is also an opportunity for long-term investors to enter into the markets at lower levels.
The current market condition is suitable for entering into a BUY position with targets of $33,000 and $35,000 next week.
The price of BTCUSD will need to remain above the important support level of $30,000 this week.
The weekly outlook is projected at $33,000 with a consolidation zone of $32,500.
Bitcoin Down by 50%
The price of bitcoin touched an all-time high of $67,566 in November, 2021, and with the current market price of $31,570 marks a drop of 50% in its value.
The ongoing global economic crisis, rise in the interest rates, the Russia-Ukraine war and its effects on the global investor sentiments are driving bitcoin to historic lows, which has led to a decline in the total market capitalization of bitcoin to $600 billion USD.
Technical Indicators
The StochRSI (14-day): at 74.78 indicating a BUY
The average directional change(14-day): at 28.58 indicating a NEUTRAL level
The rate of price change: at 1.349 indicating a BUY
The moving averages 20: indicating a BUY
Read Full on FXOpen Company Blog...

