Re: Technical Analysis by FXOpen
Gold Price and Oil Price Eye Additional Gains

Gold price is showing positive signs above the $1,880 resistance zone. Crude oil price is holding a major support, but it is facing resistance near $70.00.
Important Takeaways for Gold and Oil
Gold price gained pace above the $1,875 and $1,880 resistance levels against the US Dollar.
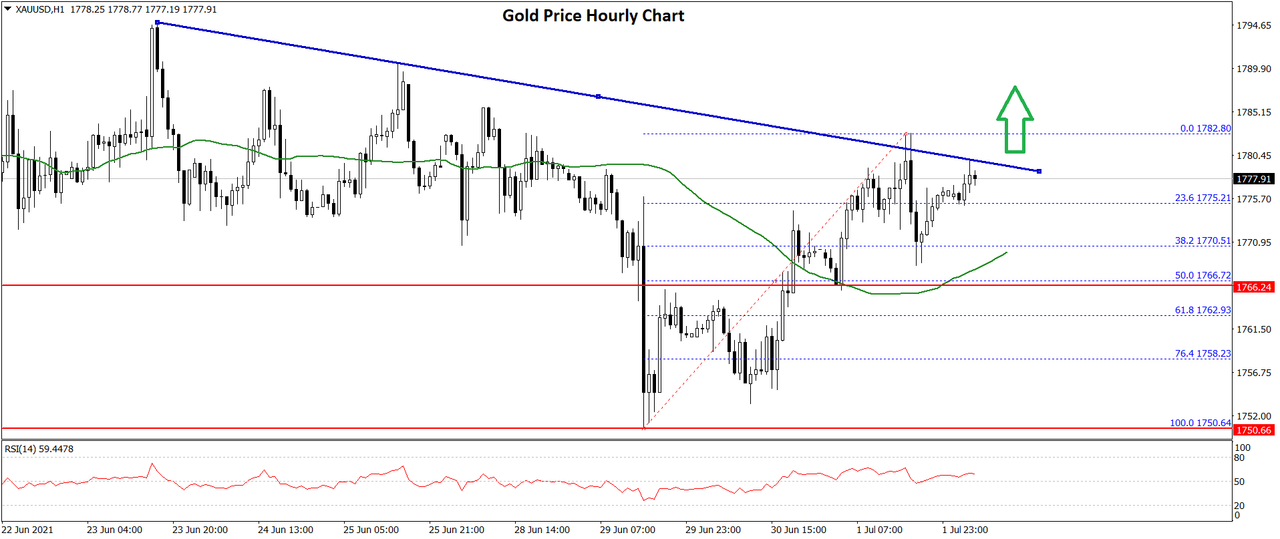
There was a break above a key bearish trend line with resistance near $1,894 on the hourly chart of gold.
Crude oil price climbed higher and it even cleared the $70.00 resistance zone.
There is a crucial bullish trend line forming with support near $69.00 on the hourly chart of XTI/USD.
Gold Price Technical Analysis
This week, gold price remained in a positive zone above the $1,865 level against the US Dollar. The bulls were able to push the price above the $1,880 resistance zone.
The price even settled above the $1,885 level and the 50 hourly simple moving average. There was a break above a key bearish trend line with resistance near $1,894 on the hourly chart of gold.

A high is formed near $1,900 on FXOpen and the price is now consolidating gains. An initial support on the downside is near the $1,893 level. It is close to the 23.6% Fib retracement level of the recent increase from the $1,870 swing low to $1,900 high.
The first major support is near the $1,890 level and the 50 hourly simple moving average. The next key support is near the $1,885 level.
The 50% Fib retracement level of the recent increase from the $1,870 swing low to $1,900 high is also near the $1,885 level. Any more losses could open the doors for a move towards the $1,870 low.
An initial resistance is near the $1,905 level. The first major resistance is near the $1,910 level. A clear break above the $1,910 level may possibly open the doors for a move towards the $1,925 level. The next major resistance sits near $1,935.
