Re: NPBFX - making money with us since 1996!

GBP/USD: GBP tries to resume growth 05.10.2020

Good afternoon, dear forum visitors!

NPBFX offers the latest release of analytics on GBP/USD for a better understanding of the current market situation and more efficient trading.

Current trend

GBP is showing flat dynamics of trading today, maintaining a weak "bullish" advantage, preserved from last week. GBP buying activity is noticeably weakening amid new statements by Boris Johnson, who reiterated that the UK will be able to do without a trade agreement with the EU after the Brexit transition period ends at the end of the year. However, the Prime Minister stressed that he would like a different outcome of the situation, but so far the parties are faced with insurmountable contradictions.

The US macroeconomic statistics released on Friday had an ambiguous impact on the market dynamics. In September, Non-Farm Payrolls showed growth only by 661K new jobs, while last month was marked by an increase of 1.489M. Experts expected the growth by 850K. At the same time, the Unemployment Rate in the USA in September has steadily decreased from 8.4% to 7.9% against the forecast of 8.2%.

Support and resistance

In the D1 chart, Bollinger Bands are reversing horizontally. The price range is almost constant, remaining rather spacious for the current level of activity in the market. MACD indicator is growing preserving a weak buy signal (located above the signal line). Stochastic, having approached the level of "80", reversed into a downward plane, signaling the risks of a corrective decline in the ultra-short term.

To open new trading positions, it is necessary to wait for the signals from technical indicators to be clarified.

Resistance levels: 1.3000, 1.3100, 1.3200, 1.3300.
Support levels: 1.2900, 1.2850, 1.2800, 1.2761.

http://businesspr-finance.com/wp-content/uploads/2020/10/gbpusd05102020-55.png

http://businesspr-finance.com/wp-content/uploads/2020/10/gbpusd05102020-66.png

Trading tips

To open new short positions, one can rely on the breakdown of 1.2900. Take-profit – 1.2800–1.2761. Stop-loss – 1.2970. Implementation time: 2-3 days.

The breakout of 1.3000 may serve as a signal to new purchases with the target at 1.3100. Stop-loss – 1.2940.

Use more opportunities of the NPBFX analytical portal: glossary

Beginning traders certainly face a lot of specialized concepts and lexicon on FOREX, which are often not fully been understood. Swap, tick, hedge, margin calls are often unfamiliar to beginning traders. But the lack of knowledge of these fundamentals make a competent market vision impossible. So glossary on the NPBFX analytical portal could be an excellent helper in this case, which contains all the main definitions with explanations in a compact and accessible form. All concepts are arranged in alphabetical order, so that you can easily and quickly find and explore a new concept for yourself.

If you have any questions about trading instruments, you can always ask an analyst in the online chat on the portal and get a free consultation of an experienced specialist.

Use the current recommendations of analysts on GBP/USD and trade efficiently with NPBFX.

Re: NPBFX - making money with us since 1996!

August NPBFX contest completed: interesting facts and overview of the results of the Battle of Traders

Hello, dear forum users!

During the last summer month the Battle of Traders continued to stay in a bullish trend! Trading on demo accounts without the risk of losing real money and with the opportunity to win a real deposit attract both experienced traders and those who have lately started trading Forex. For instance, in August, 2,360 traders joined the Battle to win main prizes. Who managed to achieve impressive results? Who closed biggest amount of trades? You can learn answers to all these questions in the review of the results of the August’s Battle of Traders!

Open monitoring of the Battle’s participants shows that traders used all the instruments available in NPBFX: currencies, precious metals, world indices, energy CFDs.

However, some contestants preferred to trade exclusively with one currency pair. For example, a trader with the nickname grekul64 (# 196440). He opened 90 trades in EURUSD and took 19th place. The absolute record holder of the month for the number of open trades Acuder (# 197605) traded exclusively with this pair – there were 11169 transactions made on the account. There are other interesting tactics as well. For example, trader Yurec (# 198269) opened only one transaction, but it provided him with more than $ 8000 profit and 51st place out of 2360. We can also suppose that with more trading activity we could see trader Yurec among the month’s winners.

It should be noted that the trading portfolios of the TOP-3 traders in August included indices. Although a trader under the nickname snaker (# 198779) made just one transaction with the S&P500 index – this trade resulted in $ 18,500 of profit!

The first place in the Battle was taken by a participant with the nickname IVAN108 (№199499). The winner of the contest was able to effectively combine indices, currencies and metals in his trading portfolio. It took him 144 transactions to get ahead of the competition. The trader increased his initial deposit by more than 50 times. According to the rules of the Battle, NPBFX awards the winner with the iPhone 11 Pro! We propose to give the results of the participants of the Battle a closer look, because the prize fund of $ 2500 was distributed among them.

http://businesspr-finance.com/wp-content/uploads/2020/10/itogi-aug-2020-eng.jpg

NPBFX Broker congratulates the winners and expresses gratitude to all participants of the August’s Battle!
To participate in the monthly Battle of Traders, you need to register your Personal Account on the official NPBFX website and open a contest demo account. Join and earn your trading capital for Risk Free Live Trading!

Register for the Battle of Traders right now

Re: NPBFX - making money with us since 1996!

$1000 and the newest iPhone 11 Pro sent to Kostroma! Introducing an interview with the winner of the August’s Battle of Traders

The summer contest season ended with an impressive trading result of the winner! It was the trader Ivan Vasilevich Kruglov from Kostroma, a Russian city with a rich centuries-old history. The career of the winner of the August’s Battle of Traders is also eventful and started long before the Battle. Ivan Vasilyevich began to take Forex trading as a serious intellectual job 4 years ago. Research and testing of various strategies turned out to be so successful and it allowed the trader to receive the super prize of the contest from NPBFX – iPhone 11 Pro! Did the winner set such a goal for himself? What criteria does he use when choosing trading instruments? What part does Forex play in a trader’s life today? The winner gave answers to these and other questions in an interview for NPBFX. We present to your attention a script of the conversation with Ivan Vasilievich.

http://businesspr-finance.com/wp-content/uploads/2020/10/interview-aug-2020-eng.png

- Ivan Vasilievich, could you tell us how did you know about the contest and why have you decided to take part in it?

- I knew about NPBFX before the Battle. Somehow I visited your webpage and decided just to try to take part in the Battle.

- How long did it take you to register in the Battle of Traders? What can you say about the conditions of the contest at NPBFX?

- Registration can be made very quickly. All the terms of the contest suited me.

- What were your first words and emotions when you learned about your victory in the Battle of Traders? Did you share this news with someone?

- Yes, I did not even think about taking the first place, I thought that I would be in the top ten. When I saw myself as a winner, I was surprised. I was overwhelmed with joy! I shared the news with relatives and friends.

- As far as I know, you participated in the contest for the first time and not only won the competition, but also a super prize from NPBFX – iPhone 11 Pro. Have you set yourself such a goal – to win an iPhone?

- No, I didn't set a goal to win an iPhone. I was just watching how it would turn out.

- Your result is really impressive: you were able to increase your initial deposit of $ 5000 by 52 times – up to $ 262 525! Please tell us more about your trading strategy.

- My strategy was that I traded on false breakouts. I can say I was mastering my strategy. I worked on the desktop version as well the mobile version of MT4 when I was at work.

- During the Battle you closed 144 transactions. As can be seen from the statement, in addition to currency pairs, S&P500, NASDAQ indices and gold were included into your portfolio. What were the reasons for choosing such trading instruments?

- I chose trading instruments based on the principle of strong entry points. In addition, I took into account volatility and capitalization. I managed the account manually, did not use indicators.

- Do you plan to trade other trading instruments that are available in NPBFX: cryptocurrencies, CFDs, energies?

- I will definitely not work with cryptocurrency, I will try others.

- You had positions with a volume of 50-75 trading lots and trades of 0.5 lots. Are you more focused on technical or fundamental analysis in market prognosis?

- I rely more on technical analysis.

- How often did you refer to the monitoring of contest accounts? Was it helpful to you in any way?

- Yes, I was monitoring my score, it was interesting. I participated for the first time, so I checked my place  often. There was one more participant in the Battle who was my competitor, but he could not resist more, and my account won at the end.

- $1000 has already been credited to your real trading account with NPBFX. Are you going to follow the same trading strategy on it as on a demo account in the Battle?

- No. I will stick to more conservative trading on a real account.

- Ivan Vasilievich, tell us a little about your career: how long have you been trading Forex? Why did you decide to start trading?

- I got acquainted with the Forex market 10 years ago. But I have been doing it seriously for about 4 years. I started buying some courses, using different strategies. That’s how I slowly found what works for me. Here you don't need to work physically, to put it simply. Forex is an intellectual work. You can do  physical work, you can work with your brains – just need to choose what is the best option for you.

- In your opinion, what qualities should a person possess to become a successful trader?

- First, you definitely need to have endurance, patience, not to hurry up. The second is to analyze more. Self-discipline is everything, no haste.

- What part does Forex play in your life today?

- Forex takes an important place in my life. This is an additional source of income.

- What is your main job, what is your profession?

- I work in the furniture industry, I am engaged in the assembly and installation of office furniture.

- Please tell me, what country are you from, what is the name of the city of your residence? How old are you, are you a family man, what are your hobbies?

- I live in Russia, the city of Kostroma. I am a family man, I have a wife and a child. What’s my hobby? Trading – that’s exactly what I am fond of!

- Ivan Vasilievich, would you advise your friends and acquaintances to join the Battle of Traders?

- I have already advised, but no one has experience.

- What would you like to wish NPBFX and the participants of the next Battle of Traders?

- I wish the company good luck, development, an opportunity to carry out more competitions - they are good and worthy. To the participants, of course, success and profit!

- Ivan Vasilievich, thank you for participating in the Battle and answering the interview questions. Let the NPBFX live account trade be as successful as your contest account!

554 (edited by Antony_NPBFX 2020-10-12 10:54:31)

Re: NPBFX - making money with us since 1996!

GBP/USD: GBP is strengthening 12.10.2020

Good afternoon, dear forum visitors!

NPBFX offers the latest release of analytics on GBP/USD for a better understanding of the current market situation and more efficient trading.

Current trend

GBP is trading ambiguously against USD during today's morning session, testing 1.3000 for a breakout. The pair ended last week's trading with moderate gains, culminating on Friday, when GBP strengthened significantly amid a decline in USD.

Investors also ignored the weak macroeconomic statistics from the UK, which appeared at the end of last week. UK GDP in August showed growth by 2.1% MoM, slowing down from the previous value of +6.6% MoM. Analysts had expected growth of 4.6% MoM. Industrial Production for the same period decreased from +5.2% MoM to +0.3% MoM, which also turned out to be significantly worse than market forecasts of +2.5% MoM. On an annualized basis, production rates fell by 6.4% YoY, with an expected decline of 4.6% YoY. Today, investors' attention is focused on the speech of the Bank of England Governor Andrew Bailey, who may again speak out in favor of additional stimuli for the British economy.

Support and resistance

On the D1 chart Bollinger Bands are reversing into the ascending plane. The price range is changing slightly but does not conform to the development of the "bullish" trend in the ultra-short term yet. MACD indicator is growing preserving a stable buy signal (located above the signal line). The indicator is also trying to consolidate above the zero level. Stochastic keeps its upward direction but is approaching its highs, which reflects the risks of overbought instrument in the ultra-short term.

Resistance levels: 1.3100, 1.3200, 1.3300.
Support levels: 1.3000, 1.2925, 1.2850, 1.2800.

http://businesspr-finance.com/wp-content/uploads/2020/10/gbpusd12102020-55.png

http://businesspr-finance.com/wp-content/uploads/2020/10/gbpusd12102020-66.png

Trading tips

To open long positions, one can rely on the breakout of 1.3100. Take-profit – 1.3200. Stop-loss – 1.3040. Implementation time: 1-2 days.

The return of "bearish" trend with the breakdown of 1.3000 may become a signal for further sales with the target at 1.2850. Stop-loss – 1.3075.

Use more opportunities of the NPBFX analytical portal: economic indicators

Regular monitoring of global economic indicators plays an important role in trading, because of their strong influence on FOREX market and possibility to provoke significant price fluctuations. For the convenience of traders the "Education" section on the NPBFX portal contains the most popular and significant world economic indices with a detailed description, their possible impact on the economy and exchange rates (GDP, consumer price index, unemployment rate, Nonfarm Payrolls (NFP), etc.).

If you have any questions about trading instruments, you can always ask an analyst in the online chat on the portal and get a free consultation of an experienced specialist.

Use the current recommendations of analysts on GBP/USD and trade efficiently with NPBFX.

Re: NPBFX - making money with us since 1996!

XAU/USD: gold prices are going down 14.10.2020

Good afternoon, dear forum visitors!

NPBFX offers the latest release of analytics on XAU/USD for a better understanding of the current market situation and more efficient trading.

Current trend

Gold prices are relatively stable during today's Asian trading session and are consolidating at 1900.00. The day before, the instrument showed a confident decline, which was caused by the growth of USD in response to the general deterioration in market sentiment.

Investors are still discussing the topic of stimulus measures for the US economy, but more and more analysts are in favor of the fact that the new package of measures will be adopted after the US presidential elections on November 3. Additional support for gold is also provided by the fact that Joe Biden is leading in the presidential race, since if he wins the election, the presidential administration may increase spending at first. Finally, the difficult situation with the coronavirus in the world contributes to the growth in demand for safe assets. WHO records the strongest increase in daily incidence since spring, while no state has completed clinical trials of the vaccine yet. Johnson & Johnson is suspending trials of its vaccine because one of the volunteers had adverse reactions.

Support and resistance

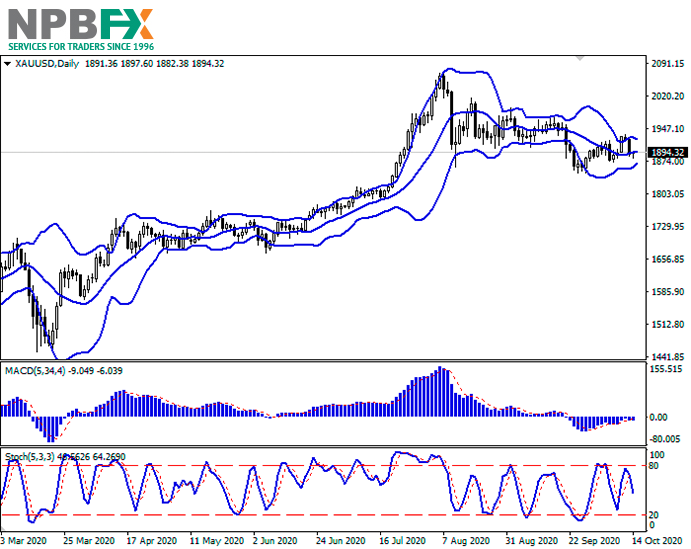
In the D1 chart, Bollinger Bands are reversing horizontally. The price range is narrowing, reflecting the multidirectional dynamics appearance in the short term. MACD reversed downwards having formed a new weak sell signal (located below the signal line). Stochastic is showing slightly more stable decline and is located in the middle of its area.

Resistance levels: 1900.00, 1920.82, 1935.00, 1955.00.
Support levels: 1885.00, 1872.80, 1850.00.

http://businesspr-finance.com/wp-content/uploads/2020/10/xauusd14102020-55.png

http://businesspr-finance.com/wp-content/uploads/2020/10/xauusd14102020-66.png

Trading tips

To open long positions, one can rely on the breakout of 1900.00. Take-profit – 1920.82–1935.00. Stop-loss – 1885.00. Implementation time: 2-3 days.

The development of "bearish" trend with the breakdown of 1885.00 may become a signal for further sales with target at 1850.00. Stop-loss – 1900.00.

Use more opportunities of the NPBFX analytical portal: trading signals for commodities

How can a trader determine if it’s worth buying or selling XAU/USD now or better waiting for a more favorable period? Use trading signals for commodities from the top 10 technical indicators on the NPBFX portal and make the right decisions! All registered users have free and unlimited access to the minutely updated trading signals (MA10, BBands, Ichimoku, Stochastic, ZigZag, etc.) for Gold, Silver, Brent and WTI Crude oil.

If you have any questions about trading instruments, you can always ask an analyst in the online chat on the portal and get a free consultation of an experienced specialist.

Use the current recommendations of analysts on XAU/USD and trade efficiently with NPBFX.

Re: NPBFX - making money with us since 1996!

AUD/USD: pair updates lows 16.10.2020

Good afternoon, dear forum visitors!

NPBFX offers the latest release of analytics on AUD/USD for a better understanding of the current market situation and more efficient trading.

Current trend

AUD is declining against USD during today's Asian session, testing 0.7070. The instrument is losing about 0.26%, developing a strong "bearish" momentum that had formed the day before. The instrument is under pressure from the growing demand for safe assets, as investors are concerned about the possibility of a return to quarantine restrictions in Europe. In addition, traders take a lead from not the most confident macroeconomic statistics from Australia and China, which appeared on Thursday. Australian employment declined in September by 29.5K, while the Unemployment Rate rose from 6.8% to 6.9%. Consumer Price Index in China slowed growth from +0.4% MoM to +0.2% MoM.

Investors are analyzing the speech of the RBA Governor Philip Lowe, who complained about the high yield on 10-year bonds of Australia. According to analysts, this could be a hint of the launch of a new quantitative easing program worth about AUD 100B in November.

Support and resistance

Bollinger Bands in D1 chart demonstrate flat dynamics. The price range is slightly expanding from below but does not conform to the development of the "bearish" trend yet. MACD is going down preserving a moderate sell signal (located below the signal line). Stochastic maintains its downtrend, but is approaching the level of "20", indicating the risks of the pair being oversold in the ultra-short term.

Current showings of the indicators do not contradict the further development of the downtrend in the short term.

Resistance levels: 0.7100, 0.7129, 0.7150, 0.7200.
Support levels: 0.7055, 0.7030, 0.7000.

http://businesspr-finance.com/wp-content/uploads/2020/10/audusd16102020-55.png

http://businesspr-finance.com/wp-content/uploads/2020/10/audusd16102020-66.png

Trading tips

The breakdown of 0.7055 may serve as a signal to new sales with the target at 0.7000. Stop-loss – 0.7085. Implementation time: 1-2 days.

To open long positions, one can rely on the rebound from 0.7055, with the subsequent breakout of 0.7100. Take-profit – 0.7150. Stop-loss – 0.7070.

Use more opportunities of the NPBFX analytical portal: weekly FOREX forecast

You can learn more about the current situation on AUD/USD and get acquainted with the weekly analytical forecast in the "Video reviews" section on the NPBFX portal. Weekly video reviews contain trends, key levels, trading recommendations for such popular instruments as EUR/USD, GBP/USD, USD/JPY, AUD/USD. In order to get free and unlimited access to video forecast and other useful instruments on the portal, you need to register on the NPBFX website.

If you have any questions about trading instruments, you can always ask an analyst in the online chat on the portal and get a free consultation of an experienced specialist.

Use the current recommendations of analysts on AUD/USD and trade efficiently with  NPBFX.

557 (edited by Antony_NPBFX 2020-10-19 08:45:25)

Re: NPBFX - making money with us since 1996!

GBP/USD: GBP wins back losses 19.10.2020

Good afternoon, dear forum visitors!

NPBFX offers the latest release of analytics on GBP/USD for a better understanding of the current market situation and more efficient trading.

Current trend

GBP increases against USD today, preparing to test 1.2950 for a breakout. The positions of GBP are strengthening against a contradictory news background, which does not indicate the formation of any confident trend. Market participants remain very worried about the uncertain prospects for a trade deal between the UK and the EU, but traders seem to be trying to prepare for any outcome of the situation. Despite a number of optimistic statements from British representatives regarding the deal, official London is in no hurry to make noticeable concessions, hoping for such from Brussels. Uncertainty is also added by the situation with the new wave of coronavirus, which is shaping new drivers for the market.

Some support to GBP is provided by the Rightmove House Price Index published today. In October, the indicator increased by 1.1% MoM and 5.5% YoY, which turned out to be slightly better than the data of the previous month (+0.2% MoM and +5% YoY).

Support and resistance

In the D1 chart, Bollinger Bands are reversing horizontally. The price range is narrowing, reflecting the emergence of ambiguous dynamics of trading in the short term. MACD is going down preserving a previous sell signal (located below the signal line). Stochastic demonstrates a similar dynamics, quickly approaching its lows and the border at the level of "20".

To open new trading positions, it is necessary to wait for the signals from technical indicators to be clarified.

Resistance levels: 1.2960, 1.3000, 1.3081.
Support levels: 1.2900, 1.2850, 1.2800, 1.2761.

http://businesspr-finance.com/wp-content/uploads/2020/10/gbpusd19102020-55.png

http://businesspr-finance.com/wp-content/uploads/2020/10/gbpusd19102020-66.png

Trading tips

To open long positions, one can rely on the breakout of 1.2960. Take-profit – 1.3081. Stop-loss – 1.2900. Implementation time: 2-3 days.

The breakdown of 1.2900 may serve as a signal to new sales with the target at 1.2800. Stop-loss – 1.2960.

Use more opportunities of the NPBFX analytical portal: economic calendar

Be ready for any market changes through global events using the economic calendar on the NPBFX portal. The calendar contains all the most important events of the world economy and prognoses for them. In order to get free and unlimited access to the economic calendar and other useful instruments on the portal, you need to pass a one-time registration on the NPBFX website.

If you have any questions about trading instruments, you can always ask an analyst in the online chat on the portal and get a free consultation of an experienced specialist.

Use the current recommendations of analysts on GBP/USD and trade efficiently with NPBFX.

Re: NPBFX - making money with us since 1996!

XAU/USD: gold is strengthening 21.10.2020

Good afternoon, dear forum visitors!

NPBFX offers the latest release of analytics on XAU/USD for a better understanding of the current market situation and more efficient trading.

Current trend

Gold prices are rising during today's Asian session, taking advantage of the weakness of USD and updating local highs since October 13. The instrument is still supported by a high level of uncertainty in the market, which is associated with many factors. One of them is a new program of financial assistance for the American economy, around which real political battles unfolded. Investors are also noticeably concerned about the leadership of Democrat Joe Biden in the election race, which, if elected president, could dramatically increase budget spending, including supporting the economy amid the ongoing pandemic. The final debate of the presidential candidates will take place this Thursday, October 22.

Support and resistance

In the D1 chart, Bollinger Bands are reversing horizontally. The price range is slightly narrowing from below, reflecting the ambiguous dynamics of trading in the short term. MACD indicator is growing preserving a weak buy signal (located above the signal line). The indicator is about to test the zero level for a breakout. Stochastic is showing similar dynamics, approaching the level of "80", which indicates that the instrument is overbought in the ultra-short term.

Existing long positions should be kept until the situation clears up.

Resistance levels: 1920.82, 1935.00, 1955.00, 1966.25.
Support levels: 1910.00, 1900.00, 1885.00, 1872.80.

http://businesspr-finance.com/wp-content/uploads/2020/10/xauusd21102020-55.png

http://businesspr-finance.com/wp-content/uploads/2020/10/xauusd21102020-66.png

Trading tips

To open long positions, one can rely on the breakout of 1920.82. Take-profit – 1950.00. Stop-loss – 1905.00. Implementation time: 2-3 days.

A rebound from 1920.82 as from resistance followed by a breakdown of 1910.00 may become a signal for new sales with the target at 1885.00. Stop-loss – 1925.00.

Use more opportunities of the NPBFX analytical portal: trading signals for commodities

How can a trader determine if it’s worth buying or selling XAU/USD now or better waiting for a more favorable period? Use trading signals for commodities from the top 10 technical indicators on the NPBFX portal and make the right decisions! All registered users have free and unlimited access to the minutely updated trading signals (MA10, BBands, Ichimoku, Stochastic, ZigZag, etc.) for Gold, Silver, Brent and WTI Crude oil.

If you have any questions about trading instruments, you can always ask an analyst in the online chat on the portal and get a free consultation of an experienced specialist.

Use the current recommendations of analysts on XAU/USD and trade efficiently with NPBFX.

559 (edited by Antony_NPBFX 2020-10-23 09:26:26)

Re: NPBFX - making money with us since 1996!

GBP/USD: GBP is declining 23.10.2020

Good afternoon, dear forum visitors!

NPBFX offers the latest release of analytics on GBP/USD for a better understanding of the current market situation and more efficient trading.

Current trend

GBP is declining against USD today, developing a "bearish" momentum formed the day before. GBP returned to negative dynamics yesterday after a record rally on Wednesday, which was fueled by growing hopes for a trade deal conclusion between the UK and the EU before the Brexit transition period expires in December. According to new estimates, the agreement could be signed by mid-November.

USD got moderate support yesterday after the publication of strong data on the dynamics of jobless claims. At the same time, investors have practically resigned themselves to the fact that new measures to support the US economy still cannot be agreed upon before the presidential elections in November, since it was not possible to reach a consensus among the American legislators.

On Friday, the pressure on GBP is exerted by uncertain statistics from the UK. Gfk Consumer Confidence Index in October fell from –25 to –31 points, which turned out to be worse than market forecasts of –28 points.

Support and resistance

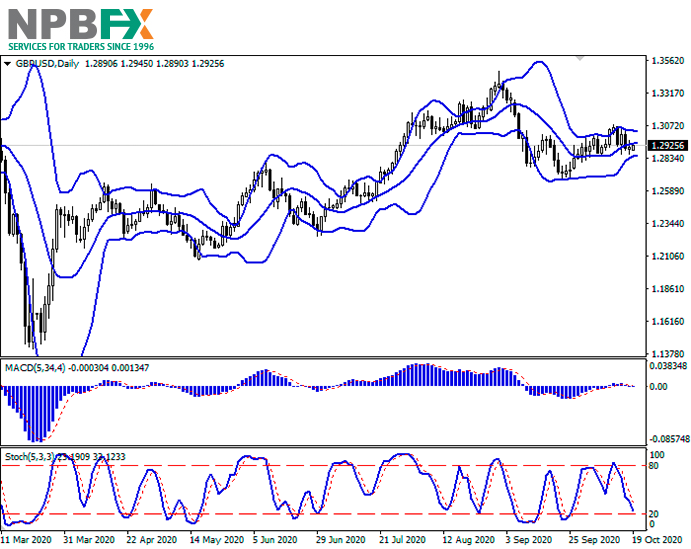
Bollinger Bands in D1 chart show moderate growth. The price range slightly widens from above, which does not contradict the further growth of the instrument in the short term. MACD indicator is growing preserving a weak buy signal (located above the signal line). Stochastic is gradually reversing into a horizontal plane as it approaches the level of "80", reacting to the downtrend at the end of the week.

Resistance levels: 1.3081, 1.3125, 1.3175, 1.3200.
Support levels: 1.3000, 1.2960, 1.2900, 1.2850.

Trading tips

To open new short positions, one can rely on the breakdown of 1.3000. Take-profit – 1.2900. Stop-loss – 1.3050. Implementation time: 2-3 days.

Long positions can be opened after a breakout of 1.3050 with the target at 1.3125. Stop-loss – 1.3000.

Use more opportunities of the NPBFX analytical portal: E-book

If you just recently started to be interested in trading on FOREX and would like to deepen your knowledge, an electronic Beginner's Guide to FOREX Trading will be an excellent helper for you here. The book consists of 5 chapters and reflects fundamental concepts of the foreign exchange market to start successful trading. From the main chapters of the E-book you can learn about the concepts and history of FOREX, currencies and trend lines, technical indicators, types of orders, trading on news, psychology of trading, risk management and much more.

You can read a Beginner's guide to FOREX Trading online or download it free of charge from the NPBFX analytical portal in the "Education" section. In order to get unlimited access to the E-book and other useful instruments on the portal, you need to register on the NPBFX website.

If you have any questions about trading instruments, you can always ask an analyst in the online chat on the portal and get a free consultation of an experienced specialist.

Use the current recommendations of analysts on GBP/USD and trade efficiently with NPBFX.

Re: NPBFX - making money with us since 1996!

USD/CHF: the dollar is waiting 26.10.2020

Good afternoon, dear forum visitors!

NPBFX offers the latest release of analytics on USD/CHF for a better understanding of the current market situation and more efficient trading.

Current trend

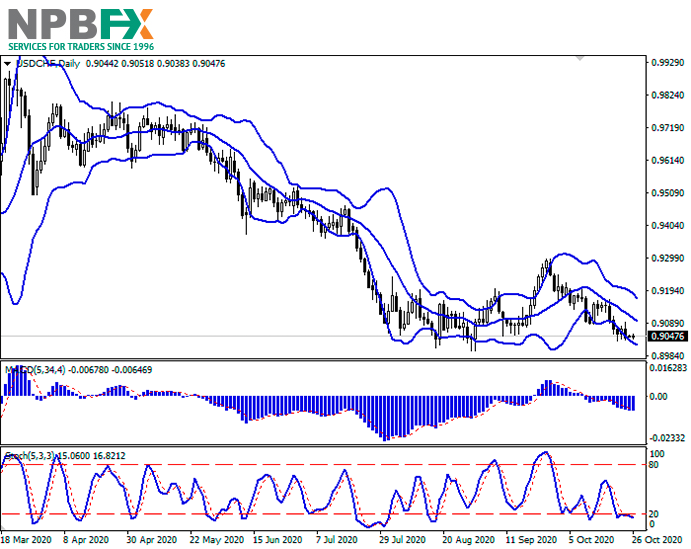
Today during the Asian session, the USD/CHF pair is showing ambiguous trading dynamics, holding just above the key support at 0.9000. Positive macroeconomic statistics, as well as hopes for the approval of a new stimulus package for the American economy in the foreseeable future, are holding back USD from further decline.

Investors continue to react to Friday's US business activity reports. Thus, Markit Manufacturing PMI for October rose slightly from 53.2 to 53.3 points, which is only 0.1 points less than market expectations. In turn, Service PMI for the same period increased from 54.6 to 56 points, while analysts did not expect changes in the indicator. Markit Composite PMI for October rose from 54.3 to 55.5 points.

On Monday, traders are awaiting the publication of statistics on the dynamics of new home sales in the US for September, as well as a speech by the head of the Swiss National Bank, Thomas Jordan.

Support and resistance

On the daily chart, Bollinger bands are steadily declining. The price range is narrowing, reflecting the ambiguous nature of trading in the short term. The MACD indicator is trying to reverse upward, maintaining a sell signal (the histogram is below the signal line). Stochastic decreased below the level of 20 and is directed horizontally, signaling in favor of short-term and/or ultra-short term corrective growth.

Resistance levels: 0.9074, 0.9100, 0.9132, 0.9170.
Support levels: 0.9029, 0.9000, 0.8960.

http://businesspr-finance.com/wp-content/uploads/2020/10/usdchf26102010-55-1.png

http://businesspr-finance.com/wp-content/uploads/2020/10/usdchf26102010-66-1.png

Trading tips

Long positions may be opened after the rebound from 0.9029 and the breakout of 0.9074 with the target at 0.9132. Stop loss – 0.9035. Implementation period: 2–3 days.

Short positions may be opened after the breakdown of 0.9029 with the target at 0.8960. Stop loss – 0.9065.

Use more opportunities of the NPBFX analytical portal: analytics

You can find more actual analytical reviews on other popular currency pairs, metals and CFDs on the NPBFX online portal. Daily analytics with charts, current market prognoses and trading scenarios in the Feed section are available. Get free and unlimited access to the online portal after registering on the official website of NPBFX Company.

If you have any questions about trading instruments, you can always ask an analyst in the online chat on the portal and get a free consultation of an experienced specialist.

Use the current recommendations of analysts on USD/CHF and trade efficiently with NPBFX.

Post's attachments

usdchf26102010-55-1.png 139.4 kb, file has never been downloaded. 

You don't have the permssions to download the attachments of this post.

Re: NPBFX - making money with us since 1996!

NZD/USD: the pair is showing neutrality 28.10.2020

Good afternoon, dear forum visitors!

NPBFX offers the latest release of analytics on NZD/USD for a better understanding of the current market situation and more efficient trading.

Current trend

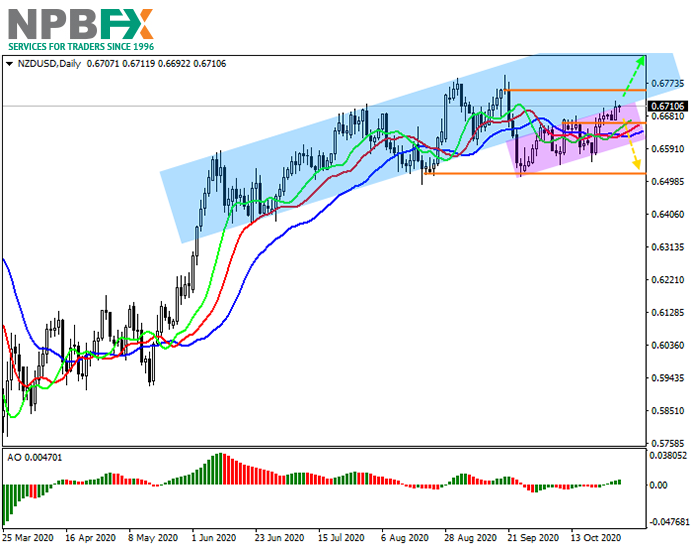
The NZD/USD pair is showing neutral dynamics, trading near the level of 0.6710.

Yesterday the Bureau of Economic Statistics of New Zealand released international trade data. Exports for September amounted to $4.01 billion, and imports reached $5.02 billion. It negatively affected the monthly balance, which entered the negative zone and amounted to –$1.017 billion, which is significantly worse than the August indicator of –$282 million.

USD remains under pressure. On Tuesday, October the CB consumer confidence index was released, which fell to 100.9 against the forecast of 102.0. However, the main threat comes from the protests that have begun in Washington. Citizens, dissatisfied with the actions of law enforcement officers, gathered near a police station in the north of the capital. The experience of summer stocks suggests that the risks of a significant conflict are quite high; therefore, the prospects for the growth of the US dollar are doubtful.

Support and resistance

The price reached the resistance line of the local ascending channel, which coincides with the support of the global channel, which the price left in September. Technical indicators are in a buy state, which indicates a high probability of the instrument returning to the global channel. Alligator indicator’s EMA fluctuations range is directed upwards, and the histogram of the AO oscillator trades in the positive zone.

Resistance levels: 0.6753, 0.6900.
Support levels: 0.6656, 0.6522.

http://businesspr-finance.com/wp-content/uploads/2020/10/nzdusd28102020-33.png

Trading tips

After growth or consolidation above the local resistance line around 0.6753, buy positions with a target around 0.6900 are relevant. Stop loss is 0.6700. Implementation period: 7 days or more.

After decline and reversal or consolidation below the local support at 0.6656, sell positions with the target at 0.6522 are relevant. Stop loss is 0.6700.

Use more opportunities of the NPBFX analytical portal: glossary

Beginning traders certainly face a lot of specialized concepts and lexicon on FOREX, which are often not fully been understood. Swap, tick, hedge, margin calls are often unfamiliar to beginning traders. But the lack of knowledge of these fundamentals make a competent market vision impossible. So glossary on the NPBFX analytical portal could be an excellent helper in this case, which contains all the main definitions with explanations in a compact and accessible form. All concepts are arranged in alphabetical order, so that you can easily and quickly find and explore a new concept for yourself.

If you have any questions about trading instruments, you can always ask an analyst in the online chat on the portal and get a free consultation of an experienced specialist.

Use the current recommendations of analysts on NZD/USD and trade efficiently with NPBFX.

563 (edited by Antony_NPBFX 2020-12-04 08:36:36)

Re: NPBFX - making money with us since 1996!

GBP/USD: GBP resumes growth 04.12.2020

Good afternoon, dear forum visitors!

NPBFX offers the latest release of analytics on GBP/USD for a better understanding of the current market situation and more efficient trading.

Current trend

GBP shows a slight increase in trading this morning session, maintaining the "bullish" momentum, which again intensified the day before, when the markets reacted to the progress in the issue of fiscal stimulus for the US economy. In addition, the general optimism is transmitted to the expectation of a Brexit trade agreement between the UK and the EU. However, the latest comments from officials are somewhat alarming, given that there is very little time left until the end of the year.

Thursday's macroeconomic statistics from the UK provided moderate support to the instrument. Markit Services PMI in November increased from 45.8 to 47.6 points, while analysts did not expect any changes at all.

Investors are focused on the November statistics on the US labor market today. In particular, the US economy is expected to show a sharp slowdown in job creation, but at the same time will be characterized by a decline in the Unemployment Rate to 6.8%

Support and resistance

Bollinger Bands in D1 chart show moderate growth. The price range is expanding insignificantly, reflecting the ambiguous nature of trading this week. MACD indicator is growing preserving a weak buy signal (located above the signal line). Stochastic, once again approaching the level of "80", reversed into a horizontal plane, reacting to the "bearish" trend last Wednesday.

Existing long positions should be kept until technical indicators are clarified.

Resistance levels: 1.3500, 1.3650.
Support levels: 1.3400, 1.3300, 1.3250, 1.3200.

Trading tips

To open long positions, one can rely on the breakout of 1.3500. Take-profit – 1.3600–1.3650. Stop-loss – 1.3425. Implementation time: 2-3 days.

A rebound from 1.3500 as from resistance followed by a breakdown of 1.3400 may become a signal for new sales with the target at 1.3250. Stop-loss – 1.3500.

Use more opportunities of the NPBFX analytical portal: analytics

You can find more actual analytical reviews on other popular currency pairs, metals and CFDs on the NPBFX online portal. Daily analytics with charts, current market prognoses and trading scenarios in the Feed section are available. Get free and unlimited access to the online portal after registering on the official website of NPBFX Company.

If you have any questions about trading instruments, you can always ask an analyst in the online chat on the portal and get a free consultation of an experienced specialist.

Use the current recommendations of analysts on GBP/USD and trade efficiently with NPBFX.

Post's attachments

gbpusd04122020-55.png 141.37 kb, file has never been downloaded. 

gbpusd04122020-66.png 154.29 kb, file has never been downloaded. 

You don't have the permssions to download the attachments of this post.

Re: NPBFX - making money with us since 1996!

Results of the October’s Battle of Traders and top 10 winners of the contest

We present the results of the next stage of the Battle of Traders.contest on demo accounts from NPBFX. 2347 traders took part in the October’s contest which is more than 500 participants bigger than in the same period last year. Each month traders from different countries use a unique opportunity to experience the spirit of real trading competition and win a prize fund of $2500 without risks and their own investments. For fans of Apple gadgets, it will be important to know that the super prize of the contest, starting in November, will be the newest iPhone 12 Pro! In today's review, we share the most interesting facts of the October’s battle, as well as the top-10 trading accounts of the past month.

The most successful trader was a participant with the nickname Marlen (account number 211446). With just 25 trades, he managed to increase the starting $5000 on the account to $250,234. This means that in addition to the prize of $1000, the trader receives the super prize of the October’s contest - iPhone 11 Pro! The list of achievements of the contest will also include the most successful transaction of the winner: the sale of AUD/USD with a volume of 140 lots, with a profit of more than $107,000.

The largest number of transactions (5467!) was made by a trader under the nickname BenGold (account no. 212251). Unfortunately, the effectiveness of the trading strategy was not enough to enter the top prize winners. Another participant with the nickname seregey (account number 212745) closed only 10 transactions to win the 9th place in the competition ranking. There are no restrictions on trading strategies in the contest, and participants demonstrated a variety of trading methods: from monoportfels to a mix of currency pairs, indices, stocks and ETFs, CFDs on energy and precious metals.

Who of the participants shared the prize fund of the contest? Here are the top-10 winners of the October’s Battle of Traders! The best traders in October were contestants with nicknames: Marlen, KiritoMad, itfarka, Anaid, FCCreader, elfaith, HoangThanh, LegendaBudakFx, seregey, cukundur.

http://businesspr-finance.com/wp-content/uploads/2020/12/itogi-oct-2020-eng.png

NPBFX expresses gratitude to the traders who took part in the contest and invites them to participate in the new round of Battle! Don't miss the chance to get real money and the newest gadgets by trading on a demo   account. Feel the taste of real emotions and victory with NPBFX!

Sign up for the Battle of Traders right now.

Re: NPBFX - making money with us since 1996!

NZD/USD: NZD is recovering 09.12.2020

Good afternoon, dear forum visitors!

NPBFX offers the latest release of analytics on NZD/USD for a better understanding of the current market situation and more efficient trading.

Current trend

NZD demonstrates active growth against USD today, leveling the results of the correctional decline observed since Monday. The pair adds about 0.32% and is actively testing the level of 0.7060 for a breakout.

Today, the instrument is significantly supported by macroeconomic statistics from New Zealand. Manufacturing Sales in Q3 2020 increased by 17.3% QoQ after declining by 12% QoQ in the previous period.

In turn, the data from China disappointed investors. The Consumer Price Index in China fell by 0.6% MoM in November after falling by 0.3% MoM in the previous month. Analysts expected a decline of 0.2% MoM. In annual terms, inflation also slowed down by 0.5% YoY after increasing by 0.5% YoY a month earlier.

Support and resistance

Bollinger Bands in D1 chart show stable growth. The price range is narrowing, reflecting ambiguous nature of trading in the short/ultra-short term. MACD is trying to reverse upwards again but preserves its previous sell signal (located below the signal line). Stochastic, having approached the level of "20" is also reversing upwards, reacting to the restoration of "bullish" activity on Wednesday.

One should wait until the situation is cleared up and the signals from technical indicators are clarified to open new trading positions for the instrument.

Resistance levels: 0.7050, 0.7100, 0.7150, 0.7200.
Support levels: 0.7000, 0.6962, 0.6913, 0.6853.

Trading tips

To open long positions, one can rely on the breakout of 0.7100. Take-profit – 0.7200. Stop-loss – 0.7050. Implementation time: 2-3 days.

The breakdown of the level of 0.7000 may be an alternative. Take profit – 0.6913. Stop-loss – 0.7050.

Use more opportunities of the NPBFX analytical portal: glossary

Beginning traders certainly face a lot of specialized concepts and lexicon on FOREX, which are often not fully been understood. Swap, tick, hedge, margin calls are often unfamiliar to beginning traders. But the lack of knowledge of these fundamentals make a competent market vision impossible. So glossary on the NPBFX analytical portal could be an excellent helper in this case, which contains all the main definitions with explanations in a compact and accessible form. All concepts are arranged in alphabetical order, so that you can easily and quickly find and explore a new concept for yourself.

If you have any questions about trading instruments, you can always ask an analyst in the online chat on the portal and get a free consultation of an experienced specialist.

Use the current recommendations of analysts on NZD/USD and trade efficiently with NPBFX.

Re: NPBFX - making money with us since 1996!

GBP/USD: GBP remains under pressure 11.12.2020

Good afternoon, dear forum visitors!

NPBFX offers the latest release of analytics on GBP/USD for a better understanding of the current market situation and more efficient trading.

Current trend

GBP is trading with an uptrend paired with USD in trading this morning session, recovering from a noticeable decline the day before, which was caused by another postponement of the trade deal between the UK and the EU. The day before, the European Commission President Ursula von der Leyen said that the parties are still facing a number of disagreements, but the signing of a trade agreement is quite possible by the end of this week.

Yesterday's macroeconomic statistics from the UK turned out to be ambiguous, which also partly contributed to the development of "bearish" trend for the instrument. UK GDP in October slowed down from +1.1% MoM to +0.4% MoM, apparently responding to repeated restrictive measures, as well as a weak economic recovery after the first wave of lockdowns. At the same time, Industrial Production in October rose by 1.3% MoM, while analysts expected an increase of only 0.3% MoM. In annual terms, the rate of production decline slowed down from –6.3% YoY to –5.5% YoY.

Support and resistance

In the D1 chart, Bollinger Bands are reversing horizontally. The price range is expanded from below reflecting rise of "bearish" sentiment in the short term. MACD is going down keeping a fairly stable sell signal (located below the signal line). Stochastic shows a similar trend. The indicator reversed into a horizontal plane, responding to the corrective growth of the instrument at the trading today.

Resistance levels: 1.3300, 1.3350, 1.3400, 1.3450.
Support levels: 1.3250, 1.3200, 1.3125.

Trading tips

To open long positions, one can rely on the breakout of 1.3350. Take-profit – 1.3450. Stop-loss – 1.3300. Implementation time: 2-3 days.

The development of "bearish" trend with the breakdown of 1.3250 may become a signal for further sales with target at 1.3150. Stop-loss – 1.3300.

Use more opportunities of the NPBFX analytical portal: economic indicators

Regular monitoring of global economic indicators plays an important role in trading, because of their strong influence on FOREX market and possibility to provoke significant price fluctuations. For the convenience of traders the "Education" section on the NPBFX portal contains the most popular and significant world economic indices with a detailed description, their possible impact on the economy and exchange rates (GDP, consumer price index, unemployment rate, Nonfarm Payrolls (NFP), etc.).

If you have any questions about trading instruments, you can always ask an analyst in the online chat on the portal and get a free consultation of an experienced specialist.

Use the current recommendations of analysts on GBP/USD and trade efficiently with NPBFX.
Re: NPBFX - making money with us since 1996!

Brent Crude Oil: prices are recovering 14.12.2020

Good afternoon, dear forum visitors!

NPBFX offers the latest release of analytics on Brent Crude Oil for a better understanding of the current market situation and more efficient trading.

Current trend

Today, during the Asian session, oil prices are showing upward dynamics, trying to consolidate above the psychological level of $50 per barrel. The instrument dropped slightly at the end of the last trading week, however, it was caused by technical factors.

The quotes are strongly supported by optimism regarding vaccines against COVID-19. Last weekend, it became known that the US Food and Drug Administration (FDA) noted the advantage of the vaccine from Pfizer and approved its use for the population over 16 years old. A vaccination campaign is expected to start soon in the US, which will strengthen the market's confidence that the next year can be survived without new lockdowns.

Meanwhile, Baker Hughes' report on active oil platforms in the US, released on Friday, again reflected a solid increase from 246 to 258 units.

Support and resistance

On the daily chart, Bollinger Bands reverse into a horizontal plane. The price range is expanding from above but not as fast as the “bullish” dynamics develop. The MACD indicator is growing, maintaining a poor buy signal (the histogram is above the signal line). Stochastic, without reaching the overbought area, reversed into a horizontal plane near the level of 80, indicating the ambiguous nature of the last days' trading.

The current readings of technical indicators do not contradict the further development of upward dynamics.

Resistance levels: 51.07, 52.00, 53.00.
Support levels: 50.00, 49.07, 48.40, 47.50..

Trading tips

Long positions may be opened after the breakout of 51.07 with the target at 53.00. Stop loss – 50.00. Implementation period: 2–3 days.

Short positions may be opened after the breakdown of 49.07 with the target at 47.50. Stop loss – 50.00.

Use more opportunities of the NPBFX analytical portal: trading signals for commodities

How can a trader determine if it’s worth buying or selling Brent Crude Oil now or better waiting for a more favorable period? Use trading signals for commodities from the top 10 technical indicators on the NPBFX portal and make the right decisions! All registered users have free and unlimited access to the minutely updated trading signals (MA10, BBands, Ichimoku, Stochastic, ZigZag, etc.) for Gold, Silver, Brent and WTI Crude oil.

If you have any questions about trading instruments, you can always ask an analyst in the online chat on the portal and get a free consultation of an experienced specialist.

Use the current recommendations of analysts on Brent Crude Oil and trade efficiently with NPBFX.

Re: NPBFX - making money with us since 1996!

EUR/USD: euro is near record highs 16.12.2020

Good afternoon, dear forum visitors!

NPBFX offers the latest release of analytics on EUR/USD for a better understanding of the current market situation and more efficient trading.

Current trend

Today during the Asian session, the EUR/USD pair is growing slightly, gradually returning to the previous record highs around 1.2174.

USD weakens amid optimism about COVID-19 vaccinations, actively starting around the world. The process may begin in the US soon, as the Food and Drug Administration (FDA) recently approved the use of Pfizer and BioNTech vaccines. Yesterday, it became known that the FDA is preparing to publish the results of the third phase of clinical trials of the vaccine from Moderna, which can also be interpreted as the first step towards its approval for emergency use in the country. Meanwhile, the epidemiological situation in the US remains difficult. Earlier, the mayor of New York expressed the idea of returning the city to a full-fledged quarantine in response to a sharp increase in the case number.

On Wednesday, European investors are focused on the block of macroeconomic statistics on business activity in Germany and the EU. Analysts predict the data to be poor, so there is no expectation of noticeable growth in the single currency.

Support and resistance

On the daily chart, Bollinger bands actively grow. The price range narrows, indicating the emergence of flat dynamics in the short term. MACD grows but keeps a sell signal (the histogram is below the signal line). Stochastic grows but rapidly approaches its highs, indicating that EUR may become overbought in the ultra-short term.

Resistance levels: 1.2200, 1.2243, 1.2270, 1.2300.
Support levels: 1.2150, 1.2087, 1.2039, 1.2000.

Trading tips

Long positions may be opened after the breakout of 1.2200 with the target at 1.2300. Stop loss – 1.2150. Implementation period: 2–3 days.

Short positions may be opened after the breakdown of 1.2087 with the target at 1.2000. Stop loss – 1.2150.

Use more opportunities of the NPBFX analytical portal: economic indicators

Regular monitoring of global economic indicators plays an important role in trading, because of their strong influence on FOREX market and possibility to provoke significant price fluctuations. For the convenience of traders the "Education" section on the NPBFX portal contains the most popular and significant world economic indices with a detailed description, their possible impact on the economy and exchange rates (GDP, consumer price index, unemployment rate, Nonfarm Payrolls (NFP), etc.).

If you have any questions about trading instruments, you can always ask an analyst in the online chat on the portal and get a free consultation of an experienced specialist.

Use the current recommendations of analysts on EUR/USD and trade efficiently with NPBFX.

Re: NPBFX - making money with us since 1996!

USD/JPY: dollar is correcting 18.12.2020

Good afternoon, dear forum visitors!

NPBFX offers the latest release of analytics on USD/JPY for a better understanding of the current market situation and more efficient trading.

Current trend

Today during the Asian session, the USD/JPY pair grows confidently, recovering from the record lows, renewed yesterday.

Also to technical factors supporting the dollar at the end of the week, the Food and Drugs Administration's readiness to approve Moderna's COVID-19 vaccine affects it positively. However, US macroeconomic statistics often come out worse than market forecasts, and it puts additional pressure on USD. So, yesterday, investors negatively met an increase in Initial Jobless Claims, as well as a sharp drop in the dynamics of Retail Sales. For November, the indicator fell by 1.1% MoM after falling by 0.1% MoM last month. Investors expected negative dynamics at the level of –0.3% MoM.

The Japanese yen, in turn, is under moderate pressure after the meeting of the Bank of Japan on Friday. As expected, the Japanese regulator did not change the monetary policy parameters but extended the terms of its program for the buyback of commercial paper by six months until September 2021.

Support and resistance

On the daily chart, Bollinger bands actively decline. The price range widens from the bottom, reflecting continued “bearish” potential in the short term. MACD reversed towards growth but keeps its sell signal (the histogram is below the signal line). Stochastic shows similar dynamics, retreating from its lows and signaling in favor of the development of corrective growth in the ultra-short term.

Resistance levels: 103.64, 103.90, 104.20, 104.50.
Support levels: 103.35, 103.00, 102.80.

Trading tips

Long positions may be opened after the breakout of 103.64 with the target at 104.20. Stop loss – 103.35. Implementation period: 2–3 days.

Short positions may be opened after the rebound from 103.64 and the breakdown of 103.35 with the target at 102.80. Stop loss – 103.64.

Use more opportunities of the NPBFX analytical portal: E-book

If you just recently started to be interested in trading on FOREX and would like to deepen your knowledge, an electronic Beginner's Guide to FOREX Trading will be an excellent helper for you here. The book consists of 5 chapters and reflects fundamental concepts of the foreign exchange market to start successful trading. From the main chapters of the E-book you can learn about the concepts and history of FOREX, currencies and trend lines, technical indicators, types of orders, trading on news, psychology of trading, risk management and much more.

You can read a Beginner's guide to FOREX Trading online or download it free of charge from the NPBFX analytical portal in the "Education" section. In order to get unlimited access to the E-book and other useful instruments on the portal, you need to register on the NPBFX website.

If you have any questions about trading instruments, you can always ask an analyst in the online chat on the portal and get a free consultation of an experienced specialist.

Use the current recommendations of analysts on USD/JPY and trade efficiently with NPBFX.

Re: NPBFX - making money with us since 1996!

USD/CAD: the pair actively grows 21.12.2020

Good afternoon, dear forum visitors!

NPBFX offers the latest release of analytics on USD/CAD for a better understanding of the current market situation and more efficient trading.

Current trend

The USD/CAD pair actively grows, trading at the level of 1.2840.

Since the opening of the trading session, USD has maintained a positive impulse formed on Friday and is winning back losses against CAD. Experts say that one of the main reasons for the positive dynamics is the noticeable progress in negotiations on the budget and additional financial incentives for $900 billion. Today, the negotiations will continue as usual, as Donald Trump signed a decree extending funding for another day.

CAD is trading at fairly stable levels. However, according to the latest data, the economic recovery may take longer than expected. It was announced during a press conference by the Governor of the Bank of Canada Tiff Macklem. The main reason is closed borders and increased purchase prices for imports. According to published statistics, Canada's fiscal balance stood at –216.62 billion Canadian dollars versus –198.11 billion in early fall, while the core retail sales index for October reached 0.0%, down from 1.0% for September.

Support and resistance

Locally, the price broke through the resistance line of the local downtrend and confidently consolidated above it. Technical indicators issued a new local buy signal. Fast EMAs on the Alligator indicator crossed the signal one upwards, and the AO oscillator histogram moved into the positive zone.

Resistance levels: 1.2870, 1.3090.
Support levels: 1.2770, 1.2690.

Trading tips

After growth or consolidation above the local resistance level at 1.2870, buy positions with the target at 1.3090 are relevant. Stop loss is 1.2800. Implementation period: 7 days or more.

After reversal and decline or consolidation below the local support at 1.2770, sell positions with the target at 1.2690 are relevant. Stop loss is 1.2800.

Use more opportunities of the NPBFX analytical portal: weekly FOREX forecast

You can learn more about the current situation on USD/CAD and get acquainted with the weekly analytical forecast in the "Video reviews" section on the NPBFX portal. Weekly video reviews contain trends, key levels, trading recommendations for such popular instruments as EUR/USD, GBP/USD, USD/JPY, AUD/USD. In order to get free and unlimited access to video forecast and other useful instruments on the portal, you need to register on the NPBFX website.

If you have any questions about trading instruments, you can always ask an analyst in the online chat on the portal and get a free consultation of an experienced specialist.

Use the current recommendations of analysts on USD/CAD and trade efficiently with  NPBFX.

Re: NPBFX - making money with us since 1996!

GBP/USD: the pair is correcting 23.12.2020

Good afternoon, dear forum visitors!

NPBFX offers the latest release of analytics on GBP/USD for a better understanding of the current market situation and more efficient trading.

Current trend

The pair is showing a lateral trend, located at 1.3400.

Trading on the instrument is characterized by strong volatility amid the situation around Brexit. Despite the fact that the final deadline for agreeing a trade deal between the UK and the EU comes only on December 31, one can already say that the negotiations have failed. However, the parties made solid steps towards each other: London reduced the amount of the required compensation from 50% to 35%, and the EU increased its proposal from 12% to 25%.

Another factor influencing the volatility of the pair was the macroeconomic data from the UK and the US. The adjusted GDP of Great Britain in Q3 2020 reached 16.0% against the expected 15.5%, and the GDP of the USA in the same period amounted to 33.4%, which is better than the projected 33.1%. It is also worth noting the growth in the Total Business Investment in the UK by 9.4% against the forecast of 8.8%.

Support and resistance

The pair continues to trade within the local ascending channel, correcting upwards after a significant decline. Technical indicators are still in a state of global purchase. The fast EMAs on the Alligator indicator have crossed, and the AO oscillator histogram is trading in the positive zone.

Resistance levels: 1.3470, 1.3580.
Support levels: 1.3220, 1.2900.

Trading tips

If the asset reverses and continues growing and the price consolidates above the local resistance level of 1.3470, long positions will be relevant with target at 1.3580. Stop-loss – 1.3400. Implementation time: 7 days and more.

If the asset continues to decline and the price consolidates below the local support at 1.3220, short positions can be opened with the target at 1.2900. Stop-loss – 1.3300.

Use more opportunities of the NPBFX analytical portal: economic indicators

Regular monitoring of global economic indicators plays an important role in trading, because of their strong influence on FOREX market and possibility to provoke significant price fluctuations. For the convenience of traders the "Education" section on the NPBFX portal contains the most popular and significant world economic indices with a detailed description, their possible impact on the economy and exchange rates (GDP, consumer price index, unemployment rate, Nonfarm Payrolls (NFP), etc.).

If you have any questions about trading instruments, you can always ask an analyst in the online chat on the portal and get a free consultation of an experienced specialist.

Use the current recommendations of analysts on GBP/USD and trade efficiently with NPBFX.

Re: NPBFX - making money with us since 1996!

NZD/USD: return to the record highs 28.12.2020

Good afternoon, dear forum visitors!

NPBFX offers the latest release of analytics on NZD/USD for a better understanding of the current market situation and more efficient trading.

Current trend

NZD has shown moderate gains against USD in trading this morning session, again testing 0.7120 for a breakout. Amid extremely low volatility in the market driven by the Christmas and New Year holidays, the instrument is moderately supported by the continued optimism about coronavirus vaccines and the conclusion of a trade agreement between the UK and the EU.

USD is declining again in response to difficulties in aligning the US budget for 2021 and delays in approving a new fiscal stimulus package. According to the media, Donald Trump signed both bills, although he had sharply criticized the proposed package of measures before, demanding an increase in the coronavirus payments from USD 600 to 2,000 per person. Last week, the US Congress approved a relief package that includes the allocation of USD 900B in direct aid to people and businesses.

Support and resistance

Bollinger Bands in D1 chart show insignificant growth. The price range is narrowing from below, reflecting the ambiguous dynamics of trading in the short term. MACD is trying to resume growth keeping a previous sell signal (located below the signal line). Stochastic is showing similar dynamics; however, it is already approaching its highs, indicating the risks of overbought instrument in the ultra-short term.

It is worth looking into the possibility of the "bullish" trend development in the short and/or ultra-short term.

Resistance levels: 0.7150, 0.7200, 0.7241.
Support levels: 0.7100, 0.7050, 0.7000, 0.6962.

Trading tips

To open long positions, one can rely on the breakout of 0.7150. Take-profit – 0.7241. Stop-loss – 0.7100. Implementation time: 2-3 days.

A rebound from 0.7150 as from resistance, followed by a breakdown of 0.7100 may become a signal for new sales with the target at 0.7000. Stop-loss – 0.7150.

Use more opportunities of the NPBFX analytical portal: glossary

Beginning traders certainly face a lot of specialized concepts and lexicon on FOREX, which are often not fully been understood. Swap, tick, hedge, margin calls are often unfamiliar to beginning traders. But the lack of knowledge of these fundamentals make a competent market vision impossible. So glossary on the NPBFX analytical portal could be an excellent helper in this case, which contains all the main definitions with explanations in a compact and accessible form. All concepts are arranged in alphabetical order, so that you can easily and quickly find and explore a new concept for yourself.

If you have any questions about trading instruments, you can always ask an analyst in the online chat on the portal and get a free consultation of an experienced specialist.

Use the current recommendations of analysts on NZD/USD and trade efficiently with NPBFX.

Re: NPBFX - making money with us since 1996!

EUR/USD: updating record highs 30.12.2020

Good afternoon, dear forum visitors!

NPBFX offers the latest release of analytics on EUR/USD for a better understanding of the current market situation and more efficient trading.

Current trend

EUR is rising against USD during today's Asian session, hitting record highs since April 2018. The instrument is supported by the increasing demand for risk at the end of the year amid the approval of a new financial aid package in the US. In addition, investors are pinning high hopes on allowing AstraZeneca's coronavirus vaccine to be available for sale in the UK, reasonably suggesting that increased market supply will help more citizens get vaccinated more quickly.

In turn, the trade deal between the EU and the UK, reached last week, provides moderate support to EUR.

Support and resistance

Bollinger Bands in D1 chart show moderate growth. The price range is slightly expanding from above, having difficulty keeping up with the development of the "bullish" trend in the short term. MACD has reversed to growth having formed a fairly certain buy signal (located above the signal line). Stochastic also demonstrates upward direction but is approaching its highs rapidly, which reflects risks of the overbought EUR in the ultra-short term.

Existing long positions should be kept until technical indicators are clarified.

Resistance levels: 1.2312, 1.2357, 1.2420.
Support levels: 1.2271, 1.2200, 1.2150, 1.2087.

Trading tips

To open long positions, one can rely on the breakout of 1.2312. Take-profit – 1.2420. Stop-loss – 1.2250. Implementation time: 1-2 days.

A rebound from 1.2312 as from resistance, followed by a breakdown of 1.2271 may become a signal for new sales with the targets at 1.2200–1.2150. Stop-loss – 1.2340.

Use more opportunities of the NPBFX analytical portal: glossary

Beginning traders certainly face a lot of specialized concepts and lexicon on FOREX, which are often not fully been understood. Swap, tick, hedge, margin calls are often unfamiliar to beginning traders. But the lack of knowledge of these fundamentals make a competent market vision impossible. So glossary on the NPBFX analytical portal could be an excellent helper in this case, which contains all the main definitions with explanations in a compact and accessible form. All concepts are arranged in alphabetical order, so that you can easily and quickly find and explore a new concept for yourself.

If you have any questions about trading instruments, you can always ask an analyst in the online chat on the portal and get a free consultation of an experienced specialist.

Use the current recommendations of analysts on EUR/USD and trade efficiently with NPBFX.

Re: NPBFX - making money with us since 1996!

USD/JPY: the instrument consolidates 04.01.2021

Good afternoon, dear forum visitors!

NPBFX offers the latest release of analytics on USD/JPY for a better understanding of the current market situation and more efficient trading.

Current trend

Today during the Asian session, the USD/JPY pair is slightly declining, testing the support level of 103.00 for a breakdown.

The US dollar is not expected to be in demand in the first hours of the new trading calendar year, reacting to the previous negative factors. At the end of December, the administration of the incumbent US President Donald Trump was able to agree on the details of a new financial support plan for the American economy, which is in a difficult situation due to a difficult epidemiological situation. USD is now facing a change of power but analysts say President-elect Joe Biden's initial course is unlikely to change much.

At the beginning of the week, JPY was slightly supported by positive national macroeconomic statistics. Thus, the Jibun Bank Manufacturing PMI rose from 49.7 to 50 points.

Support and resistance

On the daily chart, Bollinger bands moderately decline. The price range changes insignificantly, however, not as fast as the “bearish” dynamics develop in the short term. MACD falls, maintaining a relatively strong sell signal (the histogram is below the signal line). Stochastic falls, rapidly approaching the level of 20, which may indicate that USD may become oversold in the ultra-short term.

The current readings of technical indicators do not contradict the further USD decline in the next time intervals.

Resistance levels: 103.25, 103.39, 103.64, 103.90.
Support levels: 103.00, 102.80, 102.50.

Trading tips

Short positions may be opened after the breakdown of 103.00 with the target at 102.50. Stop loss – 103.25. Implementation period: 2–3 days.

Long positions may be opened after the rebound from 103.00 and the breakout of 103.25 with the target at 103.64. Stop loss – 103.00.

Use more opportunities of the NPBFX analytical portal: economic indicators

Regular monitoring of global economic indicators plays an important role in trading, because of their strong influence on FOREX market and possibility to provoke significant price fluctuations. For the convenience of traders the "Education" section on the NPBFX portal contains the most popular and significant world economic indices with a detailed description, their possible impact on the economy and exchange rates (GDP, consumer price index, unemployment rate, Nonfarm Payrolls (NFP), etc.).

If you have any questions about trading instruments, you can always ask an analyst in the online chat on the portal and get a free consultation of an experienced specialist.

Use the current recommendations of analysts on USD/JPY and trade efficiently with NPBFX.
Re: NPBFX - making money with us since 1996!

EUR/USD: EUR is consolidating 06.01.2021

Good afternoon, dear forum visitors!

NPBFX offers the latest release of analytics on EUR/USD for a better understanding of the current market situation and more efficient trading.

Current trend

EUR is trading ambiguously against USD this morning session, consolidating near 1.2300. The instrument has already managed to renew record highs, but further advance of EUR is complicated by some deterioration of the epidemiological situation in Europe. Germany extended the partial quarantine until the end of January, and the British authorities decided to do a full lockdown due to the detection of a new strain of coronavirus, which, according to preliminary estimates, may be 70% more infectious.

Macroeconomic statistics from Europe released on Tuesday were controversial. Retail Sales in Germany in November grew by 1.9% MoM and 5.6% YoY, which turned out to be significantly better than expected, but still indicates a slowdown in domestic trading activity. The Unemployment Rate in the largest European economy in December remained at 6.1%, and the Unemployment Change fell by 37K, while forecasts assumed its growth by 10K.

Support and resistance

Bollinger Bands in D1 chart show moderate growth. The price range is slightly expanding from above but it fails to conform to the development of "bullish" sentiments at the moment. MACD indicator is growing preserving a weak buy signal (located above the signal line). After a short decline, Stochastic reversed upwards again, responding to the return of "bullish" activity at the beginning of the week.

Current showings of the indicators do not contradict the further development of the uptrend in the short term.

Resistance levels: 1.2323, 1.2357, 1.2400.
Support levels: 1.2271, 1.2240, 1.2200, 1.2150.

Trading tips

To open long positions, one can rely on the breakout of 1.2323. Take-profit – 1.2400. Stop-loss – 1.2271. Implementation time: 1-2 days.

A rebound from 1.2323 as from resistance, followed by a breakdown of 1.2271 may become a signal for new sales with the target at 1.2150. Stop-loss – 1.2335.

Use more opportunities of the NPBFX analytical portal: glossary

Beginning traders certainly face a lot of specialized concepts and lexicon on FOREX, which are often not fully been understood. Swap, tick, hedge, margin calls are often unfamiliar to beginning traders. But the lack of knowledge of these fundamentals make a competent market vision impossible. So glossary on the NPBFX analytical portal could be an excellent helper in this case, which contains all the main definitions with explanations in a compact and accessible form. All concepts are arranged in alphabetical order, so that you can easily and quickly find and explore a new concept for yourself.

If you have any questions about trading instruments, you can always ask an analyst in the online chat on the portal and get a free consultation of an experienced specialist.

Use the current recommendations of analysts on EUR/USD and trade efficiently with NPBFX.