forex software

Create and Test Forex Strategies

forex software

Skip to forum content

Forex Software

Create and Test Forex Strategies

You are not logged in. Please login or register.


Forex Software → Forex Strategy Builder Professional → 4 Types of Data Patterns

Pages 1

You must login or register to post a reply

RSS topic feed

Posts: 9

1 (edited by sleytus 2018-12-24 03:21:07)

Topic: 4 Types of Data Patterns

In forex the raw data is ticks (essentially Bid and Ask prices) -- there are no such things as bars.  Bars are an artificial construct the MT4 software creates so you can see more data on a monitor.  Bars are also referred to as OHLC data (TimeStamp,Open, High, Low, Close).  If you are trading H1, then H1 bars are a condensed representation of hundreds or thousands of ticks that occurred over the past hour.

Strategies are composed of indicators -- usually some variation of moving averages.  Most indicators use Bar (OHLC) data and ignore the vast majority of tick data received by MT4.  This is neither good or bad -- perhaps I'll write more about this in a different post.

In this post I thought I would share some observations about the different types of data patterns received by each chart and which our strategies have to respond to.  This is not something I made up -- I think most experienced traders would agree.  Manual (mechanical) traders pay more attention to the data because their brain has to make the decisions.  People who use EAs tend to pay less attention to the data because they assume their EAs will do the right thing.

There are (at least) 4 types of price data patterns -- trend up, trend down, consolidating and ranging.  Perhaps there are more -- but these 4 pretty much cover what our strategies have to deal with.  Below is an image that shows an example of each (the image is from an H1 chart).

https://i.postimg.cc/MXCMDMS6/4-Types-Data-Patterns.png

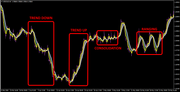
Keep in mind that strategies are very simple algebraic formulas.  There is no way for a simple algebraic formula to analyze and make decisions about complex data.  Turns out that most EAs exhibit much better performance when the data trends up or down, and perform poorly when the data pattern ranges or consolidates.

Here's an analogy.  In the old days when people wanted to determine which way the wind was blowing they would lick their thumb, extend their arm and hold their thumb up in the air.  If the wind was blowing strong in one direction (i.e. trend up or trend down), then this method worked fairly well and was accurate enough.  However, in cases where there was no wind (i.e. consolidation), then it didn't work so well.  Also, in cases where the wind kept changing directions (i.e. ranging), then, again, it wasn't very accurate.

Re: 4 Types of Data Patterns

Okay -- if you can see the 4 types of data patterns then you might wonder -- what does this mean?  How does this affect my trading?  There is no right or wrong answer -- but I can provide some additional clues.

Of the 4 data patterns -- two work in your favor, one against you and one is neutral:
Trend Up:       Most good strategies can detect this and do the right thing.
Trend Down:   Most good strategies can detect this and do the right thing.
Consolidation: Most good strategies do nothing -- i.e. don't trade.  So -- no gains and no losses.
Ranging:         This is the most challenging type of data pattern.  Most strategies use one or more variety of moving average indicator.  ALL indicators lag.  As a result, the indicators can not respond fast enough to the rapid and unexpected whip-saw pattern when prices range.  So, most strategies will perform poorly.

I've attached an image that compares EURUSD/H4 and AUDNZD/H4 for the same data horizon -- 12-JUL-2018 through 23-DEC-2018.  Do you see a difference?  Do you see that the EURUSD data pattern has several nice regions of trend up and trend down, whereas the AUDNZD looks to have one good trend up and the rest is mostly consolidating or very gradual trend down.  If you had to choose to trade one of these pairs, which would you choose?

https://i.postimg.cc/mh8DpB5n/comparing-trends-pairs.png

Re: 4 Types of Data Patterns

Continuing from the above post...

If you've gotten this far it may have occurred to you that not all data patterns are created equal.  Furthermore -- they are constantly changing.  It is hard to make absolute statements about data patterns -- however, I will state that trends work in your favor since most good strategies can detect trends.

So -- what are some of the lessons?  I can think of a few...

1. Multi-market testing is a waste of time -- in my opinion.  Take the above image that compares EURUSD/H4 versus AUDNZD/H4.  Suppose I generated and calibrated a strategy that gave very nice statistics for EURUSD/H4.  But when I used MM testing discovered it performed poorly against AUDNZD/H4 -- so I discarded it.  At this point I am slapping my forehead and shaking my head from left-to-right.  There is absolutely no reason why a strategy that was calibrated for one pair should perform well for a different pair -- their data patterns are completely different.

2. Suppose I have two portfolio EAs -- one for EURUSD/H4 and another for AUDNZD/H4.  What I might do is look at their data patterns for the past few months and see if one has more trending regions -- and then trade the pair with more trending regions.

3. Always (did I say always?), always keep your strategies calibrated with the most recent data from your broker.  How recent is recent?  That depends.  If you don't recalibrate it is for one of the following reasons:
a. You are lazy.
b. You believe in Santa Claus and the holy grail and that strategies created once will perform the same forever -- even though data patterns are constantly changing.
c. You've been trading for a long time and if you were to change now and routinely recalibrate then you would have to contemplate all those wasted years and money lost because you neglected this most simple chore.

Re: 4 Types of Data Patterns

what about this idea..Put the date of each patterns..e.g uptrend is between 2010-2012 and generate strategies in this period. than downtrend between 2012-2013 make here strategies. than if have different patterns put all eas into one ea than ea will be good for every pattern. maybe there must be something input field to say its uptrend downtrend right now or automatically detect it.

Re: 4 Types of Data Patterns

Very interesting perspective Sleytus. Looking at the complex market in a simplistic way. Thanks for sharing your thoughts. Please do share if you similar insights and the usage of FSB to tackle it.

Re: 4 Types of Data Patterns

Roughey wrote:

what about this idea..Put the date of each patterns..

Yes -- I agree.  I think this is the right way to think about it.  However, I've been down this path before -- previously I've written about creating "custom data sets" where I've stitched together data regions to create new *.csv that could be used to generate strategies and later calibrate them.  In the end I concluded it was a lot of work for questionable benefit.  I now feel that using your broker's most recent data is the best way to go -- even though it has a mix of different data patterns.

An alternative approach that is easier and simpler -- each weekend browse the historical data from different pairs and choose the one that seems to have more trend up / down patterns, and then trade that one the coming week.

In my experience, I keep coming back to EURUSD -- it just seems to have more trending patterns.  Consolidation isn't a big problem, since it usually means there will be few trades.  It is the ranging regions that give the worst results because our indicators with their simple algebraic equations and moving average algorithms can not handle the unexpected changes.  Since EURUSD represents the two largest economies, then when the ratio changes the moves seem to be less ranging in nature -- at least to my eyes.

7 (edited by sleytus 2018-12-24 21:27:22)

Re: 4 Types of Data Patterns

bharatw wrote:

Please do share if you similar insights and the usage of FSB to tackle it.

Here's another clue -- this one shows that the average bar size is different for different pairs.  I used the "Average Candle" indicator (https://www.forexfactory.com/showthread.php?p=6418349#post6418349) to create these charts:


https://i.postimg.cc/N5ng3kvq/average-candle-size.png

Clearly -- bar sizes differ from pair to pair.  And this probably is constantly changing -- that is, at different times EURUSD bars tend to be larger than USDCAD bars, and at other times the reverse is true.  The point is this -- data differs from symbol to symbol, not only in terms of their data patterns (trending, ranging, consolidating), but also their bar sizes.  So -- a strategy designed and calibrated for EURUSD should not be expected to perform well for other symbols.

As for insights when using FSB -- this is where I am currently at:
1. Pay attention to the data patterns as if you were trading manually.
2. Always, always keep your strategies fresh by recalibrating with your broker's most recent data.
3. Do not waste time on Multi-Market testing -- unless you are just curious -- and being curious is a very good quality to have.  If nothing else -- at least do not discard strategies simply because they fail an MM test.

P.S. If you click on the image I uploaded the yellow text may be hard to read -- I apologize for that.  You'll need to enlarge the image to see the numbers.

Re: 4 Types of Data Patterns

Spot on. Thanks for the share.

Re: 4 Types of Data Patterns

Continuing with how these observations might affect how you use Popov's amazing software tools...


If you follow why Multi-Market testing is a waste of time -- and, in fact, harmful if you are using it as a basis to discard strategies -- then it might occur to you that for the same reason OOS (Out-Of-Sample) testing is also a waste of time.

OOS testing is when you backtest a strategy against a chunk of data that it was not calibrated for.  This is no different than backtesting a strategy that was calibrated for EURUSD and expect it to perform well against USDJPY.  Strategies are composed of indicators -- which are simple algebraic formulas with a few settings.  When you calibrate a strategy the software (FSB-Pro or EA Studio or MT4 Strategy Tester) simply searches for settings that give the best statistics for the current chunk of data -- and it does this by trial-and-error.  That's it -- there is no magic or artificial intelligence.  There is no way for a simple algebraic formula whose settings were selected to work for one chunk of data patterns to also work for a different chunk of data patterns.

Okay -- but, then, of course some folks will claim they have found some strategies that do work with OOS data.  At this point, all you can do is roll your eyes.  If the OOS data they used is simply a continuation of the IS (In-Sample) data then, yes, of course, it looks like it magically works against new data.  It never occurs to them that since the OOS data is a continuation of the IS data then it likely contains the same data patterns as the IS data chunk that was used to calibrate the strategy in the first place.  If you are serious about OOS then you must use a chunk of data that is unrelated to the IS chunk.  But then, if you use an unrelated chunk of data all your strategies will fail the OOS test -- which doesn't feel good and leaves you with no strategies.  So, in the end, people will choose to return to using OOS in a way that makes them feel good or they will realize it's a waste of time.

And, finally, in case anyone is wondering -- the same holds for different time frames.  A strategy that was calibrated for EURUSD/H1 will not work for EURUSD/M15 (unless you re-calibrate using EURUSD/M15 data).

Posts: 9

Pages 1

You must login or register to post a reply

Forex Software → Forex Strategy Builder Professional → 4 Types of Data Patterns

Similar topics in this forum