1 (edited by yonkuro 2018-07-03 02:23:31)

Topic: Asymmetrical Strategy Using Oscillator Indicators

Dear Popov,

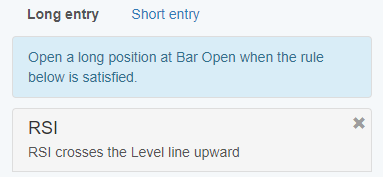
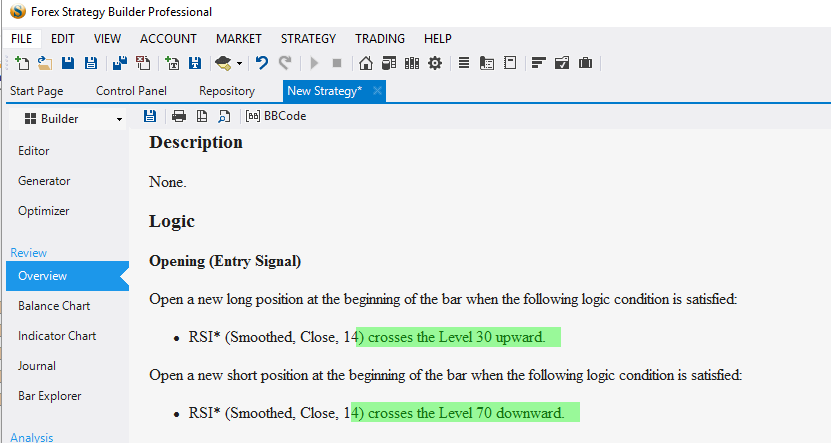
the most popular way to use oscillator indicators such as CCI and RSI is by applying overbought and oversold zone. For example, using CCI, we want to buy when price cross the oversold level at -100 upward and sell when price cross the overbought level at 100 downward, but we can't do that with generator, because the logic will be like this instead: buy when price cross -100 CCI value upward, and sell when price cross -100 CCI value downward (not 100), that means the EA will go long if price rise from oversold but it'll go short if price fall to oversold zone again.

Another example is an exit strategy using RSI, we want to close a long trade when price enter overbought zone above 70 value, and close a short trade when price enter oversold zone below 20 value, and the EA logic will close a long trade when price is above 70 value an close a short trade when price is below 70 value (not 20).

But many times, these asymmetrical strategies are able to make profit, however I'm afraid that this kind of logic will lead the strategy into curvefitting. I would appreciate hearing your opinion on this.

Best regards.

do or do not there is no try

Re: Asymmetrical Strategy Using Oscillator Indicators

For example, using CCI, we want to buy when price cross the oversold level at -100 upward and sell when price cross the overbought level at 100 downward,

This is the exact way  FSB Pro and EA Studio work since day 1.

Indicator     Long    Short
ADX           Level   Level
ATR           Level   Level
StDev         Level   Level
Volumes       Level   Level
AC            Level   -1 * Level
CCI           Level   -1 * Level
RVI           Level   -1 * Level
Bears Power   Level   -1 * Level
Bulls power   Level   -1 * Level
RSI           Level   100 - Level
Momentum      Level   200 - level
WPR           Level   -100 - Level

I'm surprised you doubt such common thing is not working properly. There are several ways to check it:
- the indicators source code
- the exported experts source code
- the Indicators Chart
- in the MT tester

Here is an example:

https://image-holder.forexsb.com/store/rsi-crosses-the-level-line-upward-strategy.png


https://image-holder.forexsb.com/store/rsi-crosses-the-level-line-upward-ind-chart.png

Re: Asymmetrical Strategy Using Oscillator Indicators

Actually it is even shown on FSB Pro.

https://image-holder.forexsb.com/store/rsi-crosses-the-level-line-upward-fsb-overview.png

4 (edited by yonkuro 2018-07-03 07:00:23)

Re: Asymmetrical Strategy Using Oscillator Indicators

You're correct, I really apologize, it's my fault, I was careless to give such wrong assumption.

do or do not there is no try

Re: Asymmetrical Strategy Using Oscillator Indicators

It is very good you asked this question because it is very frequent among the new users. I'll a add the answer in the FAQ page, which of course, no one reads. Anyway, it saves time to send a link instead of answering every time.

Re: Asymmetrical Strategy Using Oscillator Indicators

Popov wrote:

It is very good you asked this question because it is very frequent among the new users. I'll a add the answer in the FAQ page, which of course, no one reads.

big_smile

Thank you Popov

do or do not there is no try