Table of Contents
Market Panel
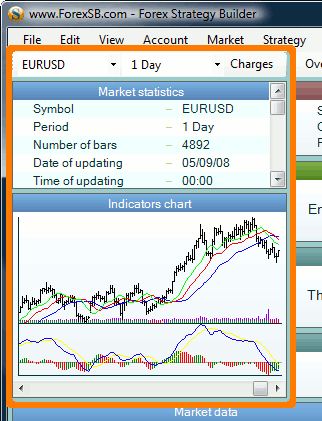
This panel allows you to choose the market data that Forex Strategy Builder will use to calculate the current strategy. It shows also market statistics and a simplified indicators chart.
Instrument Symbol
FSB comes with several preset symbols. You can add more currency pairs or other instruments to this list with the help of Instrument Editor. It is accessible from Market → Edit Instruments menu.
Any time you choose a given symbol, Forex Strategy Builder automatically loads the data and recalculates the strategy.
Data Period
After choosing a given data period, the program automatically loads the data and recalculates the strategy.
The available periods are:
1 Minute, 5 Minutes, 15 Minutes, 30 Minutes, 1 Hour, 4 Hours, 1 Day, 1 Week
Charges Button
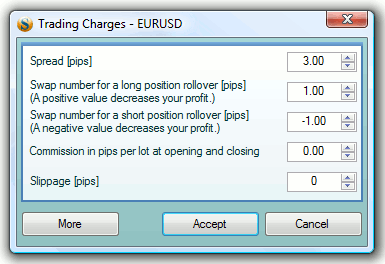
The Charges button opens the Trading Charges dialog box.
The respective trading fees can be set here: Spread, Swap Numbers, Commissions and Slippage.
For further information read the article Trading Charges. The full parameters of the corresponding currency are available for editing in the Instrument Editor window.
Market Statistics
This slot shows statistics on the loaded market data:
      Symbol                EURUSD
      Period                1 Day
      Number of bars        4892
      Date of updating      05/09/08
      Time of updating      00:00
      Date of beginning     06/27/89
      Time of beginning     00:00
      Data refining         Switched off
      Minimum price         0.8229
      Maximum price         1.6017
      Average Gap           5 pips
      Maximum Gap           477 pips
      Average High-Low      108 pips
      Maximum High-Low      607 pips
      Average Close-Open    56 pips
      Maximum Close-Open    441 pips
      Maximum days off      5
      Maximum data bars     20000
      No data older than    No limits - the limitations set by Data Horizon are displayed here
      No data newer than    No limits - the limitations set by Data Horizon are displayed here
Indicators Chart
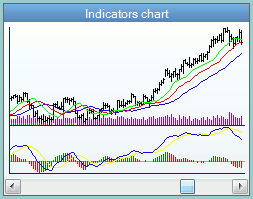
This is a simplified chart of the price and the applied technical indicators.
When you move the mouse cursor on the chart, dynamic information is generated in the status bar of the program. It shows the market data of the specified bar.
With a mouse-click, you can access a more detailed Indicator Chart.


