Table of Contents
Strategy Overview
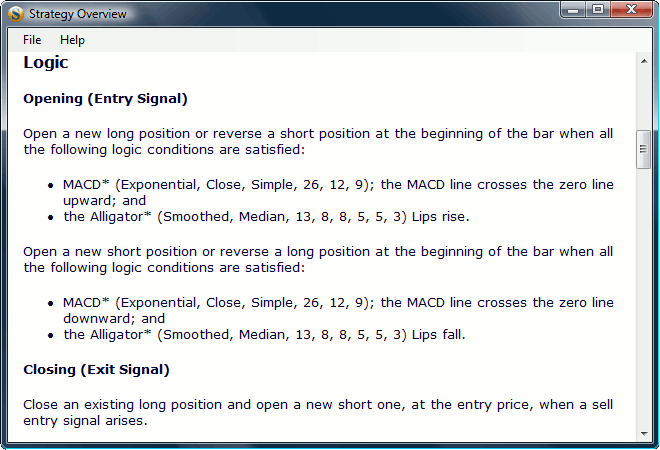
You can open the “Strategy Overview” information box using the Overview button, which is situated over the indicator slots, or using the fast access key F4.
“Strategy Overview” displays the author's description of the strategy and automatically generates information about the logic employed, the indicator slots and the statistics on the strategy.
Statistic Information
This an example of the stats parameters shown in the Overview.
| Market | Account | ||
|---|---|---|---|
| Symbol | EURUSD | Intrabar scanning | Not accomplished |
| Period | 1 Day | Interpolation method | Pessimistic scenario |
| Number of bars | 2699 | Ambiguous bars | 2 |
| Date of updating | 02/19/10 | Tested bars | 2694 |
| Time of updating | 00:00 | Initial account | 10000.00 USD |
| Date of beginning | 10/01/99 | Account balance | 12699.00 USD |
| Time of beginning | 00:00 | Minimum account | 9801.00 USD |
| Minimum price | 0.8227 | Maximum account | 13734.00 USD |
| Maximum price | 1.6038 | Maximum drawdown | 1569.00 USD |
| Average Gap | 4 pips | Max equity drawdown | 1582.00 USD |
| Maximum Gap | 162 pips | Max equity drawdown | 12.37 % |
| Average High-Low | 118 pips | Gross profit | 22036.00 USD |
| Maximum High-Low | 547 pips | Gross loss | -19337.00 USD |
| Average Close-Open | 58 pips | Sent orders | 4590 |
| Maximum Close-Open | 455 pips | Executed orders | 858 |
| Maximum days off | 4 | Traded lots | 858 |
| Maximum data bars | 20000 | Winning trades | 228 |
| No data older than | No limits | Losing trades | 201 |
| No data newer than | No limits | Win/loss ratio | 0.53 |
| Fill In Data Gaps | Switched off | Time in position | 51 % |
| Cut Off Bad Data | Switched off | Charged spread | 1287.00 USD |
| Charged rollover | 953.00 USD | ||
| Charged commission | 0.00 USD | ||
| Charged slippage | 0.00 USD | ||
| Total charges | 2240.00 USD | ||
| Balance without charges | 14939.00 USD | ||
| Account exchange rate | Not used | ||
Additional Statistics
The Additional Statistics information is not shown by default. You can enable it by switching on that option from the program's Testing → Additional Statistics menu.
| Parameter | Long + Short | Long | Short |
|---|---|---|---|
| Initial account | 10000.00 USD | 10000.00 USD | 10000.00 USD |
| Account balance | 12699.00 USD | 13887.00 USD | 8812.00 USD |
| Net profit | 2699.00 USD | 3887.00 USD | -1188.00 USD |
| Net profit % | 26.99% | 38.87% | -11.88% |
| Gross profit | 22036.00 USD | 12983.00 USD | 9053.00 USD |
| Gross loss | -19337.00 USD | -9096.00 USD | -10241.00 USD |
| Profit factor | 1.14 | 1.43 | 0.88 |
| Annualized profit | 259.66 USD | 373.95 USD | -114.29 USD |
| Annualized profit % | 2.60% | 3.74% | -1.14% |
| Minimum account | 9801.00 USD | 9523.00 USD | 7883.00 USD |
| Minimum account date | 4/21/2000 | 4/21/2000 | 6/6/2008 |
| Maximum account | 13734.00 USD | 14584.00 USD | 11098.00 USD |
| Maximum account date | 3/27/2009 | 6/26/2009 | 11/17/2000 |
| Absolute drawdown | 199.00 USD | 477.00 USD | 2117.00 USD |
| Maximum drawdown | 1569.00 USD | 920.00 USD | 3215.00 USD |
| Maximum drawdown % | 12.27% | 7.35% | 28.97% |
| Maximum drawdown date | 6/6/2008 | 5/7/2004 | 6/6/2008 |
| Historical bars | 2699 | 2699 | 2699 |
| Tested bars | 2694 | 2694 | 2694 |
| Bars with trades | 1380 | 752 | 628 |
| Bars with trades % | 51.22% | 27.91% | 23.31% |
| Number of trades | 429 | 223 | 206 |
| Winning trades | 228 | 131 | 97 |
| Losing trades | 201 | 92 | 109 |
| Win/loss ratio | 0.53 | 0.59 | 0.47 |
| Maximum profit | 715.00 USD | 515.00 USD | 715.00 USD |
| Average profit | 96.65 USD | 99.11 USD | 93.33 USD |
| Maximum loss | -405.00 USD | -360.00 USD | -405.00 USD |
| Average loss | -96.20 USD | -98.87 USD | -93.95 USD |
| Expected payoff | 6.29 USD | 17.43 USD | -5.77 USD |
| Average holding period returns | 0.06% | 0.15% | -0.05% |
| Geometric holding period returns | 0.06% | 0.15% | -0.06% |
| Sharpe ratio | 0.06 | 0.15 | -0.04 |
Using the Info
You are allowed to use this information when writing your own articles, on your web pages or blogs, but only if you include a link to the website site of Forex Strategy Builder - http://forexsb.com/.
