Table of Contents
Report
The Report page shows more detailed information of the backtest of the currently loaded Expert in the Editor.
The page consists of four tabs: Stats info, Indicator chart, Balance chart, Transactions log
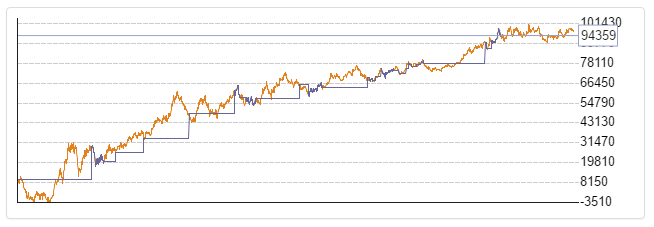
Toolbar
When you load an Expert Advisor in the Editor section, the best way to get a deeper insight into its backtest statistics is by going to the Report page.
Here, you will find four main tabs: Stats info, Indicator char, Balance chart, and Journal.
Stats info

Output parameters
Output parameter panel shows the values of all statistical parameters calculated by the backtesting engine of EA Studio.
- Net balance - the end amount in the trading account. The Net Balance is measured in the account's currency.
- Max drawdown - the reduction of the account after a series of losing trades. This is normally calculated by getting the difference between the previous account peak minus the lowest following bottom. The drawdown is shown as a percentage of the trading account.
- Executed orders - this is the number of executed transactions. Please note that the opening and the closing transactions are counted separately.
- Ambiguous bars - the program marks a bar as 'Ambiguous' when the historical data doesn't contain complete information for the sequence in which the program has to execute the orders. This may occur when Stop Loss and Take Profit are close to each other in the range in the same bar. In such cases EA Studio always makes a safe (pessimistic) guess .
- Profit per day - an average of the money gained by the strategy per day.
- Win/loss ratio - calculated by dividing the count of the winning trades by the count of all trades.
- Sharpe ratio - measures the risk-adjusted return. The higher the Sharpe ratio is, the better the Expert is.
- Average HPR - shows the average return received from holding an asset or portfolio of assets over a period of time, expressed as a percentage.
- Profit factor - the dollar amount the strategy made for every dollar it lost.
- System Quality number - the SQN number was studied by Dr Van Tharp. He found that the higher the SQN is, the better the trading system is.
Indicator chart
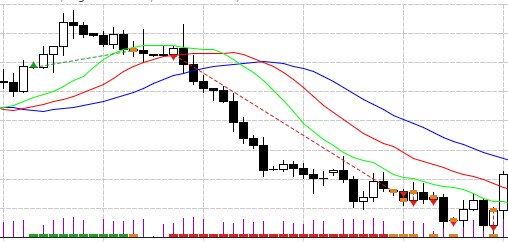
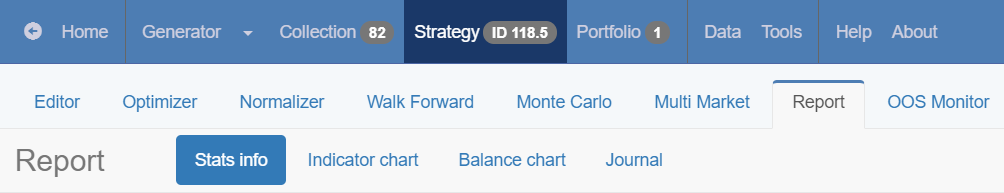
The Indicator chart shows the price bars, the indicators and the signals and the positions.
Trailing Stop Loss will show on the Indicator Chart whenever it is defined in the Strategy Properties.
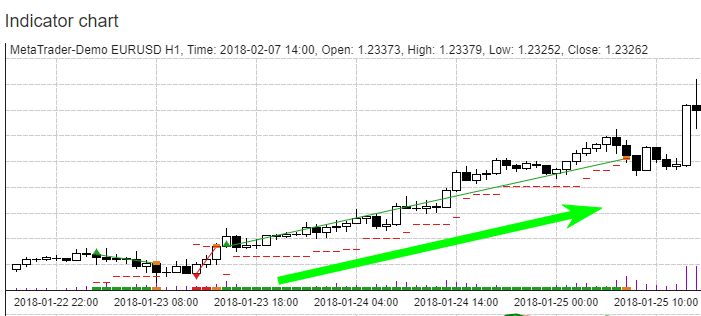
Balance chart
The chart shows the balance line and the equity lines produced by the backtest.
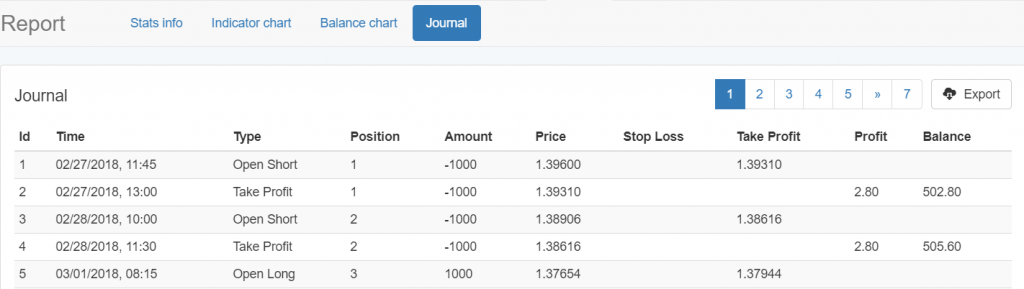
Journal
The Journal panel displays all of the trades that are part of the strategy's backtest. You can see the exact time and price at which the trades were opened or closed.
Then you can compare the information with a backtest of the same Expert Advisor, but this time in MetaTrader. The backtest results between the EA Studio and the MetaTrader platform should be almost equal.
If the two backtests do not match, this can be due to using different historical data or not using the same time zone for this data. If this is the reason, then you should not use the Expert Advisor in a real account, but perform a proper backtest.
Additionally, please note that if a strategy is over-optimized, even the smallest difference in the data or in the trading conditions will create very different results.