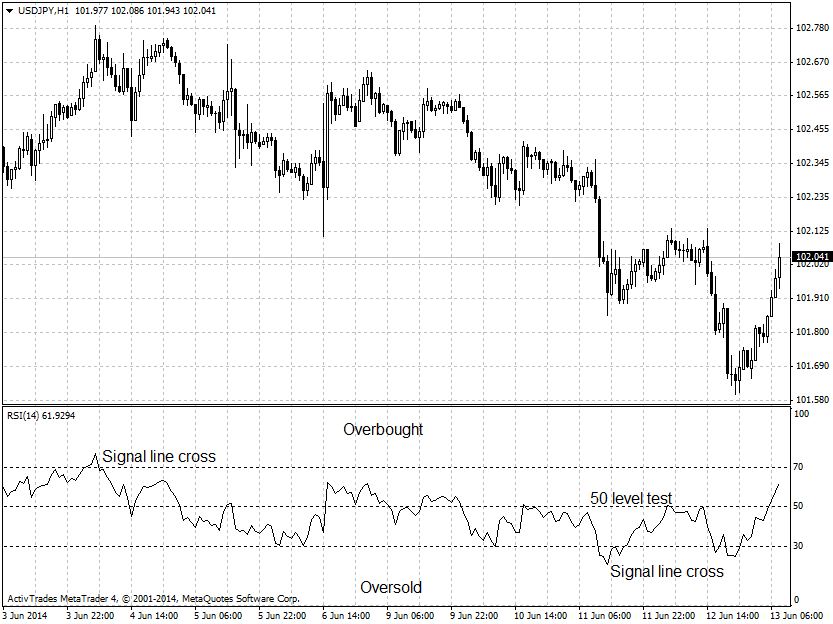
Relative Strength Index - RSI
The relative strength index (RSI) is designed to show the current and historical strength or weakness of the market based on the closing prices of a recent trading period. This is a momentum oscillator, measuring the velocity and magnitude of directional price movements. RSI is calculated as the ratio of higher closes to lower closes by the following formula:
RSI = 100 - 100/(1 + RS)
RS = Average of last "n" periods up closes / Average of last "n" periods down closes
RSI is plotted on a scale from 0 to 100 with main signal levels 30 and 70. Some traders and analysts use the 50 level for trading signals during a trend.
RSI is generating the following signals:
- Above 70 - overbought conditions
- Below 30 - oversold conditions
- Crosses of signal lines
- Divergence of the price and indicator charts
- Test of the 50 level during a correction of the trend
