Moving averages
Moving averages are statistical indicators to analyze data points by creating a series of averages of different subsets of the full data set. The first element of the moving average is obtained by taking the average of the initial fixed subset of the data series. Then the first number of the series is excluded and the next number following the original subset in the series is included. This way the average is moved forward until the last number of the data series. The plot line connecting all the calculated averages is the moving average. A moving average is a set of numbers, each of which is the average of the corresponding subset of a larger set of of the original data series.
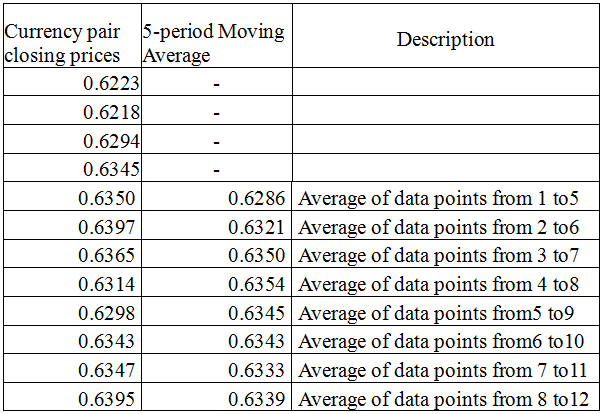
Calculation of 5-period Moving Average

Types of moving averages:
- simple moving average - the numbers of the data series are unweighted;
- weighted moving average - multiplying factors give different weights to data at different positions in the sample window;
- exponential moving average - similar to a simple moving average, except that more weight is given to the latest data.
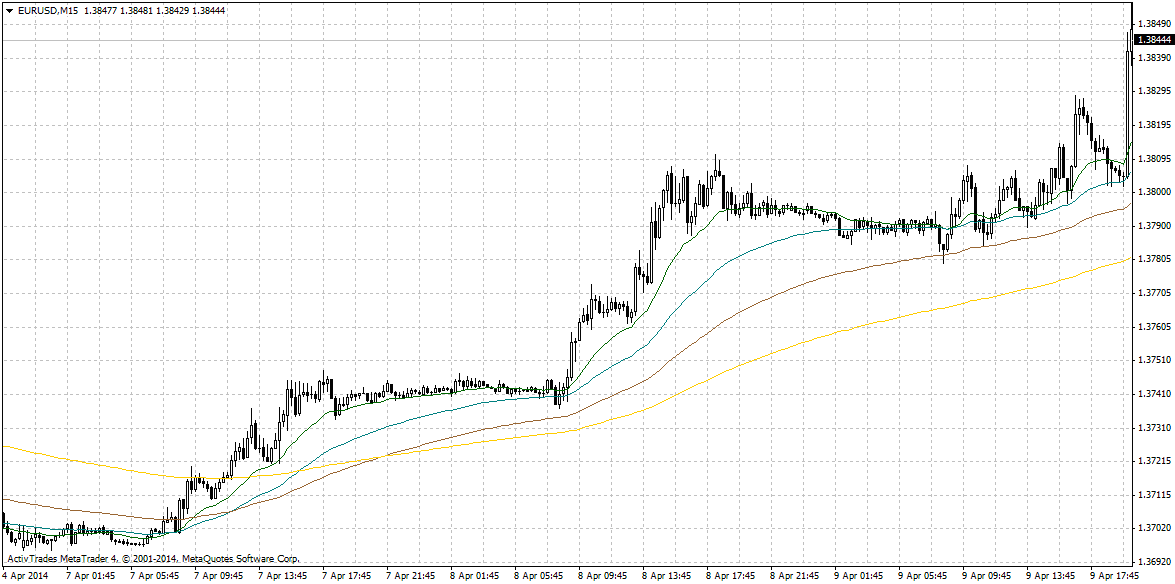
In trading, the moving averages are used mainly for determination of the presence and direction of the trend or as dynamic levels of support and resistance. To determine the trend we can use a trend line drawn through swing highs (for downtrend) or swing lows (in an uptrend). These lines, however, are static and if you use them you will miss a lot of price reversals, which are not on the trend lines. To avoid this disadvantage, it is much better to use dynamic trend lines such as the moving averages (see the chart below). They could follow the price depending on the selected period and the method of averaging and provide more or fewer signals.
