Moving Average Convergence Divergence - MACD
MACD is a technical indicator developed by Gerald Appel in the late 1970s and is supposed to reveal changes in the strength, direction, momentum, and duration of the trend. The MACD is calculated by subtracting the 26-period exponential moving average (EMA) from the 12-period EMA. A 9-period EMA of the MACD (signal line) is plotted also on top of the MACD. This is signal line is used as a trigger for buy and sell signals. MACD could be plotted with EMAs of different periods. Fore examples, if you use 1 and 20 periods, MACD will measure the distance between the current price and the 20-period EMA.
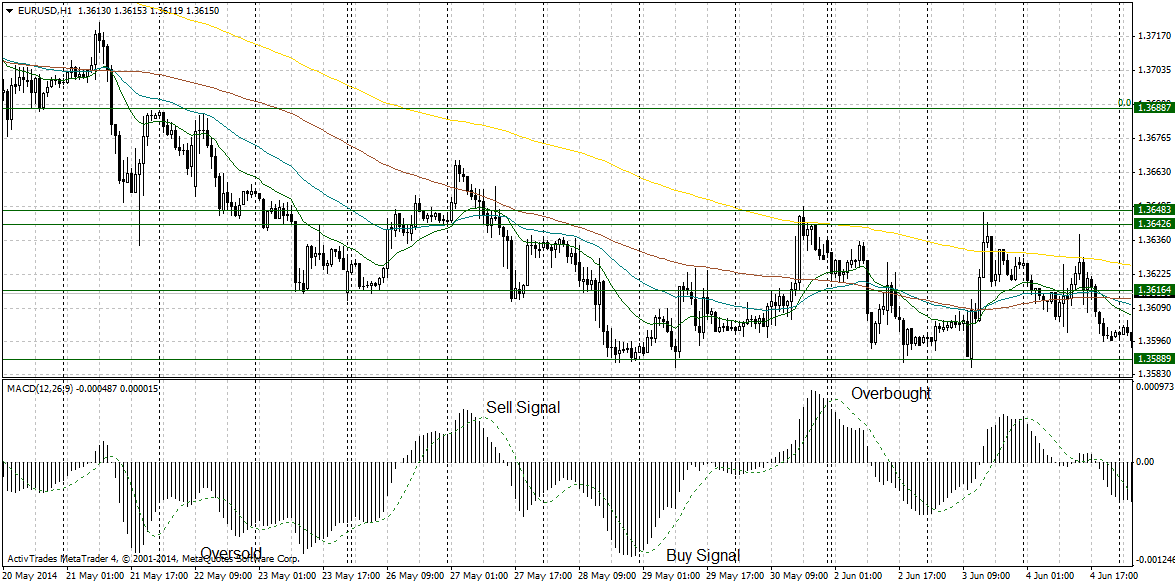
MACD is generating the following signals:
- Crossover of MACD and signal line generates buy and sell signals (see the chart below)
- Divergence of the MACD and the price
- Sharp rise or fall of MACD signal possible trend exhaustion
- Extreme values of MACD signal overbought and oversold conditions