Hourly High Low
The “Hourly High Low” indicator finds the highest price and the lowest price of the underlined instrument during a predefined time interval.
We set three parameters:
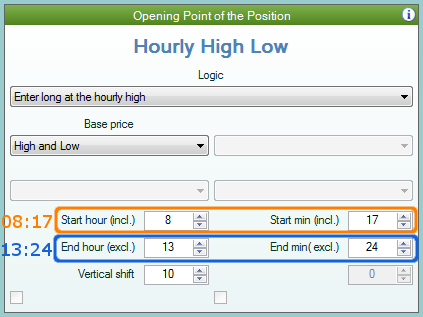
- Start Time – determined by the Start hour and Start minutes figures. As it’s shown on the picture – the starting hour is 08:17 H.
- End Time – determined by the End hour and End minutes parameters. On the picture is shown end time 13:24 H.
- Vertical shift – this number allows us to move the Upper and the Lower prices by defined number of pips.
Application
The indicator checks all the bars which opening prices are between Start Time and End Time:
Start Time ⇐ Bar Open time < End Time
We can apply “Hourly High Low” indicator on 4H or lower time frame.
It will not work properly on a daily or weekly chart.
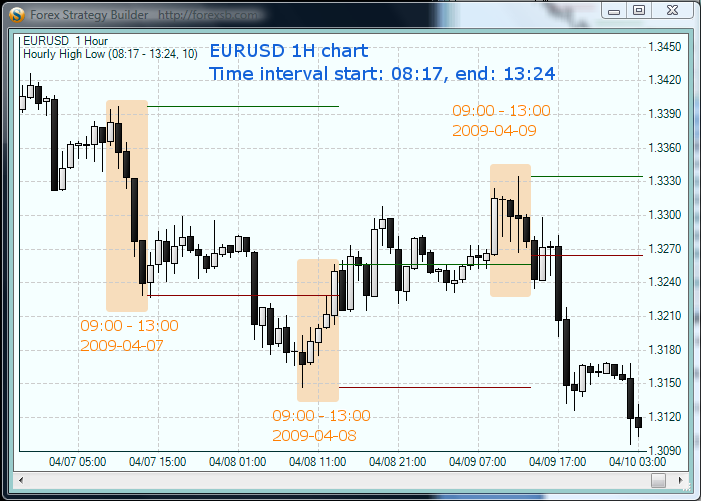
If you apply this indicator on an hourly chart, the indicator will select the High / Low prices of bars that start at: 09:00, 10:00, 11:00, 12:00 and 13:00.
08:17 < 09:00 … 13:00 < 13:24
The same applied on a 4H chart will return the High and Low of the bar that starts at 12:00.
08:17 < 12:00 < 13:24
The found High / Low prices during the chosen time interval are valid till the end of the time interval on the next day.
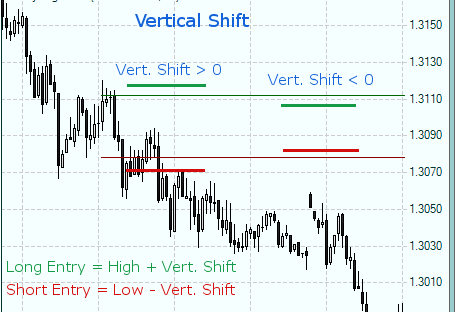
The vertical shift expands or contracts the price limits:
- Positive Vertical Shift – it raises the High price and lowers the Low price by the selected number of pips;
- Negative Vertical Shift - it lowers the High price and raises the low price by the selected number of pips.


