Table of Contents
Market Chart
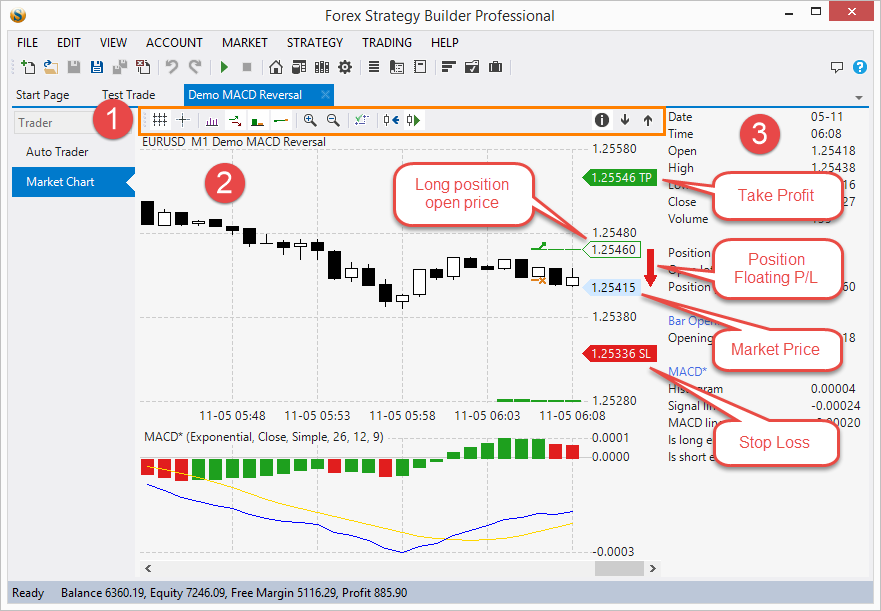
You can access the Market Chart in Trader mode. The chart looks much like the Indicator Chart in Builder Mode. You should take note that the Market Chart shows only the data for the currently selected connection (from Auto Trader)
The Market Chart will update only when FSB Pro receives data from MT. If there is no data yet received, the Market Chart will display a “Waiting for data…” message.
1. Toolbar
The toolbar is very similar to the Indicator Chart too.
Grid – toggles the grid
Cross – when toggled on, you will see a horizontal and a vertical line. On its right end, you can see the price, and below the Cross you can see the time
Tick volume – shows/hide the tick volume chart
Orders – show/hide the order arrows Lots of the position – shows the lots for each position
Plus and minus zooming tools - zoom the chart in and out
True indicator charts – show the indicators not as a line, but as discrete values
Chart shift – moves the chart a bit to the left to let you see what is going on with the last bar
Auto scroll – each time a new bar opens, the chart will automatically scroll to it; you can disable it when reviewing old trading orders
Info panel toggle – show/hide the Dynamic Info panel on the right. You also have access to buttons nearby, for scrolling the panel’s contents
2. Chart Area
On the right side of the chart are several markers. Those are arrow shaped figures that point to the left.
Green marker – Take Profit price
Red marker – Stop Loss price
Transparent marker with a green border – the position price
Sky blue marker – the current market price
The vertical arrow on the right of the markers is the floating Profit/Loss; the arrow will change colors depending on if the position is making a positive or negative profit
3. Dynamic Info
This panel updates automatically, unless you have toggled the Cross cursor from the toolbar. When the Cross is toggled on, the data will update as you move your cursor
