Table of Contents
Entering the Market at Crossover
I was asked recently to write about a strategy that uses two indicators’ crossover as an entry signal. So I will briefly explain how to do this in Forex Strategy Builder and I will comment on some interesting points meanwhile.
Crossover of two Momentum indicators
Let’s assume we want to enter the market when two Momentum indicators cross each other. We’ll use: Fast Momentum (10) and Slow Momentum (20)
The formula we use for calculating the Momentum indicator is as follows:
Momentum(10) = Price - Price10
Where:
Momentum(10) - Is the momentum for the current bar;
Price is the price of the current bar;
Price10 is the е base price 10 bars ago.
The same is applicable for the Slow Momentum(20) but for 20 bars ago.
Now this is the tricky bit - the two indicators will cross each other upwards only if the following two conditions are satisfied:
- Fast Momentum (10)1 < Slow Momentum (20)1 - Sigma; and
- Fast Momentum (10) > Slow Momentum (20) + Sigma.
(For downward crossing the formula is as follows:
- Fast Momentum (10)1 > Slow Momentum (20)1 + Sigma; and
- Fast Momentum (10) < Slow Momentum (20) - Sigma.
But in this article we’ll only use the upwards example so read carefully)
Where:
Fast Momentum (10)1 and Slow Momentum (20)1 are the values of the Momentum indicators from the previous bar;
Sigma is the permissible error when comparing floating point numbers.
I guess there won’t be any difficulties doing the maths for the first logical condition - we just compare the values of the two Momentum indicators from the previous bar. The things get a bit murkier when we develop the second logical condition:
Fast Momentum (10) > Slow Momentum (20) + Sigma
Fast Momentum (10) - Slow Momentum (20) > Sigma
Price - Price10 - (Price - Price20) > Sigma
Price - Price10 - Price + Price20 > Price20 - Price10 > Sigma
At this point we are able to see that this logical condition doesn’t depend on the current base price because we have two equal base prices with different signs that nullify each other. So the only thing left to determine the cross are the prices from 10 and 20 bars ago (and those two change only when a new bar opens). Therefore, we can only get signal to enter the market at the opening of a bar and in the world of back testing this means certain signals and no ambiguous bars (and in the world of real trading it means we only need to check for a cross at the beginning of each bar).
Let’s just put all the maths aside and see how we can actually set this condition in Forex Strategy Builder. We simply select Oscillator of Momentum* from the indicator list and set the parameters to (Simple, Close, 10, 20). Then we choose the logic we want to use for a long position - in our case “The Oscillator crosses the zero line upward”. Now FSB will use this oscillator to compare two Momentum indicators using periods of 10 and 20 bars respectively. When Oscillator of momentum crosses the zero line upwards it means that Fast Momentum (10) also crosses Slow Momentum (20) upwards.
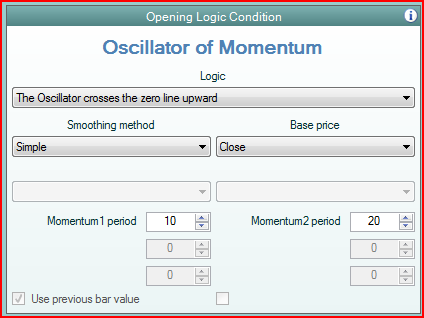
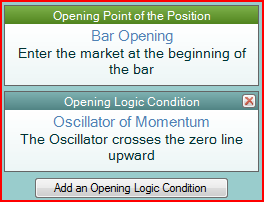
Now FSB will use this condition to enter the market long and will automatically adjust the opposite condition (The Oscillator crosses the zero line downwards) to enter the market short. The entry can only happen at Bar Opening price.
Crossover of two Simple Moving Average indicators
It gets a bit more complicated when using Simple Moving Averages. Theformula for MA is as follows:
MA(n) = (Price + Price1 + Price2 + … + Pricen-1 + Pricen) / n
In other words we sum up the base prices of the last “n” bars and we divide the result by “n”.
Another version of the same formula is this one:MA(n) = MA1 + Price / n - Pricen+1 / n
We use the same logical conditions to determine if the two MAs cross each other.
- FastMA(m)1 < SlowMA(n)1 - Sigma; and
- FastMA(m) > SlowMA(n) + Sigma.
Let’s develop the second condition again:
FastMA(m) > SlowMA(n) + Sigma
FastMA(m) - SlowMA(n) > Sigma
FastMA(m)1 + Price / m - Pricem+1 / m - SlowMA(n)1 - Price / n + Pricen+1 / n > Sigma
Price / m - Price / n + FastMA(m)1 - SlowMA(n)1 + Pricen+1 / n - Pricem+1 / m > Sigma
(n*Price - m*Price) / (m*n) > Sigma - FastMA(m)1 + SlowMA(n)1 - Pricen+1 / n + Pricem+1 / m
Price > (Sigma + SlowMA (n)1 - FastMA(m)1 + Pricem+1 / m - Pricen+1 / n) * (n * m) / (n - m)
Now we can determine the base price at which the two MA indicators are equal and the values of the base price at which the two MA indicators cross each other.
Two MAs are equal when the current price is:
Critical Price = (SlowMA(n)1 - FastMA(m)1 + Pricem+1 / m - Pricen+1 / n) * (n * m) / (n - m)
Where:
Critical Price is the price at which the MAs are equal;
FastMA(m)1 is the previous value of the fast MA;
SlowMA(n)1 is the previous value of the slow MA;
m is the period of the fast MA;
n is the period of the slow MA;
If we want to enter the market when the two MAs cross each other then we’ll have to place our entry order at this “Critical” price. Depending on what price we use for a base price of those two MAs we might encounter some problems.
Let’s examine the following three examples where we use for our MAs base price these three prices: Open Price, Close Price and Median Price (High + Low) / 2.
Moving Average Based on Open Price
In this case we certainly know the true price of bar opening because it doesn’t change for the whole bar. Therefore, the two MAs will not change while the bar develops. Thus the MAs can cross each other only at bar opening and will never cross inside a bar. So we can only open a position at the bar opening.
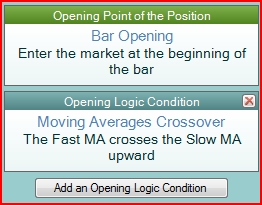
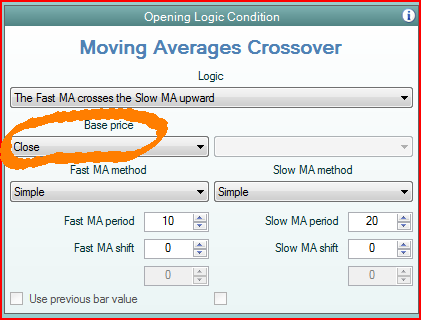
To test this strategy in Forex Strategy Builder you need to set the Opening Point of the Position to Bar Opening and use the Moving Average Crossover indicator as an Opening Logic Condition:
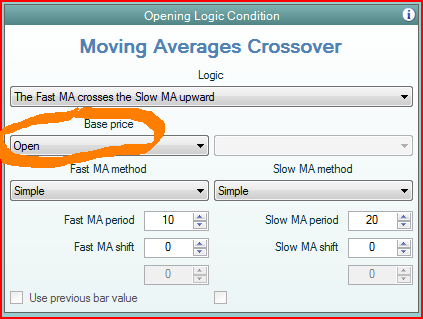
Moving Average based on Close Price
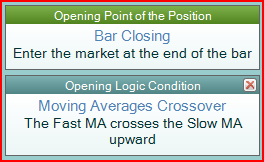
In this case we use the bars’ closing prices to calculate the MAs. And therefore, like in the first example, there is only one place in the whole bar where the two MAs can cross each other and that is at the closing of the bar. Thus we can only open position at the end of a bar:
Moving Average based on Median Price
Like in the previous example if we use a bar’s Median Price [(High + Low)/2] for our MAs base price we will only be able to open position at the closing of a bar. This time it is not so obvious since the High and Low prices are not at the end of a bar (usually). However, we cannot know what the correct High and Low prices of a bar are until that particular bar has closed. That is why we use market entry when the bar closing is reached. Opening at “Bar Closing” price is the only way to achieve robust backtest results.
This is also true when using other prices like Typical and Weighted as a base price.
Using other prices for entering the market
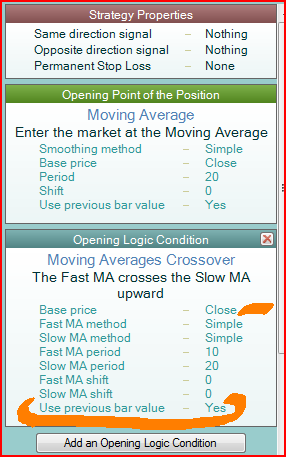
Forex Strategy Builder allows you to safely use two indicators crossover as a filter for entering the market. In order to protect the users from setting ambiguous entry rules, the software automatically turns on the “Use previous bar value” parameter. This way the historical test is carried out using correct data and will not result in ambiguous bars. In other words FSB does not cheat by “looking into the future” in order to obtain the missing data by getting the high, low and close prices the moment the bar opens.
Now let’s look at an example of a strategy using two MAs crossover as an entry signal where we enter the market at the price of the slower MA. Since the price of the slower MA can be reached during the bar we need to set strict rules of whether to enter the market and at what price. We’ll use the cross of the two MAs (Fast MA(10) and Slow MA (20)) as a logical filter. However, the only way to correctly recognize the signal is to use the previous values of the indicators that we know. That is why the “Use previous bar value” is turned on.
Crossover Example
Let’s examine a strategy that opens position when two MAs cross each other: a slow Simple Moving Average(Close, 50) and a fast Simple Moving Average(Close, 7).
We’ll enter long when the fast MA crosses the slow MA upwards and when the fast MA crosses the slow MA downwards we’ll enter short. At the end of the day we’ll close our position.
On Jan 22 2008 at the moment the new bar opens we see that the fast MA(7) has crossed the slow MA (50) downwards 10 pips deep.
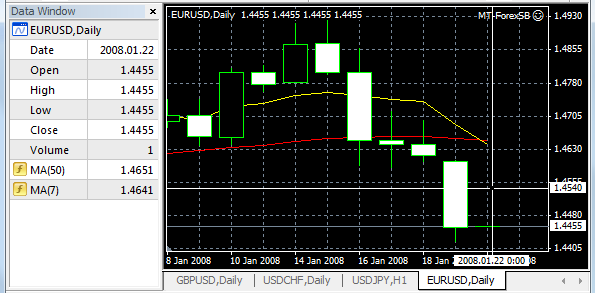
Following the open logic we enter the market short at current price - 1.4455.
However, during the day the price starts to rally and the close price for the day and the bar is 1.4627. Following our closing condition we exit the market at the same 1.4627 price. We lose 172 from this trade only not taking into account the spread you are charged.
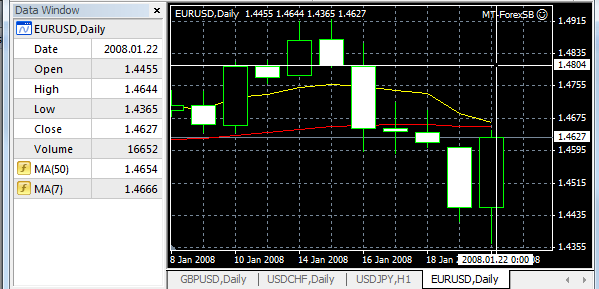
If we look at the two MAs now, we’ll see that this time they don’t cross each other. In fact the fast MA(7) is 12 pips higher than the slow MA(50).
At this point we see that we shouldn’t have opened the position in the first place and lost 172 pips. If we correctly back test the same strategy we’ll see that such deal will not even exist. On the back test graphic the two MAs would have never crossed each other.
This way the results will be more optimistic than real life experience.
The explanation of this, at first glance, technical irregularity is very straightforward. At the beginning of the bar the real time trading platform shows that the indicators cross each other but this outcome has not been calculated correctly. The fast MA(7) for example has been calculated based on the last 6 bars’ close price plus the current bar open price, the same is true for the slow MA(50). We have witnessed the cross of two undeveloped MAs.
The prices needed for the calculation of the correct values of the indicators (MAs in our example) are only available at the end of each bar and not in the beginning (like in the real life example).
Conclusion
In order to conduct a reliable back test of a strategy we need to know the correct values of the indicators. There are many back test platforms that would give your indicator the high, low and close prices before the end of the bar and therefore ruining the test’s reliability.
It is not very difficult t realize that if we use MA that is calculated based on the Price Close, we cannot have a value for the current bar until the end of that bar (on a daily chart we cannot use the midday price as a close price to calculate the MA since that price will most likely change till the end of the day an we’ll end up using a false value of our indicator to enter the market).
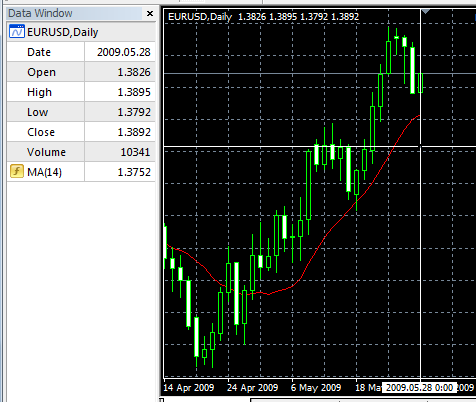
Look at this screen shot taken form a popular forex platform in 1.35pm. We can see that the software shows the price of Close = 1.3892 and MA(14) = 1.3752. However, these are not the correct values for conducting a back test because they are temporary and are due to change in the very next tick. We can use such temporary data in real trading but if we want to make a back test, those values will generate incorrect results.
You can trade a strategy that uses two indicators’ crossover on the real market, but if you want to make a back test with the same condition you need to define the correct entry time. For example Moving Average, Bollinger Bands, Bar Opening, Bar Closing or some other.