Re: NPBFX - making money with us since 1996!

ExxonMobil Corp.: technical analysis 12.12.2022

Good afternoon, dear forum visitors!

NPBFX offers the latest release of analytics on ExxonMobil Corp. for a better understanding of the current market situation and more efficient trading.

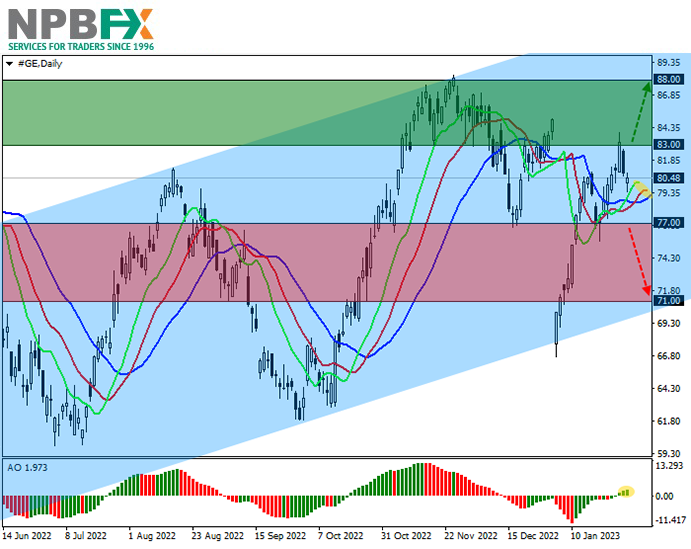
Shares of ExxonMobil Corp., an American oil company, are falling within a local corrective trend, trading at 103.00.

On the daily chart, the formation of a global uptrend continues, and the price is currently correcting, falling towards the resistance line of the global triangle pattern, coinciding with the 61.8% Fibonacci full retracement level of around 95.50.

In the four-hour timeframe, the quotes have almost reached the 38.2% Fibonacci base correction level at 102.70, and consolidation below it will mean the start of a full-fledged decline.

Technical indicators reversed and gave a sell signal: fast EMAs on the Alligator indicator crossed the signal line downwards, and the AO oscillator histogram is forming downward bars in the sell zone.

https://i.ibb.co/qsx79fZ/XOM121222-22.png

Trading tips

Short positions may be opened after the price drops and consolidates below 102.70 with the target at 95.50. Stop loss — 105.00. Implementation period: 7 days or more.

Long positions may be opened after a reversal, growth, and consolidation of the price above 107.20 with the target at 114.40. Stop loss – 104.00.

Use more opportunities of the NPBFX analytical portal: analytics

You can find more actual analytical reviews on other popular currency pairs, metals and CFDs on the NPBFX online portal. Daily analytics with charts, current market prognoses and trading scenarios in the Feed section are available. Get free and unlimited access to the online portal after registering on the official website of NPBFX Company.

If you have any questions about trading instruments, you can always ask an analyst in the online chat on the portal and get a free consultation of an experienced specialist.

Use the current recommendations of analysts on ExxonMobil Corp. and trade efficiently with NPBFX.

NPBFX - Best ECN/STP Broker 2021 Forex Awards, Most Intelligent Fintech 2020 APAC Bus. Headlines

Re: NPBFX - making money with us since 1996!

General Electric Co.: technical analysis 14.12.2022

Good afternoon, dear forum visitors!

NPBFX offers the latest release of analytics on General Electric Co. for a better understanding of the current market situation and more efficient trading.

Shares of General Electric Co., an American multi-industry corporation, are moving within a global upward correction at 82.00.

On the daily chart, the price is within an ascending channel with dynamic boundaries 89.00–65.00 and reverses after reaching the resistance line at 88.00.

On a four-hour timeframe after reaching the resistance line, the quotes formed a Head and shoulders reversal pattern with the Neckline at 84.00, which has already begun to work out, and the downside potential is currently higher.

Technical indicators are ready to reverse and receive a sell signal: fast EMAs on the Alligator indicator have crossed each other and are approaching the signal line, while the AO oscillator histogram is forming downward bars, almost reaching the transition level.

https://i.ibb.co/WVQbfJg/ge-14122022-11.png

Trading tips

Short positions may be opened after the price drops and consolidates below 81.00 with the target at 75.00. Stop loss — 84.00. Implementation period: 7 days or more.

Long positions may be opened after the price rises and consolidates above 84.10 with the target at 88.00. Stop loss — 81.00.

Use more opportunities of the NPBFX analytical portal: weekly FOREX forecast

You can learn more about the current situation on Apple Inc. and get acquainted with the weekly analytical forecast in the "Video reviews" section on the NPBFX portal. Weekly video reviews contain trends, key levels, trading recommendations for such popular instruments as GBP/USD, EUR/USD, USD/CHF, AUD/USD. In order to get free and unlimited access to video forecast and other useful instruments on the portal, you need to register on the NPBFX website.

If you have any questions about trading instruments, you can always ask an analyst in the online chat on the portal and get a free consultation of an experienced specialist.

Use the current recommendations of analysts on General Electric Co. and trade efficiently with  NPBFX.

NPBFX - Best ECN/STP Broker 2021 Forex Awards, Most Intelligent Fintech 2020 APAC Bus. Headlines

Re: NPBFX - making money with us since 1996!

Netflix Inc.: technical analysis 16.12.2022

Good afternoon, dear forum visitors!

NPBFX offers the latest release of analytics on Netflix Inc. for a better understanding of the current market situation and more efficient trading.

Shares of Netflix Inc., an American entertainment company and movie and series streaming service, are correcting at 290.00.

On the daily chart, the price is growing within the global corridor with dynamic boundaries of 253.00–330.00, moving away from the resistance line and returning to the middle of the range.

On the four-hour chart, the price returned to the initial Fibonacci 23.6% retracement at 290.00, and upward potential eased, allowing a decline to the November 7 low at 253.00.

Technical indicators keep a global buy signal: the range of fluctuations of the EMA on the Alligator indicator is quite wide, and the histogram of the AO oscillator forms corrective bars in the buying zone.

https://i.ibb.co/jH2tCGF/nflx-16122022-33.png

Trading tips

Long positions may be opened after a reversal, growth, and price consolidation above 326.50 with the target at 367.00. Stop loss — 320.00. Implementation period: 7 days or more.

Short positions may be opened after the price drops and consolidates below 290.00 with the target at 253.00. Stop loss – 300.00.

Use more opportunities of the NPBFX analytical portal: E-book

If you just recently started to be interested in trading on FOREX and would like to deepen your knowledge, an electronic Beginner's Guide to FOREX Trading will be an excellent helper for you here. The book consists of 5 chapters and reflects fundamental concepts of the foreign exchange market to start successful trading. From the main chapters of the E-book you can learn about the concepts and history of FOREX, currencies and trend lines, technical indicators, types of orders, trading on news, psychology of trading, risk management and much more.

You can read a Beginner's guide to FOREX Trading online or download it free of charge from the NPBFX analytical portal in the "Education" section. In order to get unlimited access to the E-book and other useful instruments on the portal, you need to register on the NPBFX website.

If you have any questions about trading instruments, you can always ask an analyst in the online chat on the portal and get a free consultation of an experienced specialist.

Use the current recommendations of analysts on Netflix Inc. and trade efficiently with  NPBFX.

NPBFX - Best ECN/STP Broker 2021 Forex Awards, Most Intelligent Fintech 2020 APAC Bus. Headlines

Re: NPBFX - making money with us since 1996!

Meta Platforms Inc.: technical analysis 19.12.2022

Good afternoon, dear forum visitors!

NPBFX offers the latest release of analytics on Meta Platforms Inc. for a better understanding of the current market situation and more efficient trading.

Shares of Meta Platforms Inc., the American multinational holding company that owns the technology conglomerate and the largest social network Facebook, are moving in a corrective trend at 119.00.

On the daily chart, there is a formation of a global downtrend, within which the price, having sharply decreased, formed a price gap of 100.00–130.00 and is now trying to work it out.

The four-hour chart shows that the prospects for quotes growth are not high, and the movement is developing within the local ascending corridor with dynamic boundaries of 116.00–132.00, and the key resistance is 124.00, which market participants have already tested unsuccessfully twice.

Technical indicators confirm the likelihood of an upward correction, holding a buy signal: fast EMAs on the Alligator indicator are above the signal line, and the AO oscillator histogram forms corrective bars in the buying zone.

https://i.ibb.co/mhxvbb0/META-19122022-22.png

Trading tips

Long positions may be opened after the price rises and consolidates above 124.00 with the target at 138.00. Stop loss – 120.00. Implementation period: 7 days or more.

Short positions may be opened after a reversal, reduction, and consolidation of the price below 113.00 with the target at 100.00. Stop loss – 120.00.

Use more opportunities of the NPBFX analytical portal: analytics

You can find more actual analytical reviews on other popular currency pairs, metals and CFDs on the NPBFX online portal. Daily analytics with charts, current market prognoses and trading scenarios in the Feed section are available. Get free and unlimited access to the online portal after registering on the official website of NPBFX Company.

If you have any questions about trading instruments, you can always ask an analyst in the online chat on the portal and get a free consultation of an experienced specialist.

Use the current recommendations of analysts on Meta Platforms Inc. and trade efficiently with NPBFX.

NPBFX - Best ECN/STP Broker 2021 Forex Awards, Most Intelligent Fintech 2020 APAC Bus. Headlines

Re: NPBFX - making money with us since 1996!

XAU/USD: "bears" hold the lead in overall positions 21.12.2022

Good afternoon, dear forum visitors!

NPBFX offers the latest release of analytics on XAU/USD for a better understanding of the current market situation and more efficient trading.

Current trend

Gold prices are corrected, retreating from local highs of December 13, updated the day before. The XAU/USD pair showed a rather active growth, which was due to the strengthening of corrective moods in the US currency, which reacted negatively to the publication of statistics from the US on the housing market. Another factor in the "bullish" dynamics of the instrument was the fear of a global recession against the backdrop of tightening monetary policy by the world's leading financial regulators. Last week, the US Federal Reserve, the European Central Bank (ECB) and the Bank of England raised interest rates by 50 basis points and also indicated that they expect slower monetary tightening going forward. Meanwhile, the EU economy is close to recession, and the Bank of England, in turn, says that the process of slowdown in the UK economy has already begun.

Today, the focus of investors will be statistics from the US on the December level of Consumer Confidence and the November dynamics of Existing Home Sales. Investors will also pay attention to Canadian statistics on inflation in November: current forecasts suggest that the Consumer Price Index will slow down from 0.7% to 0.4% MoM, but accelerate in annual terms from 6.9% to 7.4%.

Meanwhile, according to the report of the US Commodity Futures Trading Commission (CFTC), last week the number of net speculative positions in gold amounted to 125.6 thousand against 115.1 thousand a week earlier. "Bears" still hold the lead in general positions among swap dealers, and their number is 203.135 thousand against 91.509 thousand for "bulls". Last week, sellers opened 13.606 thousand more deals, and buyers opened 0.122 thousand more, which indicates an increased demand for the metal.

Support and resistance

Bollinger Bands in D1 chart show moderate growth. The price range is expanding but it fails to conform to the surge of "bullish" activity at the moment. MACD indicator is growing, having formed a new buy signal (located above the signal line). Stochastic is showing similar dynamics; however, the indicator line is already approaching its highs, indicating the risks of overbought gold in the ultra-short term.

Resistance levels: 1816.62, 1828.22, 1843.37, 1857.27.
Support levels: 1800.00, 1786.28, 1765.66, 1753.09.

https://i.ibb.co/6NTGKxp/XAUUSD211222-33.png

https://i.ibb.co/ChFtVfk/XAUUSD211222-333.png

Trading tips

Long positions can be opened after a breakout of 1816.62 with the target of 1857.27. Stop-loss — 1800.00. Implementation time: 2-3 days.

A rebound from 1816.62 as from resistance, followed by a breakdown of 1800.00 may become a signal for opening of new short positions with the target at 1765.66. Stop-loss — 1816.62.

Use more opportunities of the NPBFX analytical portal: trading signals for commodities

How can a trader determine if it’s worth buying or selling XAU/USD now or better waiting for a more favorable period? Use trading signals for commodities from the top 10 technical indicators on the NPBFX portal and make the right decisions! All registered users have free and unlimited access to the minutely updated trading signals (MA10, BBands, Ichimoku, Stochastic, ZigZag, etc.) for Gold, Silver, Brent and WTI Crude oil.

If you have any questions about trading instruments, you can always ask an analyst in the online chat on the portal and get a free consultation of an experienced specialist.

Use the current recommendations of analysts on XAU/USD and trade efficiently with NPBFX.

NPBFX - Best ECN/STP Broker 2021 Forex Awards, Most Intelligent Fintech 2020 APAC Bus. Headlines

Re: NPBFX - making money with us since 1996!

NZD/USD: corrective growth at the end of the trading week 23.12.2022

Good afternoon, dear forum visitors!

NPBFX offers the latest release of analytics on NZD/USD for a better understanding of the current market situation and more efficient trading.

Current trend

The New Zealand dollar shows corrective growth, recovering from a four-day decline, as a result of which the NZD/USD pair updated local lows from November 30. The instrument is testing the level of 0.6270 for a breakout, receiving support from technical factors.

The American currency reacts positively to the data released the day before on the dynamics of the US Gross Domestic Product (GDP) for the third quarter. The revised estimate reflected economic growth of 3.2% against the previous 2.9%. At the same time, the number of Initial Jobless Claims for the week of December 16 increased from 214.0 thousand to 216.0 thousand, contrary to forecasts of an increase to 222.0 thousand, and Continuing Jobless Claims adjusted from 1.678 million to 1.672 million, while market forecasts suggested an increase to 1.683 million.

Investors' attention today is focused on macroeconomic statistics from the US. The most important among the publications will be data on the dynamics of Durable Goods Orders, as well as statistics on Personal Income and Spending. Forecasts suggest that in November Personal Income will slow down from 0.7% to 0.2%, while Durable Goods Orders could show a 0.6% decline after rising 1.1% the previous month.

Support and resistance

In the D1 chart, Bollinger Bands are reversing horizontally. The price range is expanding, but has not yet caught up with the surge of "bearish" activity. MACD is falling, keeping a relatively strong sell signal (the histogram is below the signal line). Stochastic, having approached its lows is reversing into a side channel, signaling in favor of the development of corrective dynamics in the near future.

Resistance levels: 0.6288, 0.6350, 0.6400, 0.6450.
Support levels: 0.6250, 0.6200, 0.6155, 0.6100.

https://i.ibb.co/JQcdSrR/NZDUSD-231222-33.png

https://i.ibb.co/crjTQYX/NZDUSD-231222-333.png

Trading tips

Long positions can be opened after a breakout of 0.6288 with the target of 0.6350. Stop-loss — 0.6250. Implementation time: 1-2 days.

A rebound from 0.6288 as from resistance, followed by a breakdown of 0.6250 may become a signal for opening of new short positions with the target at 0.6155. Stop-loss — 0.6300.

Use more opportunities of the NPBFX analytical portal: analytics

You can find more actual analytical reviews on other popular currency pairs, metals and CFDs on the NPBFX online portal. Daily analytics with charts, current market prognoses and trading scenarios in the Feed section are available. Get free and unlimited access to the online portal after registering on the official website of NPBFX Company.

If you have any questions about trading instruments, you can always ask an analyst in the online chat on the portal and get a free consultation of an experienced specialist.

Use the current recommendations of analysts on NZD/USD and trade efficiently with NPBFX.

NPBFX - Best ECN/STP Broker 2021 Forex Awards, Most Intelligent Fintech 2020 APAC Bus. Headlines

882 (edited by Antony_NPBFX 2022-12-28 09:01:59)

Re: NPBFX - making money with us since 1996!

Alphabet Inc.: technical analysis 28.12.2022

Good afternoon, dear forum visitors!

NPBFX offers the latest release of analytics on Alphabet Inc. for a better understanding of the current market situation and more efficient trading.

Shares of the American holding company Alphabet Inc. are moving within the global corrective trend at 88.00.

On the daily chart, there is a formation of a global downward channel with dynamic boundaries at 94.00–85.00, within which the price is falling along the support line.

On the four-hour chart, it can be seen that the downward movement has a high potential for continuation, as the quotes are close to the local low of yesterday's trading at 86.90, consolidation below which practically guarantees further decline and renewal of the low around 83.00.

Technical indicators hold a sell signal: fast EMAs on the Alligator indicator are below the signal line, and the AO oscillator histogram is trading below the transition level, forming downward bars.

https://i.ibb.co/qCq2cSw/GOOG-28122022-11.png

Trading tips

Short positions may be opened after the price drops and consolidates below 86.90 with the target at 83.50. Stop loss – 88.80. Implementation period: 7 days or more.

Long positions may be opened after a reversal, growth and price consolidation above 89.20 with the target at 92.20. Stop loss — 88.00.

Use more opportunities of the NPBFX analytical portal: E-book

If you just recently started to be interested in trading on FOREX and would like to deepen your knowledge, an electronic Beginner's Guide to FOREX Trading will be an excellent helper for you here. The book consists of 5 chapters and reflects fundamental concepts of the foreign exchange market to start successful trading. From the main chapters of the E-book you can learn about the concepts and history of FOREX, currencies and trend lines, technical indicators, types of orders, trading on news, psychology of trading, risk management and much more.

You can read a Beginner's guide to FOREX Trading online or download it free of charge from the NPBFX analytical portal in the "Education" section. In order to get unlimited access to the E-book and other useful instruments on the portal, you need to register on the NPBFX website.

If you have any questions about trading instruments, you can always ask an analyst in the online chat on the portal and get a free consultation of an experienced specialist.

Use the current recommendations of analysts on Alphabet Inc. and trade efficiently with  NPBFX.

NPBFX - Best ECN/STP Broker 2021 Forex Awards, Most Intelligent Fintech 2020 APAC Bus. Headlines

Re: NPBFX - making money with us since 1996!

eBay Inc.: technical analysis 30.12.2022

Good afternoon, dear forum visitors!

NPBFX offers the latest release of analytics on eBay Inc. for a better understanding of the current market situation and more efficient trading.

Stocks of the American Internet retailing company eBay Inc. are correcting around 42.00.

On the daily chart, the price is holding above the resistance line of the global downwards channel with dynamic boundaries at 40.00–30.00, and after the expected retest, it reverses upwards.

On the four-hour chart, a local correction is still developing within the Flag trend continuation pattern, and after consolidation pf the price above 43.00, the global growth can continue until reaching the target resistance of 47.00.

Technical indicators are ready to turn around and give a buy signal: fast EMAs on the Alligator indicator are consolidated below the signal line, and the AO oscillator histogram, being in the sell zone, forms corrective bars.

https://i.ibb.co/XDt52s0/EBAY-301222-11.png

Trading tips

Long positions may be opened after the consolidation above the local resistance level of 43.00 with the target at 47.00 and stop loss 41.00. Implementation period: 7 days or more.

Short positions may be opened after the consolidation below 40.30 to reach the global support around 36.00. Stop loss is below the current price, around 41.50.

Use more opportunities of the NPBFX analytical portal: analytics

You can find more actual analytical reviews on other popular currency pairs, metals and CFDs on the NPBFX online portal. Daily analytics with charts, current market prognoses and trading scenarios in the Feed section are available. Get free and unlimited access to the online portal after registering on the official website of NPBFX Company.

If you have any questions about trading instruments, you can always ask an analyst in the online chat on the portal and get a free consultation of an experienced specialist.

Use the current recommendations of analysts on eBay Inc. and trade efficiently with NPBFX.

NPBFX - Best ECN/STP Broker 2021 Forex Awards, Most Intelligent Fintech 2020 APAC Bus. Headlines

Re: NPBFX - making money with us since 1996!

NZD/USD: the instrument updated November lows 04.01.2023

Good afternoon, dear forum visitors!

NPBFX offers the latest release of analytics on NZD/USD for a better understanding of the current market situation and more efficient trading.

Current trend

The New Zealand dollar shows moderate growth during the Asian session, correcting after a noticeable decline the day before, as a result of which the NZD/USD pair updated local lows from November 30. At the moment, the instrument is testing the level of 0.6260 for a breakout, and activity in the market is slowing down a little ahead of the publication of the minutes of the December meeting of the US Federal Reserve and the final report on the national labor market, which will be presented at the end of the week.

In turn, the New Zealand dollar was under pressure after the publication of weak macroeconomic statistics the day before. The Dairy Price Index fell 2.8% in December after falling 3.8% in the previous month, although analysts had expected a positive trend of 0.6%. Investors were also disappointed by data from China, where the index of business activity in the manufacturing sector from Caixin in December showed a decline from 49.4 points to 49.0 points, which, however, was better than preliminary estimates of 48.8 points. The Chinese economy continues to generate some rather troubling signals, in part due to new spikes in COVID-19 cases after a series of restrictive measures were lifted. It is possible that its recovery may take a little longer than originally predicted.

Support and resistance

On the daily chart, Bollinger Bands are moderately declining. The price range is narrowing, reflecting the emergence of ambiguous dynamics of trading in the short term. MACD is falling, maintaining a relatively strong sell signal and being below the signal line, close to the zero level. Stochastic signals in favor of further development of "bearish" dynamics in the near future.

Resistance levels: 0.6288, 0.6350, 0.6400, 0.6450.
Support levels: 0.6250, 0.6200, 0.6155, 0.6100.

https://i.ibb.co/QpPb609/NZDUSD040123-33.png

https://i.ibb.co/JCf42pM/NZDUSD040123-333.png

Trading tips

Long positions can be opened after a breakout of 0.6288 with the target of 0.6400. Stop-loss — 0.6225. Implementation time: 1-2 days.

A rebound from 0.6288 as from resistance, followed by a breakdown of 0.6250 may become a signal for opening of short positions with the target at 0.6155. Stop-loss — 0.6300.

Use more opportunities of the NPBFX analytical portal: economic calendar

Be ready for any market changes through global events using the economic calendar on the NPBFX portal. The calendar contains all the most important events of the world economy and prognoses for them. In order to get free and unlimited access to the economic calendar and other useful instruments on the portal, you need to pass a one-time registration on the NPBFX website.

If you have any questions about trading instruments, you can always ask an analyst in the online chat on the portal and get a free consultation of an experienced specialist.

Use the current recommendations of analysts on NZD/USD and trade efficiently with NPBFX.

NPBFX - Best ECN/STP Broker 2021 Forex Awards, Most Intelligent Fintech 2020 APAC Bus. Headlines

Re: NPBFX - making money with us since 1996!

Bank of America Corp.: technical analysis 06.01.2023

Good afternoon, dear forum visitors!

NPBFX offers the latest release of analytics on Bank of America Corp. for a better understanding of the current market situation and more efficient trading.

Shares of Bank of America Corp., the largest financial conglomerate in the US, are moving within a corrective trend at 34.00.

On the daily chart, the price is within the global Expanding formation pattern with the boundaries of 28.00–40.00, developing another downward wave.

The four-hour chart shows that the current wave is the fourth within the pattern, which practically guarantees that it will reach last year's low at 29.30. The local growth prospects are not high, as the resistance level at 35.00 looks quite solid.

Technical indicators keep a sell signal: fast EMAs on the Alligator indicator are below the signal line, and the AO oscillator histogram is forming new bars in the sell zone.

https://i.ibb.co/y6mhQ0Y/BAC-060123-11.png

Trading tips

Short positions may be opened after the price drops and consolidates below 33.00 with the target at 29.70. Stop loss — 34.00. Implementation period: 7 days or more.

Long positions may be opened after the price rises and consolidates above 34.80 with the target at 38.00. Stop loss — 33.00.

Use more opportunities of the NPBFX analytical portal: analytics

You can find more actual analytical reviews on other popular currency pairs, metals and CFDs on the NPBFX online portal. Daily analytics with charts, current market prognoses and trading scenarios in the Feed section are available. Get free and unlimited access to the online portal after registering on the official website of NPBFX Company.

If you have any questions about trading instruments, you can always ask an analyst in the online chat on the portal and get a free consultation of an experienced specialist.

Use the current recommendations of analysts on Bank of America Corp. and trade efficiently with NPBFX.

NPBFX - Best ECN/STP Broker 2021 Forex Awards, Most Intelligent Fintech 2020 APAC Bus. Headlines

Re: NPBFX - making money with us since 1996!

NZD/USD: the instrument develops corrective growth 09.01.2023 

Good afternoon, dear forum visitors!

NPBFX offers the latest release of analytics on NZD/USD for a better understanding of the current market situation and more efficient trading.

Current trend

The New Zealand dollar shows steady growth during the Asian session, updating local highs from December 19. The NZD/USD pair is testing 0.6400 for a breakout, and investors continue to actively sell the American currency after the publication of statistics on the US labor market last Friday. In December, the American economy created 223.0 thousand new jobs, which turned out to be 23.0 thousand better than analysts' forecasts, while the Unemployment Rate fell from 3.6% to 3.5%, contrary to forecasts of growth to 3.7%. Hourly Earnings in annual terms slowed down from 4.8% to 4.6%, while analysts expected it to accelerate to 5.0%, and in monthly terms the indicator slowed down from 0.4% to 0.3%. Investors expect that the released data will push the US Federal Reserve to soon ease monetary policy.

Earlier, the regulator announced its readiness to raise the interest rate one or two more times in the range of 25-50 basis points at the beginning of 2023, after which it will probably take a wait-and-see attitude. At the same time, the latest minutes of the US Federal Reserve indicated the unwillingness of board members to consider a scenario with a decrease in the rate this year.

Support and resistance

Bollinger Bands in D1 chart demonstrate flat dynamics. The price range is slightly expanding from above; however, it has not kept up with the "bullish" activity on Friday and Monday. MACD has reversed to growth having formed a new buy signal (located above the signal line). Stochastic grows more steadily but is rapidly approaching its highs, which reflects risks of the overbought New Zealand dollar in the ultra-short term.

Resistance levels: 0.6400, 0.6450, 0.6500, 0.6535.
Support levels: 0.6350, 0.6288, 0.6250, 0.6200.

https://i.ibb.co/wJ8Fcmg/NZDUSD-090123-33.png

https://i.ibb.co/JjCCTb2/NZDUSD-090123-333.png

Trading tips

Long positions can be opened after a breakout of 0.6400 with the target of 0.6500. Stop-loss — 0.6350. Implementation time: 1-2 days.

A rebound from 0.6400 as from resistance, followed by a breakdown of 0.6350 may become a signal for opening of new short positions with the target at 0.6250. Stop-loss — 0.6400.

Use more opportunities of the NPBFX analytical portal: economic calendar

Be ready for any market changes through global events using the economic calendar on the NPBFX portal. The calendar contains all the most important events of the world economy and prognoses for them. In order to get free and unlimited access to the economic calendar and other useful instruments on the portal, you need to pass a one-time registration on the NPBFX website.

If you have any questions about trading instruments, you can always ask an analyst in the online chat on the portal and get a free consultation of an experienced specialist.

Use the current recommendations of analysts on NZD/USD and trade efficiently with NPBFX.

NPBFX - Best ECN/STP Broker 2021 Forex Awards, Most Intelligent Fintech 2020 APAC Bus. Headlines

Re: NPBFX - making money with us since 1996!

WTI Crude Oil: "black gold" quotes are held around 74.50 11.01.2023

Good afternoon, dear forum visitors!

NPBFX offers the latest release of analytics on WTI Crude Oil for a better understanding of the current market situation and more efficient trading.

Current trend

During the Asian session, prices for WTI Crude Oil are slightly reduced, consolidating near 74.85.

Investors are cautious and wait to open new trading positions before publishing key US statistics on consumer inflation for December. The indicator is expected to slow down the negative dynamics from 7.1% to 6.5%, in which case the US Federal Reserve is likely to decide to raise interest rates in February by only 25.0 basis points, after which a pause in tightening monetary policy is possible.

The pressure on oil quotes was exerted by the statements of the US Department of Energy, which raised the forecast for the average energy production in the country for 2023 by 70.0K barrels to 12.41M barrels, while demand expectations for it decreased to 100.48M barrels despite signs of a recovery in China. For the week of January 6, the report of the American Petroleum Institute (API) on oil reserves showed a sharp increase of 14.865M barrels after an increase of 3.298M barrels earlier, and today experts expect the publication of relevant data from the Energy Information Administration of the US Department of Energy (EIA): forecasts suggest a decline in the value of 2.375M barrels after an increase of 1.694M barrels over the past week.

According to Bloomberg, the Russian authorities are forced to sell Urals crude at prices almost twice lower the world's prices. For example, at the end of last week in the port of Primorsk, a Russian barrel cost 37.80 dollars compared to Brent Crude Oil for 78.57 dollars against the backdrop of a ban on energy supplies from Russia in response to the escalation of the military conflict on the territory of Ukraine. The negative trend may prompt official Moscow to reduce oil production, as it becomes increasingly difficult to compete with supplies from the Middle East due to the increased cost of freight tankers to deliver energy from Western Russian ports.

Support and resistance

On the daily chart, Bollinger bands are moving flat: the price range is slightly expanding from below, remaining quite spacious for the current market activity level. The MACD indicator shows uncertain growth, keeping a poor buy signal (the histogram is above the signal line). Stochastic is strengthening, quickly retreating from its lows.

Resistance levels: 75.00, 76.00, 77.00, 78.00.
Support levels: 74.00, 72.59, 71.00, 70.00.

https://i.ibb.co/vZrP5QW/WTI-Crude-Oil-11012023-33.png

https://i.ibb.co/CMxJ7yg/WTI-Crude-Oil-11012023-333.png

Trading tips

Short positions may be opened after the breakdown of 74.00 with the target at 72.00. Stop loss — 75.00. Implementation period: 2–3 days.

Long positions may be opened after a rebound from 74.00 and the breakdown of 75.00 with the target at 77.00. Stop loss — 74.00.

Use more opportunities of the NPBFX analytical portal: trading signals for commodities

How can a trader determine if it’s worth buying or selling WTI Crude Oil now or better waiting for a more favorable period? Use trading signals for commodities from the top 10 technical indicators on the NPBFX portal and make the right decisions! All registered users have free and unlimited access to the minutely updated trading signals (MA10, BBands, Ichimoku, Stochastic, ZigZag, etc.) for Gold, Silver, Brent and WTI Crude oil.

If you have any questions about trading instruments, you can always ask an analyst in the online chat on the portal and get a free consultation of an experienced specialist.

Use the current recommendations of analysts on WTI Crude Oil and trade efficiently with NPBFX.

NPBFX - Best ECN/STP Broker 2021 Forex Awards, Most Intelligent Fintech 2020 APAC Bus. Headlines

888 (edited by Antony_NPBFX 2023-01-13 08:45:18)

Re: NPBFX - making money with us since 1996!

EUR/USD: consolidation near spring 2022 highs 13.01.2023

Good afternoon, dear forum visitors!

NPBFX offers the latest release of analytics on EUR/USD for a better understanding of the current market situation and more efficient trading.

Current trend

The EUR/USD pair shows flat dynamics during the Asian session, consolidating near 1.0850 and local highs from April 21, 2022. Trading activity remains quite low, while analysts expect a large number of publications of macroeconomic indicators.

The day before, the single currency showed strong growth in response to the release of data on inflation dynamics in the US. In December, the Consumer Price Index slowed down from 7.1% to 6.5% in annual terms, and in monthly terms it corrected from 0.1% to -0.1%. In turn, the CPI excluding Food and Energy added 0.3% in monthly terms and 5.7% in annual terms. Thus, traders strengthened their belief that in the near future the US Federal Reserve will continue to reduce the pace of interest rate increases and will adjust the value by only 25 basis points at its meeting on January 31.

In addition, the focus of investors is statistics on the dynamics of Industrial Production in the eurozone in November, as well as consumer inflation in Spain and France in December, where current forecasts do not suggest changes.

Support and resistance

Bollinger Bands on the daily chart show a steady increase. The price range is expanding, but it fails to catch the development of "bullish" activity this week. MACD indicator is growing preserving a stable buy signal (located above the signal line). Stochastic, having reached its highs, reverses into a horizontal plane, indicating overbought euro in the ultra-short term.

Resistance levels: 1.0850, 1.0900, 1.0957, 1.1000.
Support levels: 1.0800, 1.0759, 1.0700, 1.0657.

https://i.ibb.co/fvD3s34/EURUSD130123-33.png

https://i.ibb.co/9Z0yWd0/EURUSD130123-333.png

Trading tips

Long positions can be opened after a breakout of 1.0900 with the target of 1.1000. Stop-loss — 1.0850. Implementation time: 1-2 days.

A rebound from 1.0850 as from resistance, followed by a breakdown of 1.0800 may become a signal for opening of new short positions with the target at 1.0700. Stop-loss — 1.0850.

Use more opportunities of the NPBFX analytical portal: weekly FOREX forecast

You can learn more about the current situation and get acquainted with the weekly analytical forecast in the "Video reviews" section on the NPBFX portal. Weekly video reviews contain trends, key levels, trading recommendations for such popular instruments as GBP/USD, EUR/USD, USD/CHF, AUD/USD. In order to get free and unlimited access to video forecast and other useful instruments on the portal, you need to register on the NPBFX website.

If you have any questions about trading instruments, you can always ask an analyst in the online chat on the portal and get a free consultation of an experienced specialist.

Use the current recommendations of analysts on EUR/USD and trade efficiently with  NPBFX.

NPBFX - Best ECN/STP Broker 2021 Forex Awards, Most Intelligent Fintech 2020 APAC Bus. Headlines

889 (edited by Antony_NPBFX 2023-01-16 08:42:09)

Re: NPBFX - making money with us since 1996!

PayPal Holdings Inc.: technical analysis 16.01.2023

NPBFX offers the latest release of analytics on PayPal Holdings Inc. for a better understanding of the current market situation and more efficient trading.

Shares of PayPal Holdings Inc., an American debit payment processor, are correcting at 79.00.

On the daily chart, the price moves within a global corrective trend and forms a narrow downward channel with dynamic boundaries at 80.00–64.00, retreating from the year’s low of 66.20.

On the four-hour chart, the key obstacle for the upward wave is the resistance line at 80.00, the breakout of which allows the quotes to grow. However, after a reversal, the decline may continue to the year’s low of 66.20.

Technical indicators keep a stable buy signal: fast EMAs on the Alligator indicator are above the signal line, and the AO oscillator histogram forms rising bars in the buying zone.

https://i.ibb.co/YN097ft/PYPL16012023-22.png

Trading tips

Long positions may be opened after the price rises and consolidates above 83.20 with the target at 98.00. Stop loss — 80.00. Implementation period: 7 days or more.

Short positions may be opened after a reversal, reduction, and consolidation of the price below 74.70 with the target at 66.20. Stop loss — 77.00.

Use more opportunities of the NPBFX analytical portal: analytics

You can find more actual analytical reviews on other popular currency pairs, metals and CFDs on the NPBFX online portal. Daily analytics with charts, current market prognoses and trading scenarios in the Feed section are available. Get free and unlimited access to the online portal after registering on the official website of NPBFX Company.

If you have any questions about trading instruments, you can always ask an analyst in the online chat on the portal and get a free consultation of an experienced specialist.

Use the current recommendations of analysts on PayPal Holdings Inc. and trade efficiently with  NPBFX.

NPBFX - Best ECN/STP Broker 2021 Forex Awards, Most Intelligent Fintech 2020 APAC Bus. Headlines

Re: NPBFX - making money with us since 1996!

Microsoft Corp.: technical analysis 18.01.2023

Good afternoon, dear forum visitors!

NPBFX offers the latest release of analytics on Microsoft Corp. for a better understanding of the current market situation and more efficient trading.

Shares of Microsoft Corp., a global giant in the development and sale of operating systems and software for computers, are moving within a corrective trend at 240.00.

On the daily chart, the price is trying to consolidate within the uptrend and slightly increases within the corridor with dynamic boundaries 224.00–270.00.

On the four-hour chart, it is clear that the quotes failed to break the year's low of 214.00, and the "bullish" impulse entered them into the boundaries of the ascending channel. Growth prospects prevail, and consolidation above the local resistance level around 245.00 will further strengthen them.

Technical indicators confirm the possibility: the range of EMA fluctuations on the Alligator indicator is ready to expand upwards, and the histogram of the AO oscillator forms upward bars, rising in the sell zone.

https://i.ibb.co/PtwQzFY/MSFT180123-22.png

Trading tips

Long positions may be opened after a reversal, growth, and consolidation of the price above 245.80, with the target at 263.80. Stop loss – 240.00. Implementation period: 7 days or more.

Short positions may be opened after a reversal, reduction, and consolidation of the price below 232.90 with the target at 214.30. Stop loss – 238.00.

Use more opportunities of the NPBFX analytical portal: E-book

If you just recently started to be interested in trading on FOREX and would like to deepen your knowledge, an electronic Beginner's Guide to FOREX Trading will be an excellent helper for you here. The book consists of 5 chapters and reflects fundamental concepts of the foreign exchange market to start successful trading. From the main chapters of the E-book you can learn about the concepts and history of FOREX, currencies and trend lines, technical indicators, types of orders, trading on news, psychology of trading, risk management and much more.

You can read a Beginner's guide to FOREX Trading online or download it free of charge from the NPBFX analytical portal in the "Education" section. In order to get unlimited access to the E-book and other useful instruments on the portal, you need to register on the NPBFX website.

If you have any questions about trading instruments, you can always ask an analyst in the online chat on the portal and get a free consultation of an experienced specialist.

Use the current recommendations of analysts on Microsoft Corp. and trade efficiently with  NPBFX.

NPBFX - Best ECN/STP Broker 2021 Forex Awards, Most Intelligent Fintech 2020 APAC Bus. Headlines

Re: NPBFX - making money with us since 1996!

AUD/USD: the Australian dollar consolidates after two-day decline 20.01.2023

Good afternoon, dear forum visitors!

NPBFX offers the latest release of analytics on AUD/USD for a better understanding of the current market situation and more efficient trading.

Current trend

The AUD/USD pair shows mixed trading dynamics, trying to recover from a two-day decline, as a result of which it retreated from its local highs from August 15. The instrument is trading near the level of 0.6915, strengthening against the backdrop of the development of technical factors and the publication of statistical data from the US.

Significant pressure on the AUD/USD pair was exerted by the December report on the labor market of Australia, released the day before: the Employment Change decreased by 14.6 thousand, while analysts expected an increase of 22.5 thousand and in the previous month the figure was 58.3 thousand. In turn, the Unemployment Rate increased to 3.5%, although the November data was also revised from 3.4% to 3.5%. Participation Rate decreased from 66.8% to 66.6%. The national labor market continues to be under pressure from the increase in the interest rate by the Reserve Bank of Australia (RBA), which has already increased it by 300 basis points since April 2022, and is likely to continue to tighten monetary policy, as high rates of price growth in the country remain. Investors also drew attention to publications from the Melbourne Institute, reflecting an increase in Consumer Inflation Expectations in January from 5.2% to 5.6%.

Support and resistance

Bollinger Bands in D1 chart show quite active growth. The price range is rapidly narrowing, reflecting the emergence of downward momentum in the ultra-short term. MACD is falling, keeping a relatively strong sell signal (the histogram is below the signal line). Stochastic shows a more confident decline, but at the moment it is rapidly approaching its lows, indicating risks of the Australian currency being oversold in the ultra-short term.

Resistance levels: 0.6950, 0.7000, 0.7050, 0.7100.
Support levels: 0.6900, 0.6850, 0.6800, 0.6750.

https://i.ibb.co/HB3JLGK/AUDUSD200123-33.png

https://i.ibb.co/ydps3m5/AUDUSD200123-333.png

Trading tips

Long positions can be opened after a breakout of 0.6950 with the target of 0.7050. Stop-loss — 0.6900. Implementation time: 2-3 days.

A rebound from 0.6950 as from resistance, followed by a breakdown of 0.6900 may become a signal for opening of new short positions with the target at 0.6800. Stop-loss — 0.6950.

Use more opportunities of the NPBFX analytical portal: weekly FOREX forecast

You can learn more about the current situation and get acquainted with the weekly analytical forecast in the "Video reviews" section on the NPBFX portal. Weekly video reviews contain trends, key levels, trading recommendations for such popular instruments as GBP/USD, EUR/USD, USD/CHF, AUD/USD. In order to get free and unlimited access to video forecast and other useful instruments on the portal, you need to register on the NPBFX website.

If you have any questions about trading instruments, you can always ask an analyst in the online chat on the portal and get a free consultation of an experienced specialist.

Use the current recommendations of analysts on AUD/USD and trade efficiently with  NPBFX.

NPBFX - Best ECN/STP Broker 2021 Forex Awards, Most Intelligent Fintech 2020 APAC Bus. Headlines

Re: NPBFX - making money with us since 1996!

Johnson & Johnson: technical analysis 23.01.2023

Good afternoon, dear forum visitors!

NPBFX offers the latest release of analytics on Johnson & Johnson for a better understanding of the current market situation and more efficient trading.

Shares of Johnson & Johnson, one of the world's leading retail holdings, are trading at 168.00.

On the daily chart, the price is working out a local Head and shoulders reversal pattern with the Neckline at 175.00.

On the four-hour chart, it can be seen that the target to realize the formation, which is at 167.00, has already been almost reached, but the potential for downward dynamics remains high, and if it is broken, the decline may continue to last year's low at 159.00.

Technical indicators keep a stable sell signal: the EMA fluctuation range on the Alligator indicator expands downwards, and the AO histogram forms downward bars, moving away from the transition level.

https://i.ibb.co/bQKKrqr/JNJ230123-11.png

Trading tips

Short positions may be opened after the price drops and consolidates below 167.00 with the target at 159.00. Stop loss – 172.00. Implementation period: 7 days or more.

Long positions may be opened after a reversal, growth, and consolidation of the price above 171.00 with the target at 175.00. Stop loss – 169.00.

Use more opportunities of the NPBFX analytical portal: E-book

If you just recently started to be interested in trading on FOREX and would like to deepen your knowledge, an electronic Beginner's Guide to FOREX Trading will be an excellent helper for you here. The book consists of 5 chapters and reflects fundamental concepts of the foreign exchange market to start successful trading. From the main chapters of the E-book you can learn about the concepts and history of FOREX, currencies and trend lines, technical indicators, types of orders, trading on news, psychology of trading, risk management and much more.

You can read a Beginner's guide to FOREX Trading online or download it free of charge from the NPBFX analytical portal in the "Education" section. In order to get unlimited access to the E-book and other useful instruments on the portal, you need to register on the NPBFX website.

If you have any questions about trading instruments, you can always ask an analyst in the online chat on the portal and get a free consultation of an experienced specialist.

Use the current recommendations of analysts on Johnson & Johnson and trade efficiently with  NPBFX.

NPBFX - Best ECN/STP Broker 2021 Forex Awards, Most Intelligent Fintech 2020 APAC Bus. Headlines

Re: NPBFX - making money with us since 1996!

ExxonMobil Corp.: technical analysis 25.01.2023

Good afternoon, dear forum visitors!

NPBFX offers the latest release of analytics on ExxonMobil Corp. for a better understanding of the current market situation and more efficient trading.

Shares of ExxonMobil Corp., a US oil company, are trading at 113.00.

A global uptrend is forming on the daily chart, and at the moment, the price is rising within the local corridor with dynamic boundaries of 118.00–111.00.

The four-hour chart of the asset shows that this range can work as a Flag trend continuation pattern. If the quotes consolidate above the local high of 114.70, the dynamics will continue to 120.00, and the decline will continue when 111.50 is broken.

Technical indicators are finishing working out a local correction, holding a global buy signal: fast EMAs on the Alligator indicator are at a sufficient distance from the signal line, and the AO oscillator histogram forms ambiguous bars in the buying zone.

https://i.ibb.co/sqXcdsq/XOM250123-22.png

Trading tips

Long positions may be opened after the price rises and consolidates above 114.70 with the target at 120.00. Stop loss – 111.00. Implementation period: 7 days or more.

Short positions may be opened after a reversal, reduction, and consolidation of the price below 111.50 with the target at 104.20. Stop loss – 114.00.

Use more opportunities of the NPBFX analytical portal: analytics

You can find more actual analytical reviews on other popular currency pairs, metals and CFDs on the NPBFX online portal. Daily analytics with charts, current market prognoses and trading scenarios in the Feed section are available. Get free and unlimited access to the online portal after registering on the official website of NPBFX Company.

If you have any questions about trading instruments, you can always ask an analyst in the online chat on the portal and get a free consultation of an experienced specialist.

Use the current recommendations of analysts on ExxonMobil Corp. and trade efficiently with NPBFX.

NPBFX - Best ECN/STP Broker 2021 Forex Awards, Most Intelligent Fintech 2020 APAC Bus. Headlines

Re: NPBFX - making money with us since 1996!

Alcoa Corp.: technical analysis 27.01.2023

Good afternoon, dear forum visitors!

NPBFX offers the latest release of analytics on Alcoa Corp. for a better understanding of the current market situation and more efficient trading.

The shares of Alcoa Corp., one of the world's largest aluminum producers, are correcting at 52.00.

On the daily chart, the price moves within a global downtrend, rising within the local corridor with dynamic boundaries of 45.00–60.00.

The four-hour chart shows that an upward wave has recently formed inside the range, and a correction is developing. Despite the local decline, the quotes are kept above the initial correction of 23.6% Fibonacci around 48.80, not excluding the development of upward dynamics after the consolidation above the basic correction of 38.2% around 58.20.

Technical indicators do not rule out a decline: the EMA fluctuation range on the Alligator indicator is directed upwards, and the AO histogram forms corrective bars in the buying zone.

https://i.ibb.co/3dgjN65/AA270123-22.png

Trading tips

Long positions may be opened after a reversal, growth, and price consolidation above 58.20 with the target at 65.80. Stop loss — 55.00. Implementation period: 7 days or more.

Short positions may be opened after the price drops and consolidates below 48.80 with the target at 41.80. Stop loss — 51.00.

Use more opportunities of the NPBFX analytical portal: E-book

If you just recently started to be interested in trading on FOREX and would like to deepen your knowledge, an electronic Beginner's Guide to FOREX Trading will be an excellent helper for you here. The book consists of 5 chapters and reflects fundamental concepts of the foreign exchange market to start successful trading. From the main chapters of the E-book you can learn about the concepts and history of FOREX, currencies and trend lines, technical indicators, types of orders, trading on news, psychology of trading, risk management and much more.

You can read a Beginner's guide to FOREX Trading online or download it free of charge from the NPBFX analytical portal in the "Education" section. In order to get unlimited access to the E-book and other useful instruments on the portal, you need to register on the NPBFX website.

If you have any questions about trading instruments, you can always ask an analyst in the online chat on the portal and get a free consultation of an experienced specialist.

Use the current recommendations of analysts on Alcoa Corp. and trade efficiently with  NPBFX.

NPBFX - Best ECN/STP Broker 2021 Forex Awards, Most Intelligent Fintech 2020 APAC Bus. Headlines

Re: NPBFX - making money with us since 1996!

EUR/USD: the euro retreats from its record highs 30.01.2023 

Good afternoon, dear forum visitors!

NPBFX offers the latest release of analytics on EUR/USD for a better understanding of the current market situation and more efficient trading.

Current trend

The EUR/USD pair shows flat trading dynamics, being held near 1.0875. The instrument is consolidating after falling for two sessions in a row, as a result of which it retreated from its record highs in April. Trading activity at the beginning of the new week remains quite low, as investors expect the publication of macroeconomic statistics from Germany and the eurozone.

Today, the first estimate of the Gross Domestic Product (GDP) of Germany for the fourth quarter of 2022 will be presented. Forecasts assume the emergence of zero dynamics after an increase of 0.4% in quarterly terms, and in annual terms, the growth rate of the German economy may slow down from 1.2% to 1.1%. Also during the day, statistics on the level of Consumer Confidence and Sentiment in the eurozone economy in January is expected to be released. Analysts suggest a moderate decline in Business Sentiment from 95.8 points to 94.6 points.

Tomorrow, the eurozone will publish statistics on the dynamics of Gross Domestic Product (GDP) for the fourth quarter of 2022, and Germany will release data on Retail Sales for December and on Consumer Price Index, which may accelerate in January from 8.6% to 9.0%.

Support and resistance

Bollinger Bands in D1 chart show moderate growth. The price range is narrowing, reflecting the emergence of ambiguous dynamics of trading in the short term. MACD is falling, having formed a relatively strong sell signal (the histogram is below the signal line). Stochastic is showing similar dynamics, having rebounded from the level of "80" downwards. The indicator signals in favor of the development of corrective dynamics in the ultra-short term.

Resistance levels: 1.0928, 1.1000, 1.1051, 1.1100.
Support levels: 1.0850, 1.0800, 1.0759, 1.0700.

https://i.ibb.co/TtbP58q/eurusd-30012023-55.png

https://i.ibb.co/qWDbjvP/eurusd-30012023-66.png

Trading tips

Short positions may be opened after a breakdown of 1.0850 with the target at 1.0759. Stop-loss — 1.0900. Implementation time: 1-2 days.

A rebound from 1.0850 as from support followed by a breakout of 1.0928 may become a signal for opening new long positions with the target at 1.1051. Stop-loss — 1.0870.

Use more opportunities of the NPBFX analytical portal: economic calendar

Be ready for any market changes through global events using the economic calendar on the NPBFX portal. The calendar contains all the most important events of the world economy and prognoses for them. In order to get free and unlimited access to the economic calendar and other useful instruments on the portal, you need to pass a one-time registration on the NPBFX website.

If you have any questions about trading instruments, you can always ask an analyst in the online chat on the portal and get a free consultation of an experienced specialist.

Use the current recommendations of analysts on EUR/USD and trade efficiently with NPBFX.

NPBFX - Best ECN/STP Broker 2021 Forex Awards, Most Intelligent Fintech 2020 APAC Bus. Headlines

Re: NPBFX - making money with us since 1996!

General Electric Co.: technical analysis 01.02.2023

Good afternoon, dear forum visitors!

NPBFX offers the latest release of analytics on General Electric Co. for a better understanding of the current market situation and more efficient trading.

The shares of General Electric Co., an American diversified corporation, are strengthening the global correction, trading around 80.00.

On the daily chart, the quotes are kept within the global ascending channel with dynamic boundaries 92.00–69.00, and after closing the price gap, they are getting ready for growth.

On the four-hour chart, the upward movement in the asset prevails, and consolidation above the current local high of 83.00 will mean the development of positive dynamics towards the last year's high of 88.00.

Technical indicators reinforce the buy signal: fast EMAs on the Alligator indicator are above the signal line, expanding the range of fluctuations, and the AO histogram forms rising bars in the buying zone.

https://s1.hostingkartinok.com/uploads/images/2023/02/91e14c9f8c2c29bd908fb4e3e9a165eb.png

Trading tips

Long positions may be opened after the price rises and consolidates above 83.00 with the target at 88.00. Stop loss — 81.00. Implementation period: 7 days or more.

Short positions may be opened after the price drops and consolidates below 77.00 with the target at 71.00. Stop loss — 80.00.

Use more opportunities of the NPBFX analytical portal: weekly FOREX forecast

You can learn more about the current situation and get acquainted with the weekly analytical forecast in the "Video reviews" section on the NPBFX portal. Weekly video reviews contain trends, key levels, trading recommendations for such popular instruments as GBP/USD, EUR/USD, USD/CHF, AUD/USD. In order to get free and unlimited access to video forecast and other useful instruments on the portal, you need to register on the NPBFX website.

If you have any questions about trading instruments, you can always ask an analyst in the online chat on the portal and get a free consultation of an experienced specialist.

Use the current recommendations of analysts on General Electric Co. and trade efficiently with  NPBFX.

NPBFX - Best ECN/STP Broker 2021 Forex Awards, Most Intelligent Fintech 2020 APAC Bus. Headlines

Re: NPBFX - making money with us since 1996!

AUD/USD: the Australian dollar retreats from record highs 03.02.2023

Good afternoon, dear forum visitors!

NPBFX offers the latest release of analytics on AUD/USD for a better understanding of the current market situation and more efficient trading.

Current trend

The AUD/USD pair shows a moderate decline, testing 0.7050 for a breakdown and building on the "bearish" momentum that was formed the day before, when the instrument retreated from its June record highs. The reason for the appearance of downward dynamics was the growth of the US currency in almost the entire spectrum of the market, which intensified after the publication of the minutes of the meetings of the European Central Bank (ECB) and the Bank of England. Both regulators decided to raise interest rates by 50 basis points, and also announced their readiness to maintain a "hawkish" monetary policy until inflation reaches the target level of 2.0%.

In addition, the US dollar was supported by statistics on jobless claims: the number of Initial Jobless Claims for the week ended January 27 decreased from 186.0 thousand to 183.0 thousand, while analysts expected 200.0 thousand, and Continuing Jobless Claims for the week ended January 20 decreased from 1.666 million to 1.655 million, which also turned out to be better than forecasts at the level of 1.677 million.

Some support for quotes at the end of the week is provided by macroeconomic statistics from Australia and China. Australian Services PMI from the Commonwealth Bank in January rose from 48.3 points to 48.6 points with a neutral forecast. In addition, December data on Building Permits were presented yesterday: the total volume increased by 18.5% against preliminary estimates of 1.0%, and for private houses it was adjusted for the fourth time in a row, losing 2.3%. In general, the construction market remains under pressure from high inflation and the interest rate of the Reserve Bank of Australia (RBA). In turn, the Chinese Caixin Services PMI over the same period accelerated from 48.0 points to 52.9 points, while the forecast was at 47.3 points.

Support and resistance

Bollinger Bands in D1 chart show active growth. The price range is narrowing, reflecting appearance of multi-directional dynamics in the short term. MACD is falling, keeping a relatively strong sell signal (the histogram is below the signal line). Stochastic, having reacted to the emergence of "bearish" dynamics, has only reversed into a horizontal plane, indicating a fragile balance of power.

Resistance levels: 0.7100, 0.7150, 0.7202, 0.7250.
Support levels: 0.7050, 0.7000, 0.6950, 0.6900.

https://i.ibb.co/HVR72F0/audusd-03022023-55.png

https://i.ibb.co/7QZG523/audusd-03022023-66.png

Trading tips

Short positions may be opened after a breakdown of 0.7050 with the target at 0.6950. Stop-loss — 0.7100. Implementation time: 1-2 days.

A rebound from 0.7050 as from support followed by a breakout of 0.7100 may become a signal for opening new long positions with the target at 0.7202. Stop-loss — 0.7050.

Use more opportunities of the NPBFX analytical portal: analytics

You can find more actual analytical reviews on other popular currency pairs, metals and CFDs on the NPBFX online portal. Daily analytics with charts, current market prognoses and trading scenarios in the Feed section are available. Get free and unlimited access to the online portal after registering on the official website of NPBFX Company.

If you have any questions about trading instruments, you can always ask an analyst in the online chat on the portal and get a free consultation of an experienced specialist.

Use the current recommendations of analysts on AUD/USD and trade efficiently with NPBFX.

NPBFX - Best ECN/STP Broker 2021 Forex Awards, Most Intelligent Fintech 2020 APAC Bus. Headlines

Re: NPBFX - making money with us since 1996!

USD/JPY: the US dollar is correcting after strong growth at the end of last week 06.02.2023

Good afternoon, dear forum visitors!

NPBFX offers the latest release of analytics on USD/JPY for a better understanding of the current market situation and more efficient trading.

Current trend

The USD/JPY pair is trading down, correcting after a notable rise last Friday. It should be noted that the instrument also opened with a significant upward gap and is currently trying to level it.

At the end of last week, the American currency was supported by a strong report on the US labor market for January. The economy created more than 500.0 thousand new jobs outside the agricultural sector, while analysts expected only 185.0 thousand, and the data for December were revised from 223.0 thousand to 260.0 thousand. In turn, the Unemployment Rate for the same period decreased from 3.5% to 3.4% against the forecast of 3.6%, while the Average Hourly Earnings at the same time slowed down from 0.4% to 0.3% MoM and from 4.9% to 4.4% YoY, which turned out to be noticeably worse than the analysts' neutral forecasts.

On Friday, Japan released January data on business activity in the Services sector: the PMI rose from 51.1 points to 52.3 points, below the expected 52.4 points. The non-manufacturing sector continues to recover after the complete lifting of quarantine restrictions in the country and the opening of the borders of China, as a result of which household demand increased, and the influx of new tourists provided the service sector with increased profits. Tomorrow, investors will pay attention to the statistics on coinciding and leading indicators for December, as well as the speech of the Chair of the US Federal Reserve, Jerome Powell, who can comment on the unexpectedly strong data on the US labor market.

Support and resistance

Bollinger Bands in D1 chart show moderate growth. The price range is expanding but it fails to conform to the surge of "bullish" sentiments at the moment. MACD indicator is growing, while preserving a rather stable buy signal (located above the signal line). Stochastic keeps its upward direction but is rapidly approaching its highs, which reflects the risks of overbought American dollar in the ultra-short term.

Resistance levels: 132.00, 133.00, 133.61, 134.50.
Support levels: 131.00, 130.00, 129.00, 128.00.

https://i.ibb.co/gjZL1dF/USDJPY060223-33.png

https://i.ibb.co/SQVMcP5/USDJPY060223-333.png

Trading tips

Short positions may be opened after a breakdown of 131.00 with the target at 129.00. Stop-loss — 132.00. Implementation time: 2-3 days.

A rebound from 131.00 as from support followed by a breakout of 132.00 may become a signal for opening new long positions with the target at 133.61. Stop-loss — 131.20.

Use more opportunities of the NPBFX analytical portal: weekly FOREX forecast

You can learn more about the current situation on Apple Inc. and get acquainted with the weekly analytical forecast in the "Video reviews" section on the NPBFX portal. Weekly video reviews contain trends, key levels, trading recommendations for such popular instruments as GBP/USD, EUR/USD, USD/CHF, AUD/USD. In order to get free and unlimited access to video forecast and other useful instruments on the portal, you need to register on the NPBFX website.

If you have any questions about trading instruments, you can always ask an analyst in the online chat on the portal and get a free consultation of an experienced specialist.

Use the current recommendations of analysts on USD/JPY and trade efficiently with  NPBFX.

NPBFX - Best ECN/STP Broker 2021 Forex Awards, Most Intelligent Fintech 2020 APAC Bus. Headlines

Re: NPBFX - making money with us since 1996!

Meta Platforms Inc.: technical analysis 08.02.2023

Good afternoon, dear forum visitors!

NPBFX offers the latest release of analytics on Meta Platforms Inc. a better understanding of the current market situation and more efficient trading.

Shares of Meta Platforms Inc., the US multinational holding company that owns technology conglomerate and social media giant Facebook, are trading at 191.00.

On the daily chart, a global corrective trend is forming, within which the gap of 151.00–183.00 has formed, and the price is above its end level.

In the four-hour chart, the prospects for the continuation of the upward dynamics are still quite high, as evidenced by the fact that the quotes are above the 38.2% Fibonacci base correction level around 191.75, in case of consolidation above which the next target will be the 50.0% Fibonacci intermediate correction level around 220.00.

Technical indicators keep a buy signal: fast EMAs on the Alligator indicator expand the range of fluctuations, and the AO histogram forms rising bars in the buying zone.

https://i.ibb.co/cQcDPT4/META-080223-22.png

Trading tips

Long positions may be opened after the price rises and consolidates above 197.00 with the target at 221.00. Stop loss – 190.00. Implementation period: 7 days or more.

Short positions may be opened after a reversal, reduction, and consolidation of the price below 184.00 with the target at 151.00. Stop loss – 190.00.

Use more opportunities of the NPBFX analytical portal: E-book

If you just recently started to be interested in trading on FOREX and would like to deepen your knowledge, an electronic Beginner's Guide to FOREX Trading will be an excellent helper for you here. The book consists of 5 chapters and reflects fundamental concepts of the foreign exchange market to start successful trading. From the main chapters of the E-book you can learn about the concepts and history of FOREX, currencies and trend lines, technical indicators, types of orders, trading on news, psychology of trading, risk management and much more.

You can read a Beginner's guide to FOREX Trading online or download it free of charge from the NPBFX analytical portal in the "Education" section. In order to get unlimited access to the E-book and other useful instruments on the portal, you need to register on the NPBFX website.

If you have any questions about trading instruments, you can always ask an analyst in the online chat on the portal and get a free consultation of an experienced specialist.

Use the current recommendations of analysts on Meta Platforms Inc. and trade efficiently with  NPBFX.

NPBFX - Best ECN/STP Broker 2021 Forex Awards, Most Intelligent Fintech 2020 APAC Bus. Headlines

Re: NPBFX - making money with us since 1996!

NZD/USD: New Zealand dollar returned to decline 10.02.2023

Good afternoon, dear forum visitors!

NPBFX offers the latest release of analytics on NZD/USD for a better understanding of the current market situation and more efficient trading.

Current trend

The NZD/USD pair shows an active decline, testing 0.6300 for a breakdown. The day before, the instrument made a rather aggressive attempt to grow; however, the "bulls" failed to consolidate at the local highs of February 3.

Meanwhile, the macroeconomic background in both New Zealand and the US remained mixed. Initial Jobless Claims in the US for the week ended February 3 increased from 183.0 thousand to 196.0 thousand, which turned out to be higher than analysts' forecasts of growth to 190.0 thousand, and Contiuing Jobless Claims for the week ended January 27 increased from 1.650 million to 1.688 million, which also turned out to be higher than the expected 1.658 million.

New Zealand data showed an increase in Electronic Card Retail Sales in January by 2.6% after -2.3% in the previous month, while analysts had expected 1.9%. At the same time, in annual terms, the indicator decreased from 4.8% to 2.7%, contrary to forecasts of growth to 9.1%.

Support and resistance

Bollinger Bands in D1 chart demonstrate a stable decrease. The price range expands, making way to new local lows for the "bears". MACD continues its downtrend, strengthening its sell signal (the histogram is below the signal line). Stochastic, having attempted an upward correction at the beginning of the week, reversed to the horizontal plane, indicating the ambiguous nature of trading at the end of the week.

Resistance levels: 0.6350, 0.6400, 0.6450, 0.6500.
Support levels: 0.6288, 0.6250, 0.6200, 0.6155.

https://i.ibb.co/g71yhsC/NZDUSD100223-33.png

https://i.ibb.co/sFt0djW/NZDUSD100223-333.png

Trading tips

Short positions may be opened after a breakdown of 0.6288 with the target at 0.6200. Stop-loss — 0.6330. Implementation time: 1-2 days.

A rebound from 0.6288 as from support followed by a breakout of 0.6350 may become a signal for opening new long positions with the target at 0.6450. Stop-loss — 0.6300.

Use more opportunities of the NPBFX analytical portal: analytics

You can find more actual analytical reviews on other popular currency pairs, metals and CFDs on the NPBFX online portal. Daily analytics with charts, current market prognoses and trading scenarios in the Feed section are available. Get free and unlimited access to the online portal after registering on the official website of NPBFX Company.

If you have any questions about trading instruments, you can always ask an analyst in the online chat on the portal and get a free consultation of an experienced specialist.

Use the current recommendations of analysts on NZD/USD and trade efficiently with NPBFX.

NPBFX - Best ECN/STP Broker 2021 Forex Awards, Most Intelligent Fintech 2020 APAC Bus. Headlines