forex software

Create and Test Forex Strategies

forex software

Skip to forum content

Forex Software

Create and Test Forex Strategies

You are not logged in. Please login or register.


(Page 19 of 62)

Forex Software → Market Analysis → InstaForex Analysis

Pages Previous 1 17 18 19 20 21 62 Next

You must login or register to post a reply

RSS topic feed

Posts: 451 to 475 of 1,547

Re: InstaForex Analysis

Why didn't the oil go upwards? Volume analysis for oil

Good evening, dear traders! Yesterday, we gave a trading idea for the growth of oil but paid attention to the evening news on oil reserves in the United States. Let's analyze this situation on volumes.

During the time of the opening of Europe, the price immediately went up and while it is on the way to the maximum of 58.74, there was another extremum - 58.56. At the breakdown of which, there was practically no doubt about the further increase in price. Looking at the chart, even the trend line up indicates purchases. However, It is very important that all this happened in the middle of the European session and before the release of the weekly news on Oil Reserves for about another 5 hours. That is, everyone only sees purchases.

At the time of the opening of the American session, there was also no increase in prices. Although the upward trend still remained, which added confidence in the growth.

In addition, at the time of the news release, summing up all mentioned above, the state of the price was such that all liquidity was not up, but, on the contrary, at the bottom with the nearest targets 58.13 and the American session of the previous day which is 57.76.

https://forex-images.ifxdb.com/userfiles/20191129/analytics5de064fb71b5e.png

Oil's approach to the maximum in Europe:

https://forex-images.ifxdb.com/userfiles/20191129/analytics5de065113f117.png

Thus, the Europeans simply didn't have the courage to collect stocks before the reserves. Nevertheless, the stocks themselves came out large, which led to the sales of black gold.

This analysis is based on the US oil futures.

Analysis are provided byInstaForex.

Best regards, PR Manager / Learn more about InstaForex Company at http://instaforex.com

Re: InstaForex Analysis

Important intraday Level For EUR/USD, December 02,2019

https://forex-images.ifxdb.com/userfiles/20191202/analytics5de47d010f1c0.jpg

When the European market opens, such economic data as Final Manufacturing PMI, German Final Manufacturing PMI, Italian Manufacturing PMI, French Final Manufacturing PMI, and Spanish Manufacturing PMI will be unveiled. The US will publish such eocnomic reports as ISM Manufacturing Prices, Construction Spending m/m, ISM Manufacturing PMI, and Final Manufacturing PMI.So, amid the reports, EUR/USD will move in a low to medium volatility during this day.

TODAY'S TECHNICAL LEVEL:

Breakout BUY Level: 1.1073.

Strong Resistance: 1.1067.

Original Resistance: 1.1056.

Inner Sell Area: 1.1045.

Target Inner Area: 1.1019.

Inner Buy Area: 1.0993.

Original Support: 1.0982.

Strong Support: 1.0971.

Breakout SELL Level: 1.0965.


(Disclaimer) *The market analysis posted here is meant to increase your awareness, but not to give instructions to make a trade.

Best Regards,PR Manager
InstaForex Companies Group

Re: InstaForex Analysis

Control zones for USD/CAD on 12/03/19

During the second week, the pair is trading within the accumulation zone. This makes it possible to consider weekly extremes for finding entry points. The upper boundary is the maximum of the last week, which coincides with the Weekly Control Zone 1/2 1.3328-1.3319. Now, testing this zone will be decisive for the entire upward movement of the last month.

Working within the framework of the flat implies partial consolidation of transactions during tests of significant extremes.

An alternative model will be developed if the closure of today's trading occurs above the Weekly Control Zone 1/2. This will open the way for further growth. The nearest goal, in turn, will be the maximum of October. The test of which will increase the probability of a large offer.

Daily CZ - daily control zone. The zone formed by important data from the futures market that changes several times a year.

Weekly CZ - weekly control zone. The zone formed by the important marks of the futures market, which change several times a year.

Monthly CZ - monthly control zone. The zone that reflects the average volatility over the past year.

Analysis are provided by InstaForex

Best regards, PR Manager / Learn more about InstaForex Company at http://instaforex.com

Re: InstaForex Analysis

Oil kings can do everything?

Oil is slowly recovering from a major sell-off on the last day of autumn. Taking advantage of the thin market after Thanksgiving, speculators decided to get rid of their long positions ahead of the December OPEC+ meeting. The simplest thing that the cartel and Russia can do is to prolong the agreement to reduce production by several months after March 2020. However, how will the market react to this? Isn't it better to avoid a massive sell-off before the results of the meeting are known?

If speculators sold oil at the November 29 auction, before that, on the contrary, they were actively building up long positions. By the end of the week, November 26, WTI net-longs increased by 15%, gross longs increased by 12%, while shorts fell by 14%. Approximately the same numbers could be seen on Brent.

Brent Speculative Dynamics

https://forex-images.ifxdb.com/userfiles/20191204/analytics5de6ec63ed265.jpg

It is peculiar that black gold was not moving in unison with US stocks at the turn of autumn and winter. The latter were marked by a serious collapse after the White House introduced duties on imports of steel and aluminum from Brazil and Argentina, while oil grew in response to rumors of Saudi Arabia's desire to expand production cuts from 1.2 million bpd to 1.6 million bpd, at least until June 2020. Riyadh needs to carry out an initial public offering of shares in the state-owned company Aramco, the scale of which is estimated at approximately $25 billion. If Brent is listed below $60 per barrel, it is unlikely that buyers will grab paper of the oil company like hotcakes.

However, according to Goldman Sachs, even if OPEC+ expands its obligations by 400 thousand bpd by the end of June 2020, this is unlikely to lead to a serious increase in prices. The bank predicts that North Sea-grade quotes will dangle around $60 per barrel for most of next year.

Oil support is provided by the first growth above the critical level of 50 in business activity in China's manufacturing sector since April. China is the largest consumer of black gold in the world, and an increase in demand of 64 thousand bpd in the third quarter is good news for Brent bulls and WTI. Moreover, the IEA predicts that the figure will reach a record high of 13.6 million bpd in 2020. I have no doubt that this will be so if the trade war between Washington and Beijing does not become history. Otherwise, weak global demand will continue to put downward pressure on black gold prices.

At the same time, the growth of shale production in the United States significantly affects the market balance. In September, the United States closed a full month as a net exporter of black gold for the first time since 1940. Its deliveries abroad exceeded imports by 89 thousand bpd. It is Interesting that the last time the value of net imports exceeded 12 million was ten years ago.

Technically, without leaving Brent quotes beyond the downward trading channel, the implementation of the Double Bottom pattern can be forgotten. On the contrary, a breakthrough of support at $56 per barrel, which corresponds to the lower boundary of the triangle, the risks of a downward trend recovery will increase.

Analysis are provided byInstaForex.

Best regards, PR Manager / Learn more about InstaForex Company at http://instaforex.com

Re: InstaForex Analysis

Forecast for USD/JPY on December 5, 2019

USD/JPY

The information received yesterday from the headquarters of the US and Chinese negotiators on trade encouraged the markets - representatives of the parties allowed the conclusion of the first phase of the deal until December 15, before the date of the introduction of tariffs on Chinese goods. The US S&P 500 index gained 0.63%, Nikkei 225 is currently up 0.70% and China A50 grew 0.36%. The price turned from the achieved first bearish goal - from the enclosed line of the price channel, a little short of the MACD line. The signal line of the Marlin oscillator is still in the negative trend zone, growth could continue, but still within the correction.

https://forex-images.ifxdb.com/userfiles/20191205/analytics5de88426c0963.png

The correction can continue to the range of 109.30/50 (highs of October 30 and November 7), going over the range will mean the correction will go into a trend growth, the target will be the line of the green price channel in the region of 109.95. Leaving prices at yesterday's low opens the next bearish target at 107.57 - the intersection of the lines of the red and green price channels.

https://forex-images.ifxdb.com/userfiles/20191205/analytics5de8843c12860.png

*The market analysis posted here is meant to increase your awareness, but not to give instructions to make a trade.

Analysis are provided byInstaForex.

Best regards, PR Manager / Learn more about InstaForex Company at http://instaforex.com

Re: InstaForex Analysis

Developing the trading idea for oil

Good evening, dear traders! I present to you the development of a trading idea for oil based on volumetric analysis!

Let me remind you that the idea for purchasing oil for the absorption of the decline last Friday was presented yesterday (12/04/19), which happened without the participation of America, because they had a public holiday. After that, the Americans traded for the next 2 trading sessions at prices that were not very profitable for sales, i.e. cheap relative to prices before the holidays.

The price increase occurred before the news on Oil Reserves, but this also increased the probability of a maximum update, since oil production was sharply reduced and today, there was an opportunity to add long positions in order to update the last maximum of 58.74.

As a result, 250 points were earned from the entry point 56.30 to the crossing 58.74. Moreover, it would bring +60 points when adding a long position or purchasing from oil reserves.

Forecast:

https://forex-images.ifxdb.com/userfiles/20191206/analytics5de99fd715480.png

Developing trading idea with a description:

https://forex-images.ifxdb.com/userfiles/20191206/analytics5de99fed1392b.png

Good luck in trading and follow the money management!

*The market analysis posted here is meant to increase your awareness, but not to give instructions to make a trade.

Analysis are provided byInstaForex.

Best regards, PR Manager / Learn more about InstaForex Company at http://instaforex.com

Re: InstaForex Analysis

EUR/USD reacting below resistance, potential drop!


https://forex-images.ifxdb.com/userfiles/20191209/analytics5dedb74f83c24.png


Trading RecommendationEntry: 1.10660Reason for Entry: 38.2% Fibonacci RetracementTake Profit : 1.10280

Reason for Take Profit: 61.8% Fibonacci retracementStop Loss: 1.11090Reason for Stop loss:

horizontal swing high resistance


(Disclaimer) *The market analysis posted here is meant to increase your awareness, but not to give instructions to make a trade.

Best Regards,PR Manager
InstaForex Companies Group

Re: InstaForex Analysis

Plans for gold

Good day, dear traders! It is time to turn to gold, for which there is a possibility of a large medium-term decline. Last week turned out to be very exciting for this instrument: at first, the main driver was the news on China, on which gold showed strong growth, but the week ended with a sheer drop in non-farms and a complete absorption of "Chinese" growth. It is important to note that a false breakout of the level of 1478.68, an important level for November sellers, was shown last week which confirms their strength.

Therefore, I believe that in the medium term gold will decline at least to the level of 1445.33. Whether this breakout turns out to be real or false does not matter, its presence is what is of significance to us. It is also necessary to remember that there will be another Federal Reserve meeting and a decision on the interest rate on Wednesday evening, which gold will definitely react strongly to. Therefore, I believe that until Wednesday, the development of a trend for gold is unlikely. I recommend that you wait until the pullback at least half of the Friday fall, after which you can look for the opportunity to take short positions in the medium term in order to update the price mark of 1445.33.

https://forex-images.ifxdb.com/userfiles/20191210/analytics5deed50c7e580.png

If the Friday fall is completely absorbed by buyers, this will mean that the priority has changed and the bearish scenario can be considered unfulfilled.

I remind you that the day of increased volatility in gold is on Wednesday evening - the interest rate on USD, as well as the Fed conference.

I wish you success in trading and big profits!

Analysis are provided byInstaForex.

Best regards, PR Manager / Learn more about InstaForex Company at http://instaforex.com

Re: InstaForex Analysis

Forecast for EUR/USD on December 11, 2019

EUR/USD
Yesterday's indicators on sentiment in business circles of the eurozone greatly exceeded expectations and the single currency closed the day with an increase of 28 points. The Eurozone ZEW Economic Sentiment index for December jumped from -1.0 to 11.2 points while expecting growth to 2.2 points, the German index grew from -2.1 to 10.7 while expecting 1.1 points.

https://forex-images.ifxdb.com/userfiles/20191211/analytics5df066f12d80e.png

On the daily chart, the price exceeded strong resistance of the Fibonacci level of 123.6% and the embedded line of the price channel. The price exit above the signal level of 1.1116 (December 4 high) opens the way for further growth to the Fibonacci level of 110.0%. Today, the main news of the day will be the US central bank's decision on monetary policy, followed by a press conference by Federal Reserve Chairman Jerome Powell. We do not expect strong movements in the euro until the evening, as it was yesterday.

What will be the Fed's forecasts on the economy and forecasts of the FOMC members on rates? The most obvious answer lies on the surface - economic forecasts will be moderately optimistic, rate forecasts will shift towards holding the current 1.75% almost until the fall-winter of next year. And if it turns out that way, then investors can count on maintaining the rate almost until the spring of 2021, until the new president takes office. A financial crisis may hinder this situation, the chances of the deployment of which are great next year, but so far this factor has not been taken into account.

In general, we expect the euro to return under the newfound support from the Fibonacci lines and the price channel and a further decrease in the price to the Fibonacci level of 138.2% at the price of 1.0985.

https://forex-images.ifxdb.com/userfiles/20191211/analytics5df067069ab56.png

On the four-hour chart, the signal line of the Marlin oscillator reached the boundary with the growth territory, from which the indicator can turn down, followed by a price drop.

Analysis are provided byInstaForex.

Best regards, PR Manager / Learn more about InstaForex Company at http://instaforex.com

Re: InstaForex Analysis

EUR/USD. US inflation unfairly ignored: market is busy with other problems

Dollar bulls ignored the release of data on rising US inflation today. The euro-dollar pair is waiting for meetings of the Federal Reserve and the European Central Bank, while the pound-dollar pair awaits early parliamentary elections. The remaining pairs in which the US dollar is a part of are closely watching the prospects of the US-Chinese negotiations in the light of the approaching December 15 - that is, the day when the White House could introduce additional duties on Chinese imports. In other words, the main currency pairs were distracted by other fundamental factors, so one of the key macroeconomic releases was left unattended by traders.

https://forex-images.ifxdb.com/userfiles/20191212/analytics5df180c24e72d.jpg

Nevertheless, this publication should not be ignored - sooner or later the market will return to these figures, especially if Washington and Beijing come to a certain compromise (according to rumors, Trump is ready to postpone the introduction of new duties in January or February). It's worth noting that the numbers published today came out in the green zone, showing impressive growth. In particular, the overall consumer price index reached 2.1% in annual terms - this is the best result since last November. On a monthly basis, instead of a projected decline to 0.2%, the index rose to 0.4%. The core index also pleased investors: the indicator met expectations at around 0.2% in monthly terms. The indicator came out in the green zone on an annualized basis, exceeding the forecast values (2.3% YOY). This dynamics is primarily due to the increase in energy tariffs (as in the previous period). In addition, medical services, food and transportation costs have risen in price.

But all these numbers were left out of the attention of EUR/USD traders (however, like the rest of the dollar pairs). Traders are clearly nervous on the eve of the December meeting of the Fed, the results of which will put dots on the i in many matters. First, the general tone of the accompanying statement is of interest. The dollar's position largely depends on how regulator members place emphasis in their communique.

The Fed definitely has reasons for optimism - many macroeconomic reports over the past month have been either better than forecasts, or have been revised upwards. For example, the growth rate of the US economy in the third quarter should have slowed down to 1.8% (with growth up to 3.1% in the first quarter and up to 2% in the second). In reality, the volume of GDP increased by 2.1%, and the component of personal consumption showed the highest growth from the second quarter of the year before last. The price index of GDP remained at the initial level of 1.7% (against the two percent forecast), while this indicator grew by 2.4% in the second quarter. Base RFE also accelerated - to 2.1% after more modest growth in the previous period. The indicator of orders for durable goods also pleased. Here you can recall Nonfarm: the number of people employed in the non-agricultural sector increased to 266 thousand, although, according to data from the ADP agency, this indicator should have fallen below the 100 thousandth mark. Employment in the manufacturing sector also increased (an increase of 54 thousand), after a decrease in the previous month. The unemployment rate has completely decreased to a half-century low - up to 3.5%.

https://forex-images.ifxdb.com/userfiles/20191212/analytics5df180d5dce6a.jpg

It is likely that members of the US regulator in their accompanying statement will reflect the above trends in the economy. However, there is a flip side to the coin - this is the uncertainty about the prospects for trade relations between China and the United States, as well as a slowdown in the manufacturing and export sectors. The ISM index in the service sector, as well as the production ISM, turned out to be much worse than forecasts, reflecting the ongoing decline in activity, in particular, in the manufacturing industry. In addition, the most important inflation indicator for the Fed (base PCE) showed a negative trend, falling to 1.6% in annual terms. Thus, it moved away from the two percent target level.

All this suggests that the December meeting of the Fed can bring surprises. According to the forecasts of most experts, the Fed will maintain the status quo, and secondly, it will not hint at a possible interest rate cut in the first half of next year. According to this scenario, a point forecast will signal that the regulator does not intend to mitigate monetary policy in 2020. This is a basic scenario, which is already largely taken into account in prices. In case of deviation from it, the dollar will fall into a storm of price turbulence. The greenback will become significantly cheaper if the Fed allows lower rates next year and, accordingly, more expensive if regulators favor a tightening of monetary policy within the next year. It is also worth considering that today the regulator will publish updated forecasts for the economy, employment and inflation. If they differ significantly from October estimates, then the reaction of traders will also not take long. Against the backdrop of such prospects, today's data on the growth of US inflation remained in the shadow. The movement vector of the EUR/USD pair is completely dependent on the results of the December meetings of the Fed and the ECB.

Analysis are provided byInstaForex.

Best regards, PR Manager / Learn more about InstaForex Company at http://instaforex.com

Re: InstaForex Analysis

Development of trading ideas for USD/CAD and oil.

Good evening traders! Congratulations to those who used our USD / CAD trading idea and oil last time.

Trading idea for USD / CAD:

https://forex-images.ifxdb.com/userfiles/20191213/analytics5df2d3f2a39ea.png

Development of trading idea for USD / CAD:

https://forex-images.ifxdb.com/userfiles/20191212/analytics5df1fabe5f502.png

Trading idea for oil:

https://forex-images.ifxdb.com/userfiles/20191213/analytics5df2d4072f517.png

Development of trading idea for oil:

https://forex-images.ifxdb.com/userfiles/20191213/analytics5df2d49451b5f.png

*The market analysis posted here is meant to increase your awareness, but not to give instructions to make a trade.

Analysis are provided byInstaForex.

Best regards, PR Manager / Learn more about InstaForex Company at http://instaforex.com

Re: InstaForex Analysis

GBP/USD. Great Britain is outside the European Union. Problems begin even before the official Brexit.

https://forex-images.ifxdb.com/userfiles/20191215/analytics5df67b9cf2afc.png

Fanfares died out, everyone was drunk from champagne, and the whole Kingdom celebrated the victory of Boris Johnson in the elections, and now the country really has the right to prepare for the final "divorce" from the European Union. Most likely, Boris Johnson will succeed in unhindered dragging his version of the "deal" with the European Union on Brexit through the new Parliament, which means that London and Brussels can announce the beginning of the "transition period" on January 31 (or even earlier). We said earlier that despite the strong appreciation of the pound against the optimism of traders regarding Brexit and the formation of a "majority government" by conservatives, the UK and the pound are now facing harsh everyday life. Moreover, pound may continue to strengthen in pair with the dollar, however, traders will begin to pay attention to macroeconomic statistics from Foggy Albion and from overseas sooner or later, and it does not need to be analyzed for a long time in order to draw appropriate conclusions. It is unequivocal, in favor of the American currency. Moreover, market participants can "remember" all those failed statistics from Britain in those two months when no one paid attention to it. If we add to this the still potentially long and complicated negotiations with the European Union on new trade relations between the bloc and the Kingdom, it becomes clear that the economic situation in the UK may continue to deteriorate, which will definitely negatively affect economic performance.And in the last three months, the main indicator of the state of the economy of any country – GDP - either showed negative growth rates, that is, decreased, or showed zero growth.

Nevertheless, this is not all the potential problems that may be encountered in the UK. The fact is that no less high-profile than Boris Johnson, Nicola Sturgeon won in her Scottish Parliament. From which her party scored 48 out of 59 possible seats. Sturgeon had also previously stated that Scotland is against leaving the European Union. Now, after the deafening victory of the Scottish nationalists, talk of holding a second referendum resumed. The leader of the Scottish National Party said that "the future of Scotland should be in the hands of the Scots." According to Sturgeon, British Prime Minister Boris Johnson has a mandate for Brexit in England, but does not have a mandate to withdraw Scotland from the European Union. Next week, the Sturgeon party will submit an official application for a referendum on independence. "It's not about to ask permission from the prime minister of Great Britain or any other Westminster politician. This is a confirmation of the democratic right of the people of Scotland to determine their future." Sturgeon emphasized. "Scotland cannot be a prisoner of Britain, it needs to be allowed to hold a referendum on independence, since it was on the verge of leaving the European Union against its will." summed up by the first minister of Scotland.

Thus, we believe that the UK can now face the new Brexit, even before the implementation of its own. Although it is difficult to say whether Nicola Sturgeon is able to hold such a referendum without the approval of London. And there is no doubt that London will not give approval. Thus,we can witness a new epic called "Scexit" (Scotland EXIT) very soon.

Analysis are provided byInstaForex.

Best regards, PR Manager / Learn more about InstaForex Company at http://instaforex.com

Re: InstaForex Analysis

Trading idea for GBP/USD pair

Good evening, dear traders! I present to your attention a trading idea for the GBP/USD pair.

So, the Conservatives won the parliamentary elections in the UK, and now, no one doubts that the party of Boris Johnson will bring Brexit to its logical conclusion. On this news, the GBP/USD pair increased by 3500p for 5zn namely at the time of the announcement of the preliminary results of the parliamentary elections. And all would be nothing - both positive and joy for Britain. Thus, only those who already knew does not speak about it. However, no one here says how it is possible to earn money on it now. Therefore, I suggest one simple trading idea based on the "Hunt for Feet" method, and it consists of developing the stops of pound buyers, from Friday, as well as today. The fact is that over the past 1.5 days, buyers can become (put their stops) only at the level of 1.33, which is also round. It is believed that this is a great goal of "stop hunters", and you can quite easily implement it by using the signals of your strategies on smaller time frames to enter.

https://forex-images.ifxdb.com/userfiles/20191217/analytics5df818712358e.png

As usual, it is recommended to develop against the "crowd." Following a strategy is a distinctive feature of successful trading.

Good luck in trading and follow the money management!

Analysis are provided byInstaForex.

Best regards, PR Manager / Learn more about InstaForex Company at http://instaforex.com

Re: InstaForex Analysis

EUR/USD approaching support, potential bounce!


https://forex-images.ifxdb.com/userfiles/20191218/analytics5df99d4b9afc9.png


Trading RecommendationEntry: 1.11073

Reason for Entry: 38.2% Fibonacci retracement, horizontal overlap support, 78.6% fibonacci extension, breakout level

Take Profit : 1.11868Reason for Take Profit:horizontal swing high resistanceStop Loss: 1.10616Reason for Stop loss:61.8% Fibonacci retracement


(Disclaimer) *The market analysis posted here is meant to increase your awareness, but not to give instructions to make a trade.

Best Regards,PR Manager
InstaForex Companies Group

Re: InstaForex Analysis

GBP / USD. December 18th. The results of the day. Boris Johnson is ready to return to the "tough" Brexit and takes a tough stance in future negotiations with the EU
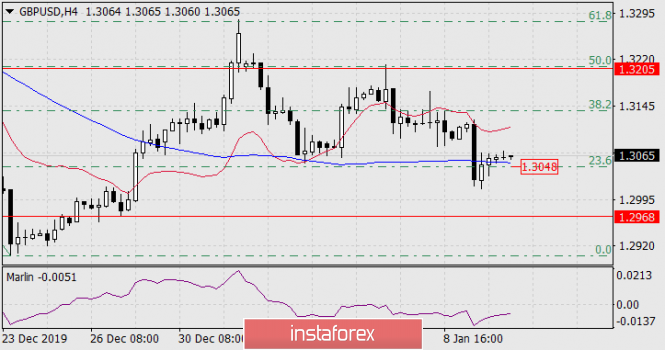
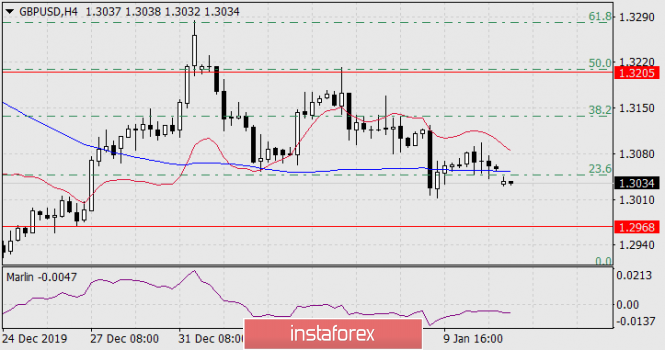
https://forex-images.ifxdb.com/userfiles/20160818/analytics57b55cfa36eb7_eu.png

4 hour time-frame
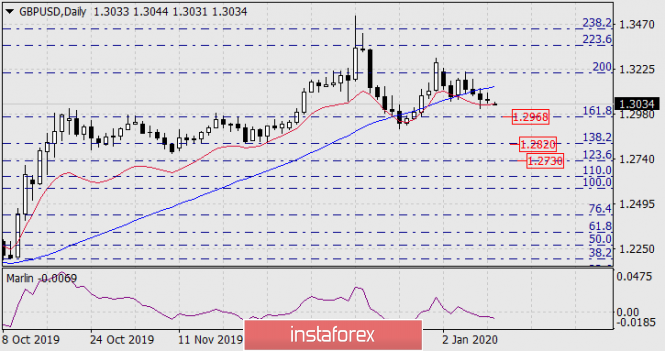
Amplitude of the last 5 days (high-low): 108p - 179p - 354p - 101p - 234p.
Average volatility over the past 5 days: 196p (high).

The GBP / USD currency pair on Wednesday trades continued a steady downward movement, which, from our point of view, is justified by only one factor. This factor is elections to the Parliament of Great Britain. They were left behind and deprived market participants of the foundation and the reason that allowed them to buy the pound in the last two months. Now that it is clear that the entire power in the country is concentrated in the hands of the Conservative Party, that neither Labor, nor Scottish nationalists, nor, moreover, other political forces, and even all of them combined, can prevent Boris Johnson from doing so, gives an opportunity with high accuracy to predict what will happen in the state in the near future. December 20 will be a vote on a bill of agreement between Britain and the European Union. Certainly it will be adopted by a majority vote and on January 31, 2020 (or even earlier), the so-called "transition period" will begin, during which the Boris Johnson government will need to agree with Brussels on all aspects of the further coexistence of the Alliance and the Kingdom, which has left the jurisdiction of Brussels. However, if earlier Boris Johnson and his cabinet had to agree, because Parliament required it, now he absolutely does not have to do it. Recall that initially Johnson was ready to implement the "hard" Brexit without any agreements with the European Union. Now that there are already agreements, it is possible to continue the dialogue with Michel Barnier and the company, but the British Prime Minister has already made it clear that he will not make any concessions, prolongation of the "transitional period" categorically rejects (now in the UK there is a law that allows extending the "transitional period" once for a period of 2 years, if the parties fail to manage to reach an agreement before the expiration of the initial period). According to Johnson, any negotiations with the EU should be completed by December 31, 2020, and if London and Brussels fail to meet this deadline, then the gap will occur without an agreement at all. That is, in fact, the government of Boris Johnson, having received full power in the country, is absolutely not opposed to returning to the original version with the "hard" Brexit. Or is this a new plan by Boris Johnson aimed at political blackmail of the leaders of the European Union. Approximately Johnson's strategy may be as follows. The Prime Minister threatens a "tough" divorce and requires speedy negotiations and the speedy conclusion of a trade agreement. If the EU drags out the time during which Britain continues to pay contributions to the European treasury, to remain under all EU financial standards, then Johnson is ready to withdraw without a "deal". Since the "tough" Brexit is not beneficial for the EU itself, then, according to the Prime Minister, the Europeans will be much more accommodating. In any case, negotiations will continue for at least the next year, which, according to the vast majority of experts, will be difficult. And at best, a trade agreement will be concluded at the end of the year that will mitigate the negative effect of breaking all ties between London and Brussels. In the worst case, there will be no agreement,

Macroeconomic statistics from the UK continues to leave much to be desired, however, today, when the pound continued to calmly drop in price, the only British report of the day - the consumer price index for November - did not disappoint market participants. According to experts, inflation in the Foggy Albion should have been reduced to 1.4% y / y, but this did not happen and the index remained at the level of the previous month - 1.5% y / y. This is not to say that this is great and now the British economy will begin to recover. This is just the absence of deterioration in one month. If we recall the rest of the macroeconomic statistics, it becomes clear that there are no reasons for joy and the British pound is likely to continue to fall against the US currency. Moreover, the most important topics for the US dollar (the impeachment of Donald Trump, trade wars and negotiations with China) have no effect on the movement of the GBP / USD pair. And macroeconomic statistics from across the ocean, if it does not please traders in 100% of cases, in most cases it turns out to be quite strong and does not disappoint. So it turns out that the prospects for the British currency are now approximately the same as those of the European currency - absolutely negative. We can still hypothetically hardly imagine what should happen in the States or the European Union, so that the balance of power between their economies is reversed. then the majority comes out strong enough and does not disappoint. So it turns out that the prospects for the British currency are now approximately the same as those of the European currency - absolutely negative. We can still hypothetically hardly imagine what should happen in the States or the European Union, so that the balance of power between their economies is reversed. then the majority comes out strong enough and does not disappoint. So it turns out that the prospects for the British currency are now approximately the same as those of the European currency - absolutely negative. We can still hypothetically hardly imagine what should happen in the States or the European Union, so that the balance of power between their economies is reversed. so that the balance of power between their economies is reversed. then the majority comes out strong enough and does not disappoint. So it turns out that the prospects for the British currency are now approximately the same as those of the European currency - absolutely negative. We can still hypothetically hardly imagine what should happen in the States or the European Union, so that the balance of power between their economies is reversed. so that the balance of power between their economies is reversed. then the majority comes out strong enough and does not disappoint. So it turns out that the prospects for the British currency are now approximately the same as those of the European currency - absolutely negative. We can still hypothetically hardly imagine what should happen in the States or the European Union, so that the balance of power between their economies is reversed.

Trading recommendations:

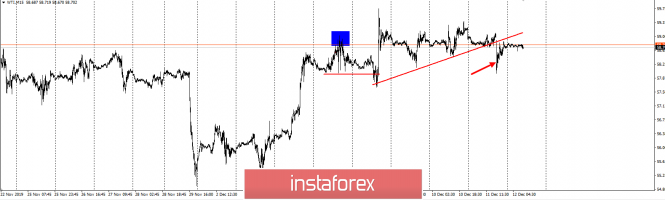
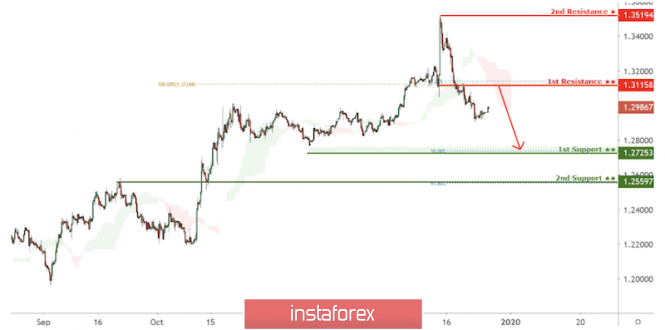
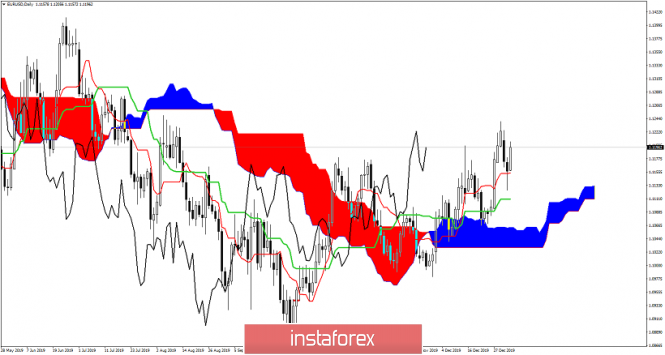
GBP / USD continues to form a new downtrend. The price has worked out the bottom line of the Ichimoku cloud and the first support level of 1.3083. Thus, a rebound from these strong support levels may trigger a round of upward correction. However, without rebounding the price from the indicated supports or without turning up the MACD indicator, it is not recommended to reduce sell positions. The following targets for trading are lowering 1.2931 and 1.2833. It is recommended that purchases of the British pound be returned no earlier than the price fixing above the Kijun-sen line, which is clearly not expected in the coming days.

Explanation of the illustration:
Ichimoku indicator:
Tenkan-sen is the red line.
Kijun-sen is the blue line.
Senkou Span A - light brown dotted line.
Senkou Span B - light purple dashed line.
Chinkou Span - green line.
Bollinger Bands Indicator: 3 yellow lines.
MACD indicator:
Red line and bar graph with white bars in the indicators window.
Support / Resistance Classic Levels:
Red and gray dotted lines with price symbols.
Pivot Level:
Yellow solid line.
Volatility Support / Resistance Levels:
Gray dotted lines without price designations.
Possible price movement options:
Red and green arrows.Translation

Analysis are provided byInstaForex.

Best regards, PR Manager / Learn more about InstaForex Company at http://instaforex.com

Re: InstaForex Analysis

Forecast for AUD / USD on December 20, 2019

AUD / USD
Yesterday, the Australian dollar grew 32 points on good employment data which makes the unemployment rate fell from 5.3% to 5.2%. In general, the correctional growth from the fall of the "Aussie" from December 13 to 17 was 61.8% which is 38.2% on the chart. Due to this, the growth may stop since a double divergence has already been formed on the Marlin oscillator, and the probability of triple divergence is historically small. The first goal of the new wave of decline is the nested price channel line at 0.6860. Overcoming this level opens up prospects for a medium-term decrease in the Australian dollar which is at 0.6820 according to the MACD line near the Fibonacci level of 123.6%, and at 0.6778 which is the reaction level of 161.8%. This continues on to the underlying embedded price channel line which is at 0.6678.

https://forex-images.ifxdb.com/userfiles/20191220/analytics5dfc38453d985.png

On the four-hour chart, the price is currently above the balance lines (indicator red) and MACD, and the Marlin oscillator is also in the growth zone. The departure of the price for these lines, below 0.6885, will reveal the main lowering scenario. The observed price above the indicator lines will be interpreted as false.

https://forex-images.ifxdb.com/userfiles/20191220/analytics5dfc389f93963.png

*The market analysis posted here is meant to increase your awareness, but not to give instructions to make a trade.

Analysis are provided byInstaForex.

Best regards, PR Manager / Learn more about InstaForex Company at http://instaforex.com

Re: InstaForex Analysis

EUR/USD approaching support, potential bounce!

https://forex-images.ifxdb.com/userfiles/20191223/analytics5e0031ad3bafe.png

Trading Recommendation Entry: 1.10533

Reason for Entry: 61.8% Fibonacci retracement, 127.2% fibonacci extension, horizontal swing low support

Take Profit : 1.11418 Reason for Take Profit: horizontal swing high resistance, 61.8% fibonacci retracement

Stop Loss: 1.10253 Reason for Stop loss:78.6% Fibonacci retracement, Horizontal pullback support


*The market analysis posted here is meant to increase your awareness, but not to give instructions to make a trade.

Best Regards,PR Manager
InstaForex Companies Group

Re: InstaForex Analysis

GBP/USD approaching resistance, potential drop!

https://forex-images.ifxdb.com/userfiles/20191226/analytics5e04494d5177a.png

Trading RecommendationEntry: 1.31158 Reason for Entry: 38.2% Fibonacci retracement, horizontal pullback resistance

Take Profit : 1.27253 Reason for Take Profit:50% fibonacci retracementStop Loss: 1.35194 Reason for Stop loss:

Horizontal swing high resistance


*The market analysis posted here is meant to increase your awareness, but not to give instructions to make a trade.

Best Regards,PR Manager
InstaForex Companies Group

Re: InstaForex Analysis

EUR/USD approaching resistance, potential drop!

https://forex-images.ifxdb.com/userfiles/20191227/analytics5e05977c01d0f.png

Trading Recommendation Entry: 1.11104 Reason for Entry:

Horizontal overlap resistance, 38.2% Fibonacci retracement, 78.6% Fibonacci extension Take Profit : 1.10667

Reason for Take Profit: horizontal swing low support, 61.8% Fibonacci retracement Stop Loss: 1.11541

Reason for Stop loss:Horizontal swing high resistance, 61.8% Fibonacci retracement


*The market analysis posted here is meant to increase your awareness, but not to give instructions to make a trade.

Best Regards,PR Manager
InstaForex Companies Group

Re: InstaForex Analysis

Forecast for EUR/USD on January 6, 2019

EUR/USD

Last Friday, the euro made an attempt to push the technical level of 110.0% Fibonacci on the daily chart, but it failed on its first attempt. On Saturday, US President Trump threatened to attack 52 Iran's targets in the event of Iran's military response to a US missile strike, leading to the assassination of General Soleimani. Trump was indirectly supported by Britain, Germany and France, once again urging Tehran to comply with the nuclear deal. We doubt the development of the conflict before the hot phase of the war with Iran, but the current situation can help the dollar in getting out of consolidation (of course, in the direction of strengthening), stretching from July last year.

https://forex-images.ifxdb.com/userfiles/20200106/analytics5e12a9898b9d0.png

On the daily chart, the signal line of the Marlin oscillator approached the lower boundary of its own channel, the exit from which down will strengthen the fall of the euro. The purpose of the movement is the embedded line of the global downward price channel in the region of 1.1045.

https://forex-images.ifxdb.com/userfiles/20200106/analytics5e12a99f04f79.png

*The market analysis posted here is meant to increase your awareness, but not to give instructions to make a trade.

Analysis are provided byInstaForex.

Best regards, PR Manager / Learn more about InstaForex Company at http://instaforex.com

Re: InstaForex Analysis

Ichimoku cloud indicator Daily analysis of EURUSD for January 7, 2020

EURUSD remains in a bullish trend continuing to make higher highs and higher lows. Price so far has respected the key Cloud support area of 1.1040-1.1050. Thus we continue to see more upside potential over the coming days.

https://forex-images.ifxdb.com/userfiles/20200106/analytics5e13acac0d971.png

Price has broken above the Kumo (cloud) and has so far successfully back tested support. Price bounced off the Cloud and this was another bullish signal. EURUSD is now trading above the tenkan-sen (red line indicator) while the kijun-sen is trending below tenkan-sen with a positive slope. With the tenkan-sen above the kijun-sen we have supporting evidence of a bullish trend. We continue to expect this next leg higher to move closer to 1.1280.

*The market analysis posted here is meant to increase your awareness, but not to give instructions to make a trade.

Analysis are provided byInstaForex.

Best regards, PR Manager / Learn more about InstaForex Company at http://instaforex.com

Re: InstaForex Analysis

Australian network through franc

Good evening, dear traders. Congratulations to all Orthodox Christians on Christmas! I wish you well and financial well-being!

As you have probably already noticed, I often trade certain cross-courses using the grid method. And today, as an example of one of them, I will show how you can spread the correct network of limit purchases on the highly oversold AUD/CHF instrument.

https://forex-images.ifxdb.com/userfiles/20200108/analytics5e151d358bd8f.png

Please note that such counter-trend sets should be carried out only after fairly strong passes and an understanding of the average rollback for the pair. You can see some part of these numbers on the screen on the left with a 5-digit dimension.

Now, if you use the lot increase coefficient, you can calculate it according to the trader's calculator.

Good luck in trading and control the risks!

*The market analysis posted here is meant to increase your awareness, but not to give instructions to make a trade.

Analysis are provided byInstaForex.

Best regards, PR Manager / Learn more about InstaForex Company at http://instaforex.com

Re: InstaForex Analysis

The collapse of the Boeing after another 737 crash

Good evening, dear traders. I present to you the trading idea for Boeing's Stock CFD.

So, yesterday, there was a terrible catastrophe of the Ukrainian Boeing 737 in Iran. Boeing fell shortly after takeoff and all 170 passengers died. Now, for the preliminary version: technical - engine fire. This is not the first crash with a Boeing in recent times. Thus, we recommended selling the shares that were mentioned back in December.

Boeing has a very interesting level of $ 318 from the point of view of hunting for stops. In fact, this is a platform with the feet of buyers of this asset for the entire last year. 737 was discontinued in December, but accidents continued with it. Against this background, we recommend holding short positions in order to break through the level of 319 with a further pull to historical 292:

https://forex-images.ifxdb.com/userfiles/20200109/analytics5e1670134af76.png

Since the opening, the shares have lost $ 4. Therefore, we recommend developing the reduction to the above levels if you are not yet on sale.

Good luck in trading and control the risks!

*The market analysis posted here is meant to increase your awareness, but not to give instructions to make a trade.

Analysis are provided byInstaForex.

Best regards, PR Manager / Learn more about InstaForex Company at http://instaforex.com

Re: InstaForex Analysis

Forecast for GBP/USD on January 10, 2020

GBP/USD
The British pound lost 30 points on Thursday. The price consolidated below the MACD line on the daily chart. The signal line of the Marlin oscillator is falling in the negative trend zone, but not due to the strong dynamics of the pound's decline, the balance indicator line (red) continues to hold the price, further slowing its decline. The continuation of such a tendency - a decrease in the British pound will lead to an increase in bullish sentiment, the market can take advantage of such confusion.

https://forex-images.ifxdb.com/userfiles/20200110/analytics5e17f1f4118b1.png

Data on US employment will be published today, the forecast for new jobs in the non-agricultural sector for December is 162 thousand, this may be an incentive to further pull down the pound to the Fibonacci level of 161.8% at the price of 1.2968. But even in this case, the pound's decline rate may not be enough to overcome the balance indicator line. If it also remains below the price by the opening of Monday, then the correction of the British pound is possible next week. The 1.2968 level is technically strong.

https://forex-images.ifxdb.com/userfiles/20200110/analytics5e17f20998786.png

On the four-hour chart, the price consolidated below the MACD line yesterday - one candle with the whole body was under this line, but at the moment the price is already above the MACD line. Such a false signal is also a sign of a short downward movement, if any (to our target 1.2968). The Marlin oscillator is moving after the price, it is not providing signals. Another price consolidation below the MACD line, as well as under the correction level of 23.6%, will open the nearest target at 1.2968. To move the price to lower targets (1.2820, 1.2730), which are marked on the daily scale, you need a rapid movement of the price down today.

*The market analysis posted here is meant to increase your awareness, but not to give instructions to make a trade.

Analysis are provided byInstaForex.

Best regards, PR Manager / Learn more about InstaForex Company at http://instaforex.com

Re: InstaForex Analysis

Forecast for GBP/USD on January 13, 2020

Quotes of the British pound are held for two days on the indicator line of the balance of the daily scale in red. Overcoming it will allow the price to consistently take the three immediate goals at the Fibonacci levels: 1.2968, 1.2820, 1.2730. The Marlin oscillator is in the decline zone.

https://forex-images.ifxdb.com/userfiles/20200113/analytics5e1bf81c380e6.png

On the four-hour chart, the price overcame the support of the MACD line, but did so with a gap. In this case, with a general declining trend and in the absence of warning reversal signals, the "window" serves as a harbinger of a further fall in prices, but it is not advisable for it to remain open for a long time.

https://forex-images.ifxdb.com/userfiles/20200113/analytics5e1bf831a3742.png

We are waiting for the closure of this gap and a further decline in the British pound. The Marlin oscillator is developing in a declining trend zone.


*The market analysis posted here is meant to increase your awareness, but not to give instructions to make a trade.

Best Regards,PR Manager
InstaForex Companies Group

Posts: 451 to 475 of 1,547

Pages Previous 1 17 18 19 20 21 62 Next

You must login or register to post a reply

Forex Software → Market Analysis → InstaForex Analysis

Similar topics in this forum