forex software

Create and Test Forex Strategies

forex software

Skip to forum content

Forex Software

Create and Test Forex Strategies

You are not logged in. Please login or register.


(Page 15 of 62)

Forex Software → Market Analysis → InstaForex Analysis

Pages Previous 1 13 14 15 16 17 62 Next

You must login or register to post a reply

RSS topic feed

Posts: 351 to 375 of 1,547

Re: InstaForex Analysis

Technical analysis of GBP/USD for 03/07/2019:

https://forex-images.ifxdb.com/userfiles/20190703/analytics5d1c3e69c62f0.jpg

Technical Overview:
The GBP/USD pair has broken below the 61% Fibonacci retracement located at the level of 1.2611 and is heading lower. The next technical support is seen at the level of 1.2559 and 1.2529. The key support is seen at the level of 1.2505 and if this level is violated the downtrend will accelerate. On the other hand, the nearest technical resistance is seen at the level of 1.2605.

Weekly Pivot Points:
WR3 - 1.2870
WR2 - 1.2829
WR1 - 1.2757
Weekly Pivot - 1.2708
WS1 - 1.2629
WS2 - 1.2585
WS1 - 1.2508

Trading Recommendations:
The best strategy for the current market conditions is to buy the corrections in anticipation of the uptrend to resume. This strategy is valid as long as the level of 1.2505 is clearly violated. The larget time frame trend is still down and the recent rally up is the first sign the trend might be reversing. The key long-term technical resistance is seen at the level of 1.2775 and only if this level is violated, there is a chance for the trend reversal.

Analysis are provided byInstaForex.

Best regards, PR Manager / Learn more about InstaForex Company at http://instaforex.com

Re: InstaForex Analysis

AUD/USD: commodity market growth and the "hangover" of dollar bulls

The Australian dollar continues to gain momentum: the AUD/USD pair confidently overcame the key mark of 0.7000 and consolidated in the middle of the 70th figure. For two days, the pair shows a nearly recoilless growth, returning lost positions. It is noteworthy that the aussie turned 180 degrees after the July meeting of the RBA, at which the regulator lowered the interest rate and allowed a further easing of monetary policy. Such an abnormal market reaction is primarily associated with the general weakening of the US currency. In addition, the aussie continues to receive support from domestic data and the commodity market - in particular, the cost of iron ore continues to stay above $100 per ton.

https://forex-images.ifxdb.com/userfiles/20190704/analytics5d1d3d3174121.jpg

And yet the main driving force behind the growth of AUD/USD is a weak greenback. After the unjustified euphoria, which was associated with the outcome of the G20 summit, a regular "hangover" gradually ensues, aggravated by loud statements by top White House officials. The essence of their comments comes down to the fact that, firstly, relief from Washington is more of a formal nature - for example, Chinese technology giant Huawei remains on the United States' blacklist, despite certain concessions processors).

Secondly, the very fact of the truce is under a big question mark - after all, a non-aggression pact was concluded rather than an armistice agreement in Osaka. Today, the White House announced a meeting between US Trade Representative Robert Lighthizer and Chinese Deputy Prime Minister Liu He, which will clear the future prospects for the negotiation process. Washington did not say exactly when this meeting will take place, but noted that it will occur "in the near future."

In general, the initial optimism of traders was replaced by concern and uncertainty that another attempt to find a compromise will be crowned with success. Similar doubts from investors have background pressure on the US dollar. To one degree or another, this also affects the US currency's postions in dollar pairs. Weak macroeconomic reports in the US only exacerbate the position of the greenback. The slowdown is demonstrated by both key and secondary economic indicators.

Take, for example, the latest releases: an indicator of consumer confidence in the US, an indicator of growth in orders for durable goods, a report on the labor market from ADP, regional indicators of production activity — all of these indicators came out in the red zone, not reaching weak forecast levels. Almost every day, US statistics disappoint investors to some extent, and today is no exception. Thus, activity in the service sector slowed to 55.1 points - this is the weakest result since July 2017. The extremely low influx of new orders (this component of the indicator updated a 2.5-year low) caused a decline in employment in this area, having a mediated effect on the overall slowdown in the US labor market.

https://forex-images.ifxdb.com/userfiles/20190704/analytics5d1d3fb9a4c07.jpg

Experts have previously warned that the service sector will begin to slow down after the manufacturing sector, and now, apparently, these predictions are beginning to materialize. By the way, the indicator of production orders published today came out at the lowest values since the summer of 2016. The indicator is actively decreasing for the second consecutive month, and the May indicator was revised downward (-1.2% instead of the previous -0.8%). This fundamental picture does not allow the dollar to develop to feel comfortable, even with continued demand. And together with the Australian dollar, the greenback is losing its position at the expense of the aussie's "independent" growth.

The Australian dollar won back a decline in the interest rate by 0.25% and after the announcement of the expected decision, it began to recover throughout the market. Although Philip Lowe did not rule out further easing of monetary policy, the market focused on current events, pulling up the aussie. First, the strategically important raw material for Australia - iron ore - continues to grow. To date, the cost of a ton of this raw material is already $124 (for comparison, in April this figure was in the level of $80). Secondly, due to the growth in the value of exports of iron ore, Australia recorded a growth in the trade surplus by 16.2% to $4 billion in May compared with April. Judging by the price dynamics of iron ore, the June figures will exceed the May results. High demand for this type of raw materials from Chinese steel mills only confirms this assumption.

https://forex-images.ifxdb.com/userfiles/20190704/analytics5d1d3fcbad17d.jpg

Thus, despite the RBA's dovish position, AUD/USD buyers use the market's current situation to their advantage. Uncertain positions of the US currency against the background of a substantial growth in the commodity market makes it possible for the aussie to open new price horizons. The first resistance level is the mark 0.7060 - this is the upper line of the Bollinger Bands indicator on the daily chart. When it is overcome, the Ichimoku trend indicator will form a bullish "Parade of lines" signal, which will open the way for AUD/USD bulls to the next resistance level of 0.7180 (the top line of the Bollinger Bands indicator is already on the weekly chart). Support is the aussie's key for a 0.7000 mark.

Analysis are provided byInstaForex.

Best regards, PR Manager / Learn more about InstaForex Company at http://instaforex.com

Re: InstaForex Analysis

EUR/USD. Calm before the storm: the market hid in anticipation of the Nonfarm report

Today, the windless weather on the foreign exchange market: the European session was not rich in macroeconomic reports, and the US trading platforms are completely closed: Independence Day is celebrated in the United States. The nearly empty economic calendar allows you to take a wait-and-see position, especially on the eve of Friday's releases, which will certainly provoke strong volatility. It is noteworthy that on the eve of a "stormy Friday" the market ignored a rather alarming signal, which was voiced by US President Donald Trump. He again accused China and Europe of using currency manipulations, also complaining that Washington only obediently observes this process. The Chinese Foreign Ministry has already responded to this statement by Trump, publishing a concise refutation of the voiced accusations. Brussels ignored the words of the American president, although the reaction of Europe would hardly be different from the Chinese.

https://forex-images.ifxdb.com/userfiles/20190705/analytics5d1e8ef58e78c.jpg

On the one hand, the situation has exhausted itself - Donald Trump often voices his thoughts or complaints with the help of Twitter. On the other hand, the concern of the US president about this issue is alarming for some currency strategists (in particular, Bank of America), given Trump's ability to take unconventional steps in his policy. Therefore, after the head of the White House once again accused Europe and China of manipulating currency, experts began saying that the president could initiate the use of currency intervention in the coming months. Analysts estimate the likelihood of this scenario in different ways. But almost all of the economists surveyed by Bloomberg do not exclude such a scenario. Especially - if the Fed in July does not reduce the interest rate, and the ECB, in turn, will prepare the ground for the introduction of additional incentives in the autumn.

As some currency strategists believe, the White House needs a substantial dollar drawdown across the entire market - by 10-20%. In the context of the euro-dollar pair, this means that the price should rise to levels five years ago, to the area of 1.31-1.37, up to level 40. Naturally, this will cause a domino effect - eurozone inflation is not the only thing that will suffer, but the entire EU economy as a whole, after which the ECB will resort to appropriate mitigation measures. But, as they say, "in war - as war": by launching a flywheel of currency manipulations, the White House will understand perfectly well that central banks of other countries will take a defensive position, devaluing their currencies.

As you know, there are several types of interventions, among them sterilized and unsterilized. In the first version of the intervention, the New York Fed will acquire or sell securities on the open market, but will not interfere with monetary policy. Unsterilized intervention directly affects the money supply and rates. And if during sterilized currency intervention the value of the monetary base is maintained, in the second case, the intervention leads to a change in the monetary base. What kind of tool the White House will apply is an open question, and it has become increasingly discussed in the foreign exchange market. According to many analysts, Trump's rhetoric in this regard will only become tougher in the near future.

But the traders actually ignored the important, in my opinion, signal from the US president. The market is focused on the upcoming events, namely the Nonfarm, which will be published tomorrow. According to preliminary forecasts, the growth rate of people employed in the non-agricultural sector will grow to "acceptable" values, that is, to 164 thousand. This is much less than the levels at which the indicator went out during the past year and the first quarter of the current year: the indicator practically did not fall below the 200 thousandth mark, and often exceeded the 300 thousandth level. But compared to May, when the number of employed has grown by only 74 thousand, this result will look quite good - but only if the real figures coincide with the predicted ones.

Let me remind you that, according to the latest ADP report, the number of people employed in June increased by only 102 thousand. This report is the main guideline on the eve of the publication of official data. Given the relatively weak result from ADP, the June Nonfarm may also disappoint traders. In this case, the dollar is unlikely to be able to hold its position and weaken throughout the market. You should also pay attention to the indicator of the average hourly wage, which is an inflationary indicator. On a monthly basis, over the past three months, it has been at the same level - 0.2%. And on an annualized basis, the index in May is minimal, but unexpectedly dropped from 3.2% to 3.1%. In June, wages should demonstrate a positive trend - both in monthly and annual terms. If this forecast is not justified, the US currency will fall under additional pressure.

https://forex-images.ifxdb.com/userfiles/20190705/analytics5d1e8f08dda92.jpg

In general, tomorrow's release either eliminates concerns about the aggressive easing of the monetary policy of the Fed, or, conversely, returns concern about this. In the second case, the EUR/USD pair will get another chance to gain a foothold in the 13th figure, breaking the resistance levels of 1.1305 (the Bollinger Bands average line on the daily chart) and 1.1340 (the Tenkan-sen line on the same timeframe). Otherwise, the bears will finally seize the initiative on the pair, up to the achievement in the medium term, up to the lower limit of the Kumo cloud on D1, that is, to the level of 1.1185.

Analysis are provided byInstaForex.

Best regards, PR Manager / Learn more about InstaForex Company at http://instaforex.com

Re: InstaForex Analysis

EUR/USD. 5th of July. Results of the day. NonFarm Payrolls - the killer of European currencies

4-hour timeframe

The amplitude of the last 5 days (high-low): 42p - 90p - 47p - 44p - 22p.

Average amplitude for the last 5 days: 49p (51p).

The last trading day of the current week has passed with the US currency having full advantage. There was only one reason for this - the publication of the NonFarm Payrolls report for June. Analysts' forecasts predicted 162,000 new jobs outside the agricultural sector, but in reality there were 224,000. Such a strong excess of the real value over the forecast naturally provoked strong purchases of the US dollar and so the US currency rose by 60 points against the euro. Against the background of strong NonFarms, traders ignored unemployment in the United States, which rose to 3.7%, as well as weaker wage growth than originally estimated. However, the key question for the entire currency market now is: do strong NonFarm mean the end of a period of failed macroeconomic statistics in the US or is it just an accident? As we all see, the US dollar has almost completely offset all losses against the European currency, which suffered during the month when reports from the United States could not please even the most ardent optimists. Only 120 points are left to reach the year lows and such a resurrection of the US dollar occurred, by and large, without particularly strong support from the foundation. Now a new question arises: if the macroeconomic statistics ceases to disappoint, the Fed may not soften the monetary policy in 2019, respectively, the main advantage of the euro, which bulls of the euro/dollar pair could plummet into oblivion. What should the euro count on in this case? There is no answer to this question yet, but we state the fact: the US dollar is very close to "returning to the game" and in the near future it will be possible to state the resumption of a downward trend.

Trading recommendations:

The EUR/USD pair resumed its downward movement. Thus, it is now again recommended to sell the euro with the target of 1.1177. At the beginning of the new trading week, new levels of support and resistance will be formed.

It is recommended that you buy the euro/dollar pair not earlier than when prices have consolidated above the Kijun-sen line. However, this will require a strong fundamental basis for the bulls.

In addition to the technical picture should also take into account the fundamental data and the time of their release.

Explanation of the illustration:
Ichimoku indicator: Tenkan-sen - the red line.
Kijun-sen - the blue line.
Senkou Span A - light brown dotted line.
Senkou Span B - light purple dotted line.
Chikou Span - green line.
Bollinger Bands indicator:
3 yellow lines. MACD Indicator:
Red line and histogram with white bars in the indicator window.

Analysis are provided by InstaForex

Best regards, PR Manager / Learn more about InstaForex Company at http://instaforex.com

Re: InstaForex Analysis

Technical analysis of GBP/USD for 09/07/2019:

Technical Market Overview:
The GBP/USD pair has broken through the technical support at the levels of 1.2559, 1.2529 and 1.2505 on its way down to the new swing low made at the level of 1.2476. As we can see the price is now out of the descending channel, which is a very bearish sign. There is a Pin Bar made at the new swing low at the level of 1.2476, but so far there is not much bullish pressure on the market and the bears are still in full control of the market. The nearest technical resistance is located at the level of 1.2559 and it might be tested soon due to the oversold market conditions.

Weekly Pivot Points:
WR3 - 1.2853
WR2 - 1.2772
WR1 - 1.2630
Weekly Pivot - 1.2551
WS1 - 1.2402
WS2 - 1.2319
WS3 - 1.2180

Trading Recommendations:
The best strategy for the current market conditions is to follow the larger timeframe trend. The larger time frame trend is still down and there are no signs of any trend reversal. The key long-term technical support is seen at the level of 1.2431 and the key long-term technical resistance is seen at the level of 1.2775 and only if this level is violated, there is a chance for the trend reversal.

Analysis are provided by InstaForex

Best regards, PR Manager / Learn more about InstaForex Company at http://instaforex.com

Re: InstaForex Analysis

Forecast for USD/JPY on July 10, 2019

USD/JPY
Yesterday and today, the price is testing the strength of the resistance of the embedded line of the price channel at around 109.00. As we expected, the reversal of the signal line of the Marlin oscillator from the border with the territory of the decline on the daily chart took place. Now, the pair USD/JPY needs to overcome this resistance to pass only 25 points to the next resistance on the daily chart – the MACD line, which is an indicator of the current trend.

https://forex-images.ifxdb.com/userfiles/20190710/analytics5d2561073fc2d.png

As seen on the four-hour chart, the growth of the Marlin oscillator slowed down, the price may roll back from the current level. But the general upward trend remains stable – the price is above the balance line (red indicator) and the MACD line. The level of 108.20 in this case is not the goal of a possible correction, it marks the "last line of defense" of the bulls. With the departure of the price below this line, a deeper drop is possible.

https://forex-images.ifxdb.com/userfiles/20190710/analytics5d25612073cb8.png

Analysis are provided byInstaForex.

Best regards, PR Manager / Learn more about InstaForex Company at http://instaforex.com

Re: InstaForex Analysis

EUR/USD. 1-0 in favor of the euro

The US dollar did not rest long on its laurels: after Friday's take-off on strong Nonfarm, today it began to swoop down just as rapidly throughout the entire market. Contrary to the hopes of dollar bulls, the Federal Reserve chief did not revise his position on the prospects for monetary policy and in fact confirmed the previously announced intention to lower the interest rate at the July meeting. The tone of his rhetoric was quite categorical and key messages were not ambiguous. Powell made it clear that the Fed is ready to ease monetary policy, and will proceed to this step in the very near future.

The key message of the Fed head is that the US economy is in a strong form, but assistance from the regulator is needed in order to maintain it - in the form of lower interest rates. Throughout his speech, he cited facts arguing this idea. In general, despite the fact that Powell has positively assessed the state of the US economy, he expressed serious concern about its prospects.

https://forex-images.ifxdb.com/userfiles/20190711/analytics5d2675d4d7c6c.jpg

The head of the US Federal Reserve noted that after the June Fed meeting (at which, in fact, the dovish intentions of the regulator were announced), the overall uncertainty only increased. Powell actually offset the optimism of traders associated with the outcome of the US-China talks in Osaka. He said that a truce is certainly a positive signal, but in general the situation has not changed. Global trade conflicts, according to Powell, have slowed the economic momentum in many countries, and this fact has a negative effect on the US economy. A temporary truce, unfortunately, does not solve these problems. Denoting problems of a global nature, Powell also mentioned Brexit (which is likely to follow the "hard" scenario), as well as the issue of federal debt.

As for internal problems, the key "headache" of the Fed is inflation. According to Jerome Powell, inflation continues to be weak, and this weakness may be more stable and systemic. It is worth recalling that during the first half of the year, the Fed chief assured investors that the slowdown in key inflation indicators is a temporary phenomenon, and that the situation will change for the better in the second half of the year. Now Powell is by no means certain of that.

According to him, the latest indicators of wage growth are "very weak" for accelerating inflation (the June figures were in the red zone, not reaching the forecast values). Early inflation indicators suggest that inflationary pressure will remain muted this year. The latest published releases were really not in favor of the dollar. For example, the indicator of consumer confidence in Americans slumped to two-year lows, and the volume of orders for durable goods disappointed traders with negative dynamics. The indicator remained in the negative area (-1.3%), thus continuing the April trend. It is also worth noting the fall in business investment, the slowdown in global growth and the decline in investment in housing and manufacturing. I'm not even talking about the release of the consumer price index (general and pivotal), which also showed weak growth.

In other words, Powell's dovish position looks quite justified. It even "got" to the US labor market, which showed growth last Friday. Powell stated a fact, but noted that for many residents of the United States, this growth was "uneven". He voiced the structure of Nonfarms, according to which Asians and whites found work more often, unlike African Americans and Latin Americans. Powell also assured Congress that the labor market is not "overheated", and therefore there is no need to restrain with high rates.

https://forex-images.ifxdb.com/userfiles/20190711/analytics5d2675e7d1aea.jpg

Thus, Jerome Powell made it clear that the Fed will cut interest rates by 25 basis points at the end of this month. But the next steps of the regulator will depend on the incoming data, above all - inflation. The head of the Fed has mentioned that the real numbers may show a lower result relative to the preliminary forecasts of the regulator. In this case, he assured members of Congress that the Fed "will use all its means to keep economic growth and key indicators in the right path." In other words, inflation indicators will particularly strongly influence the dollar position - and in this context, tomorrow's release can cause increased volatility for the EUR/USD pair.

We are talking about the publication of data on the growth of US inflation. The overall consumer price index should show a negative trend, dropping to 1.6% in annual terms and down to zero - on a monthly basis. Core inflation, excluding prices for food and energy, can demonstrate minimal growth in monthly terms (from 0.1% to 0.2%) and remain at the same level (2.0%) in annual terms. If the real numbers are below fairly weak forecast values, the dollar may again fall under the wave of sales.

Tomorrow, Powell will continue his speech in the US Congress - this time in the Banking, Housing and Urban Affairs Committee. Today's round of "correspondence" has ended in favor of the euro. On Thursday, EUR/USD bulls can consolidate their results and enter the area of the 13th figure, hinting at the restoration of the upward trend.

Analysis are provided byInstaForex.

Best regards, PR Manager / Learn more about InstaForex Company at http://instaforex.com

Re: InstaForex Analysis

EUR/USD: US inflation drowned out the upward impulse

Data on the growth of US inflation was very controversial. The general consumer price index showed mixed dynamics: on a monthly basis, it remained at the level of May (that is, at the level of 0.1%) with the forecast of decline to zero. In annual terms, the index came out in accordance with the forecast, being at the level of 1.6% (previous value - 1.8%). But core inflation has pleased investors with minimal growth. On a monthly and annual basis, CPI turned out to be better than forecast, coming out in the "green zone" (0.3 m/m and 2.1% y/y)

After the release of this report, the market hesitated for a while - on the one hand, the inflation rate was pleasantly surprising (especially the base one), on the other hand, the growth of the main indicators was minimal. But an hour later, the market decided that "the glass was half full" than vice versa, and so the US currency gradually began to restore its position. The dollar index moved away from lows of the day (and week), rising from 96.417 to the current value of 96.620. Although the growth of the greenback is not of a large scale, this situation indicates that the upward impulse of the EUR/USD pair is too unsteady and uncertain, and the dollar, in turn, retains the potential for further growth. After Powell's pessimistic comments and the release of the dovish Fed minutes, such dynamics from the greenback looks abnormal. But if we consider this situation in terms of market expectations, many things fall into place.

By and large, the Fed follows the expectations of the market, and to be more precise, it prepared the traders fairly smoothly and well in advance for their further steps. Representatives of the dovish wing of the Fed (James Bullard, Rafael Bostic, Lael Brainard) first spoke about the need to mitigate monetary policy. Then the likelihood of such a scenario did not exclude Jerome Powell, however, as a necessary (extreme) measure. Over the coming weeks, the Fed chief strengthened the dovish tone, allowing for a rate cut this year. In the end, at its June meeting, the Fed excluded from the text of the accompanying statement the phrase "showing patience" regarding the prospects for monetary policy, thus opening the door to the first rate cut. Thus, the probability of monetary policy easing gradually grew and reached almost 100% at the end of last month. Moreover, the market began to exaggerate information that the Fed would reduce the rate immediately by 50 basis points or start a rate reduction cycle (one decrease in July, one more in the fall). Against the background of such conversations, the dollar has noticeably weakened - in particular, the EUR/USD pair even tested the 14th figure for the first time since March of this year.

But strong Nonfarm weakened the fears of traders about an aggressive rate cut. At the same time, the likelihood of a July decline was still preserved. That is why the dollar relatively calmly survived Jerome Powell's unambiguously dovish report to Congress. Despite the clear hints of the Fed, the dollar just moved away from annual lows against the euro, but buyers could not even enter the area of the 13th figure. The thing is that the market was ready for the July rate cut - the only question was how aggressive the Fed's actions would be after this "preventive" step. In turn, today's data on inflation has suggested that the Fed will take a wait-and-see position following the decline in July.

In other words, the Fed has been preparing the markets for monetary policy easing for quite a long time. Therefore, the Fed chief's semi-annual report did not provoke a large-scale weakening of the dollar. If we talk about the EUR/USD pair, in this case, Powell only interrupted the downward trend and allowed the pair's bulls to go for a correction, the "ceiling" of which is 1,1300. This ceiling is not only due to the growth of core inflation in the United States.

The single currency is also under pressure from the fundamental background, primarily from the ECB. So, the minutes of the last meeting of the European regulator was released today, which demonstrated the dovish intentions of the ECB. In the opinion of the members of the Governing Council, the regulator needs to prepare for easing monetary policy in view of the reduction in inflation expectations. Almost all representatives of the ECB agreed that the central bank needed to change its position, demonstrating readiness for "retaliation". Arsenal of possible measures includes both the resumption of QE and lower interest rates. It is not known what algorithm of actions the regulator will choose for itself, but at the same time it is obvious that the ECB will take the path of easing monetary policy - just like the Fed.

This fact limits the potential correctional growth of the EUR/USD pair. The first resistance level is the mark of 1,1285 (the middle line of the Bollinger Bands indicator on the daily chart, which coincides with the Tenkan-sen line). Today, the pair has reached this level, but was unable to break through it, and after the publication of the US CPI, it retreated to the level of today's opening. Just above - at around 1.1300 - is the next resistance level, which corresponds to the Kijun-sen line. But if the demand for the dollar will increase (especially if tomorrow's producer price index will be released in the "green zone"), then the pair will most likely return to the base of the 12th figure, namely, to the support of 1.1205, which corresponds to the lower Kumo cloud on D1.

Analysis are provided by InstaForex

Best regards, PR Manager / Learn more about InstaForex Company at http://instaforex.com

Re: InstaForex Analysis

Is gold going higher and higher and higher?

After many years of waiting, the hopes of investors who invest in gold were finally rewarded, as gold showed an impressive trend in the first half of 2019, which was caused by several reasons. Is it worth it to invest money in gold now and is it time to take profits to those who bought gold from the levels of $1,300, we will analyze in this article.

If we consider gold from the point of view of distant investment horizons, then investors should have no questions at all. Regardless of the behavior of gold in the derivatives market, it should be in the portfolio of each investor in a volume of up to 20% or more if the portfolio is denominated in reserve currencies. Even if gold falls short in price in the short term, it should be taken as the foundation of a house: you don't want to bury money in the ground, but you have to, because you need to build a house on stone and not on sand. Moreover, in the long run, gold is the most profitable asset in any currency.

Since 2001, gold has increased by five times in price against the dollar. The price of gold was $287 per troy ounce on September 11, 2001 but now gold is worth $1,415. Over the same period, investments in S&P 500 stocks, inflated from free money in the last ten years, have brought a yield of "just" 2.8 times the return - it was 1,050, it was 3,000. No one argues, 285% is good, but you have to agree that 500% is better, and if you take 2008-2009, then there were no questions at all as to where money should be invested - in gold or shares.

https://forex-images.ifxdb.com/userfiles/20190716/analytics5d2d0a173c58e.jpg

It seems to me that the best investment in order to save money for retirement or the education of children will be an investment in gold coins. Yes, there are periods of recession, but long-term gold is a very stable and profitable asset. Over a period of 20 years, gold gives an annual increase of 8% on invested capital.

Of course, it's easy to talk about a distance of two decades, it's more difficult to figure out shorter periods, but we'll try. If we talk about the current time, then, according to the World Gold Council, now the following factors influence the situation:

Financial market uncertainty and adaptive monetary policies are likely to support investment demand for gold; Price momentum and positioning can stimulate rallies and create kickbacks, as investors constantly revise their expectations based on new information; Weaker economic growth in the near term could soften consumer demand for gold, but structural economic reforms in India and China are likely to support long-term demand.

Regarding monetary policy easing, Federal Reserve Chairman Jerome Powell and the Open Market Committee now occupy a balanced policy and would rather prefer not to lower the rate at the next meeting, which will be held in late June. However, markets literally force the Fed to do this, suggesting a 100 percent likelihood of such a move. As the analysis conducted by the World Gold Council shows, the US Federal Open Market Committee conducted a rate change whenever more than 65% of traders expected such a move from it (Fig. 1).

https://forex-images.ifxdb.com/userfiles/20190716/analytics5d2d0c40c9827.jpg

Figure 1: Changes in the Fed's monetary policy in line with market expectations. Source: World Gold Council

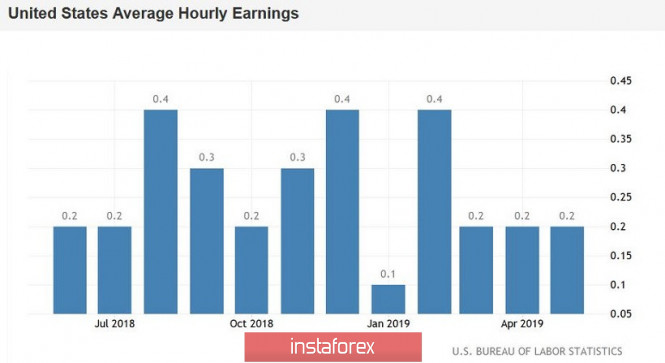
Despite good inflation data (core inflation rose to 2.1% in June) and excellent unemployment data, the Fed is unlikely to decide to go against the will of the markets and leave the rate unchanged. In turn, the rate reduction is negative for the US dollar, which will lose 0.25% of potential, which is very likely to lead to a decrease in the dollar against a basket of major reserve currencies. At the same time, the US dollar has a 90 percent negative correlation with the US dollar. Earlier, in 2010 - 2015, gold significantly correlated with the yen, but later began to correlate with the euro and the dollar, in turn, the correlation with the yen had decreased.

Speaking about the factors that highly affect the price of gold, it is necessary to note the demand of exchange-traded funds - ETF - and the positioning of Money Manager speculators in the futures market. They are the main buyers of gold, and it is the influx of money to the derivatives market that determines the medium and short-term price dynamics. By volume, the COMEX-CME conglomerate is the largest exchange for trading gold and its derivatives, followed by London and Shanghai.

From June 1, Open Interest, which characterizes the influx of new money into the market, grew by more than a quarter and for the first time in history exceeded the level of 1 million contracts. However, in July, the process slowed down somewhat and has stabilized at this point. Some traders preferred to take profits, which resulted in a slight decrease in OI to 1.01 million. Speculators, after the explosive growth of May-June, also slightly reduced their long positions, which currently amount to 241 thousand contracts. At the same time, short positions of speculators remain at the lowest values of 24.3 thousand contracts (Fig. 2), which does not indicate their desire to sell gold against its trend. Therefore, wishing to open a short position in gold should not be smarter than the market. Traders need to be with the market, and if you call yourself a speculator, then you must act together with the Money Manager, and not against them.

https://forex-images.ifxdb.com/userfiles/20190716/analytics5d2d0c5322041.jpg

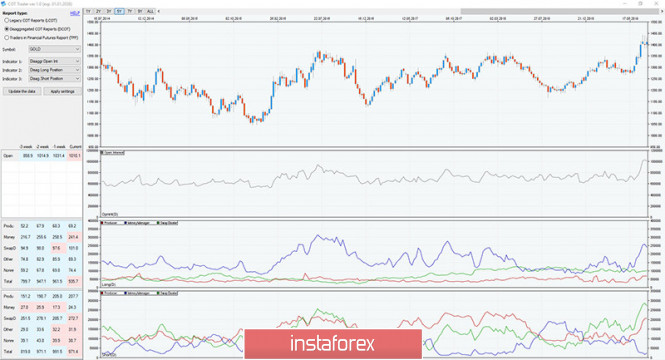
Fig.2: Position of traders in the COT report. Source Commodity Futures Commission - CFTC

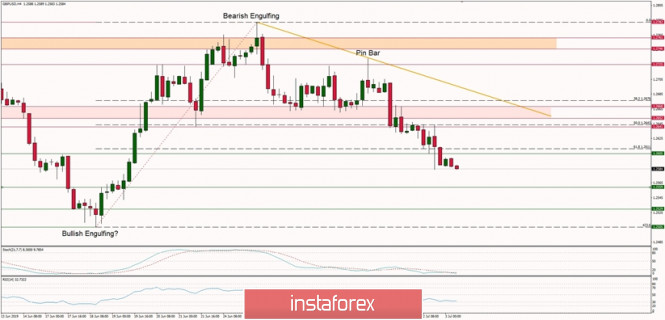
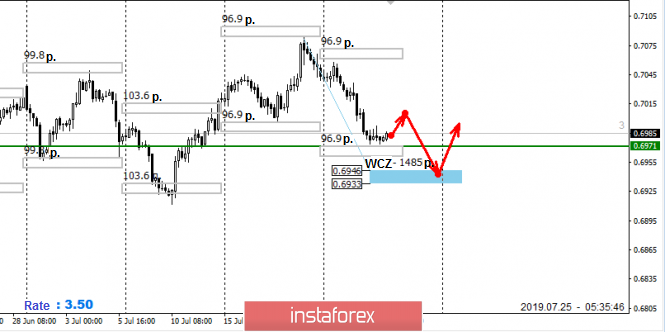
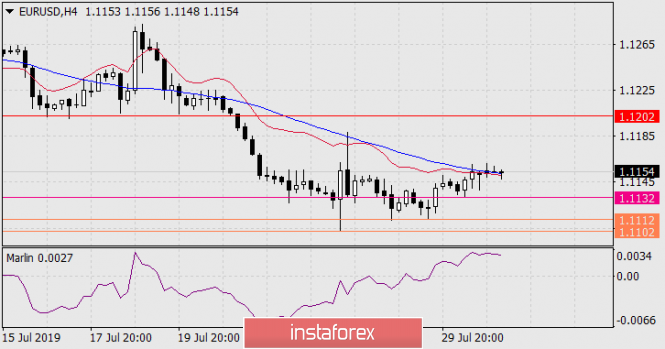
Based on the above factors, as well as technical analysis, it can be assumed that the range of 1380-1435, formed by the price of gold in the previous three weeks, is more likely a continuation figure than a reversal figure. In this case, in the event of growth, gold has every change to reach the level of $1500 and continue further upward movement.

However, if the Fed does not lower the rate, which is now highly unlikely, or Jerome Powell's comments on future monetary policy prospects will lead to an increase in the US dollar, there is some small chance that gold could fall to $1,375-$1,350. In this case, traders should remember that "Murphy's Law" says that if trouble can happen, it will happen, it will be realized on the markets with an enviable constancy. In this regard, no need to make exceptions to the rules of money management and open positions that you can not afford to lose.

Analysis are provided byInstaForex.

Best regards, PR Manager / Learn more about InstaForex Company at http://instaforex.com

Re: InstaForex Analysis

EUR/USD: potential decline to 1.1170 and a "powder keg" for dollar bulls

Bears of the EUR/USD pair managed to overcome the support level of 1.1230, which corresponded to the Kumo cloud boundaries on the daily chart, and then headed towards the 11th figure - or more precisely, to the next support level of 1.1170 (the bottom line of the Bollinger Bands indicator on D1). The overall market situation is unequivocally negative for the euro and fairly neutral for the dollar. However, today the US currency received support from retail sales in the US, while the single currency received another blow from the German statistics.

Thus, the euro was pressured by figures from the ZEW Institute. In particular, the sentiment index in the business environment of Germany dropped immediately to the level of -24.5 points - this is the most negative result since last November. Analysts expected a negative trend, but, according to their forecasts, the indicator should have dropped to -22.7 points. In Europe as a whole, this indicator also remained at semi-annual lows, having stood at -20.3 points. At the same level, the indicator was released last month. After the surge of optimism in April, when for the first time in 2 years, both in Germany and in the EU as a whole, they were above zero, this dynamic looks depressing, and this fact had a corresponding impact on the single currency. Judging by the rhetoric of members of the ECB, the central bank is ready to use its whole arsenal of available actions in the fall. In particular, we are talking about the bond purchasing program and reducing the interest rate. Not so long ago, the head of the ECB acknowledged that many of the early indicators warn of a worsening situation in the eurozone, so the risks for forecasts remain downward.

By the way, tomorrow's data on the growth of European inflation may put additional pressure on the euro if they are revised downward. We will know the final data for June. According to initial estimates, the overall consumer price index rose to 1.2%, while the core index rose to 1.1%. According to the general opinion of experts, core inflation will be subject to revision - the indicator can be reduced to 1%. In this case, bears of the EUR/USD pair will have another reason to sell the single currency, and the price will certainly be consolidated within the 11th figure.

Moreover, the greenback's growth is fueled by fairly good statistics from the United States. Today, dollar bulls have pleased retail sales. Contrary to negative forecasts, indicators of consumer activity have not decreased, but in fact remained at the level of the previous period. The overall figure, as well as the figure excluding car sales, grew in June by 0.4% (with a decline forecast to 0.1%). Excluding auto and fuel sales, the indicator has been growing for the second month in a row, reaching 0.7%. Against the background of the growth of key macroeconomic indicators (strong Nonfarm and positive dynamics of inflation), these figures have provided significant support to the dollar. I note that Jerome Powell, in the course of his speeches and without this release, stated the intensification of consumer activity. He associated the main risks for the Fed with other factors (first of all, we are talking about geopolitical risks and reducing the volume of business investments).

Nevertheless, today's release made it possible for dollar bulls to once again show character - in almost all pairs, the greenback strengthened their positions, and the EUR/USD pair was no exception. In general, the dollar is gradually gaining momentum throughout the market, and either Powell or Trump can hinder this process. Here it is necessary to emphasize the fact that the Fed's July interest rate cut is largely taken into account in prices, so any reminder about this on the part of the US central bank's members is quite calmly perceived by the market. Dollar bulls fear only aggressive rates of monetary policy easing - for example, a one-time cut in the rate by 50 basis points or the beginning of a decline cycle. The "precautionary" rate cut of 0.25% was largely played by the market, especially after the Fed head's dovish speech in Congress, during which he actually announced the relevant intentions of the regulator.

In my opinion, the greatest danger to the dollar is not the Fed, but Donald Trump, who repeatedly expressed outrage at the overvalued exchange rate of the national currency. According to Bloomberg, the US president has already instructed his advisers to develop a strategy to weaken the dollar. According to insider sources, Larry Kudlow, the chief economic adviser to the president, and Stephen Mnuchin, the minister of finance, opposed any US intervention to weaken the greenback. But according to Trump, an overly expensive dollar is almost the key obstacle to a country's economic growth. In turn, economic growth, according to the head of the White House, should provide him with a second presidential term. Here it is worth noting that the overwhelming majority of opinion polls are giving a definite advantage to former Vice-President Joe Biden. Even the Fox News channel, which clearly sympathizes with Trump, acknowledged this fact. According to their polls, Trump is almost 10% behind Biden.

Thus, good news for dollar bulls is that the greenback has acquired "immunity" regarding the Fed's stated intentions to cut the rate by 25 points (and more aggressive measures are unlikely to be applied). In addition, US statistics also provide background support for the dollar. The bad news is that Trump may initiate currency interventions, especially if the US currency continues to rise in price across the entire market. Taking into account such (possible) perspectives, dollar bulls sit on a "powder keg", which can jerk at any moment.

From a technical point of view, the EUR/USD pair has the potential to fall to the bottom line of the Bollinger Bands indicator on the daily chart, which corresponds to the mark of 1.1170. If the bears overcome this support level (which is unlikely within the next few days), the pair will head to the bottom of the 11th figure, that is, to the bottom line of the Bollinger Bands indicator on the weekly chart.

Analysis are provided by InstaForex

Best regards, PR Manager / Learn more about InstaForex Company at http://instaforex.com

Re: InstaForex Analysis

AUD / USD vs USD / CAD vs NZD / USD vs #USDX. Comprehensive analysis of movement options from July 18, 2019. Analysis of APLs & ZUP

Minuette (H4)
Let us consider the comprehensive options for the development of the AUD / USD vs USD / CAD vs NZD / USD vs #USDX movement from July 18, 2019 in the Minuette operational scale (H4 time frame). ____________________
US Dollar Index
On July 18, 2019, the development of the movement of the dollar index #USDX will be determined by the direction of the range breakdown :
- resistance level of 97.50 (lower boundary of the ISL38.2 equilibrium zone of the Minuette operating scale fork);
- support level of 97.20 (1/2 Median Line channel of the Minuette operating scale).

The breakdown of the support level of 97.20 (1/2 Median Line Minuette) will cause the downward movement of the dollar index to continue to the targets - the initial SSL line (97.00) of the Minuette operational scale fork - the lower boundary of ISL38.2 (96.90) of the Minuette operational scale - local minimum 96.75 - and as an option - to reach the upper boundary of the 1/2 Median Line channel Minuette (96.20).

In case of the breakdown of the lower boundary of ISL38.2 Minuette (resistance level of 97.50), the development of the #USDX movement will continue in the equilibrium zone (97.50 - 97.63 - 97.80) of the Minuette operational scale, and if ISL61.8 Minuette (97.80) will be broken down, then it would be important to continue the upward movement of the dollar index to the final Schiff Line Minuette (98.00), with the prospect of reaching the final FSL Minuette line (98.35).

The details of the options for movement #USDX on July 18, 2019 are presented at the animated graphics.

https://forex-images.ifxdb.com/userfiles/20190717/analytics5d2f338e22018.jpg

Australian dollar vs US dollar
The development of the movement of the Australian dollar AUD / USD from July 18, 2019 will be determined by the working out and direction of the breakdown of the 1/2 Median Line channel borders (0.7000 - 0.7015 - 0.7040) of the Minuette operating scale.

The breakdown of the upper boundary of the 1/2 Median Line Minuette channel (resistance level of 0.7040) will determine the development of the AUD / USD movement in the equilibrium zone (0.7040 - 0.7060 - 0.7085) of the Minuette operating scale with the prospect of reaching the final Schiff Line Minuette (0.7100).

In case of breakdown of the lower boundary of the 1/2 Median Line channel ( support level of 0.7000), the operational scale of the Minuette operational scale fork will become topical for the Australian dollar to reach the 1/2 Median Line channel (0.6985 - 0.6965 - 0.6940) of the Minute operating scale with the possibility of updating the minimum of 0.6912.

The details of the options for the movement of AUD / USD from July 18, 2019 can be seen at the animated graphics.

https://forex-images.ifxdb.com/userfiles/20190717/analytics5d2f33a969679.jpg

New Zealand Dollar vs US Dollar The development of the movement of the New Zealand dollar NZD / USD from July 18, 2019 will be determined by the direction of the range breakdown :
- resistance level of 0.6725 (lower boundary of the ISL38.2 equilibrium zone of the Minuette operating scale fork);
- support level of 0.6710

The breakdown of the resistance level of 0.6725 (ISL38.2 Minuette) will confirm the development of the movement of the New Zealand dollar in the equilibrium zone (0.6725 - 0.6755 - 0.6785) of the Minuette operational scale fork with the possibility of reaching the final FSL line (0.6845) of the Minuette operational scale.

On the other hand, in the event of the breakdown of the support level of 0.6710, the movement of the NZD / USD will continue to the 1/2 Median Line channel (0.6710 - 0.6688 - 0.6666) Minuette operational scale fork with the possibility of the continuation of this movement (after the breakdown of the support level of 0.6666) is already in the zone of equilibrium (0.6688 - 0.6640 - 0.6595) Minuette operational scale fork.

The details of the options for the movement of NZD / USD from July 18, 2019 are presented at the animated graphics.

https://forex-images.ifxdb.com/userfiles/20190717/analytics5d2f33c9a9ccd.jpg

US Dollar vs Canadian dollar.
Range Breakdown Direction :
- resistance level of 1.3085 (the lower boundary of the 1/2 Median Line channel of the Minuette operational scale);
- support level of 1.3050 (boundary of the red zone of the Minuette operational scale fork); will begin to determine the development of the movement of the Canadian dollar USD / CAD from July 18, 2019.

After the support level of 1.3050 breaks down at the boundary of the Minuette operational scale fork, the development of the movement of the Canadian dollar will continue to the goals - local minimum 1.3017 - control line LTL (1.2985) of the Minuette operational scale - warning line LWL38.2 (1.2915) of the Minuette operational scale fork.

As a result of the breakdown of the resistance level of 1.3085, the development of the movement of the Canadian dollar will continue in the 1/2 Median Line Minuette channel (1.3085 - 1.3115 - 1.3140), and during the breakdown of the upper boundary (1.3140) of this channel, it will be possible to reach the boundaries of the equilibrium zone of USD / CAD (1.3165 - 1.3215 - 1.3260) Minuette operating scale.

The details of the options for the movement of USD / CAD from July 18, 2019 can be seen at the animated graphics.

https://forex-images.ifxdb.com/userfiles/20190717/analytics5d2f33eb188aa.jpg

The review was compiled without regard to the news background. The opening of trading sessions of the main financial centers does not serve as a guide to action (placing orders " sell " or " buy ").

The formula for calculating the dollar index is
USDX = 50.14348112 * USDEUR0.576 * USDJPY0.136 * USDGBP0.119 * USDCAD0.091 * USDSEK0.042 * USDCHF0.036.

where power ratios correspond to the weights of currencies in the basket:
Euro - 57.6%;
Yen - 13.6%;
Pound sterling - 11.9%;
Canadian dollar - 9.1%;
Swedish krona - 4.2%;
Swiss franc - 3.6%.

The first coefficient in the formula gives the index value to 100 on the starting date - March 1973, when the main currencies began to be freely quoted relative to each other.

Analysis are provided byInstaForex.

Best regards, PR Manager / Learn more about InstaForex Company at http://instaforex.com

Re: InstaForex Analysis

Forecast for USD / JPY pair on July 22, 2019

USD / JPY pair
The technical picture of our last review (July 18) was fully realized. The price worked out the range 107.35 / 87 indicated with a gray rectangle on the four-hour chart. The signal line of the Marlin oscillator on the same scale has once again touched the generator line of convergence. This creates a double convergence, after which it returned above the signal level 107.87.

https://forex-images.ifxdb.com/userfiles/20190722/analytics5d3530b741367.png

On the daily chart, the departure of the signal line is under the border with the territory of decline. Also, according to our forecast, it turned out to be false. At the moment, Marlin's daily is already in the growth zone. The price is higher than the indicator line of balance, which indicates a shift in the price balance to the upside over the past 90 days based on the calculations by the indicator. Its immediate goal is the area of the MACD line and the price channel line of 108.70. The price yield above the resistance opens up the prospect of growth to the upper line of the channel at 109.70.

https://forex-images.ifxdb.com/userfiles/20190722/analytics5d35300aee868.png

*The market analysis posted here is meant to increase your awareness, but not to give instructions to make a trade.

Analysis are provided byInstaForex.

Best regards, PR Manager / Learn more about InstaForex Company at http://instaforex.com

Re: InstaForex Analysis

Forecast for AUD / USD pair on July 23, 2019

AUD / USD pair
The Australian dollar is falling for the third day. we decided to update the price channels: the dark blue channel of the daily scale chart and the red channel of weekly. The convergence of the daily timeframe proved to be effective and the Marlin oscillator signal line clearly intends to move to the zone of decline. The immediate goal of the "Australian" is 0.6945, which averaged estimate of support for the price channel line and the MACD indicator line.

https://forex-images.ifxdb.com/userfiles/20190723/analytics5d36825fcf69c.png

On the four-hour chart, the Marlin signal line after convergence is already in the zone of decline. The price went below the balance line and MACD this morning. We are waiting for the price in the area of the specified goal at 0.6945.

https://forex-images.ifxdb.com/userfiles/20190723/analytics5d3682768732b.png

*The market analysis posted here is meant to increase your awareness, but not to give instructions to make a trade.

Analysis are provided byInstaForex.

Best regards, PR Manager / Learn more about InstaForex Company at http://instaforex.com

Re: InstaForex Analysis

False start: EUR/USD pair slumped to 1.1150 amid dovish rumors about ECB intentions

Against the background of an empty calendar, the EUR/USD pair unexpectedly demonstrated a downward impulse, testing support for 1.1150 (the bottom line of the Bollinger Bands indicator on the daily chart). By and large, traders today started "ahead of schedule" to recoup the hypothetical results of the ECB July meeting, which will be held on Thursday.

https://forex-images.ifxdb.com/userfiles/20190724/analytics5d379f3a665a4.jpg

First of all, it is worth noting that, reacting so violently to dovish rumors, the EUR/USD bears drive themselves into a trap of high expectations: if the European regulator does not justify bearish hopes, the pair can shoot back, as has repeatedly happened in similar situations. In any case, today's decline should be treated with caution, given the informational unreliability of fundamental factors. Obviously, at the moment, EUR/USD traders follow the principles of "sell on rumors, buy on facts". So far, investors are selling the pair at a heightened pace, but if the rumors spread do not materialize on July 25, the pair will be just as actively bought.

By and large, the single currency became a victim only of the assumption that the European Central Bank will soften the parameters of monetary policy at the next meeting, that is, the day after tomorrow. Such rumors appeared following the monthly report of the Bundesbank published yesterday and the updated forecast of the International Monetary Fund published today. The essence of the published documents is that the economic situation will only worsen in the foreseeable future and, therefore, the leading central banks of the world should prepare for appropriate response actions.

Thus, according to the information of the German central bank, the German industry showed a decline in the second quarter of this year (continuing the negative trend of the first quarter), while the high probability of a hard Brexit slows down the export sector of the country, which was already under pressure from global trade conflicts. According to monthly data, the volume of industrial production in Germany (seasonally adjusted) rose by only 0.3% in May, while the estimate for April was revised downward to -2%. In annual terms, the volume of industrial production in Germany declined by 3.7% at once. In general, leading indicators, including the volume of production orders, suggest that the German economy in the second quarter will demonstrate a dismal result, especially against the background of growth at the beginning of the year. After the publication of this report, some experts suggested that this document will affect the decisiveness of ECB members regarding the launch of new incentives and further easing of monetary policy.

https://forex-images.ifxdb.com/userfiles/20190724/analytics5d379f4d2bcd0.jpg

Today's IMF report also added fuel to the fire. For the fourth time in a row, the Fund's analysts lowered forecasts for global GDP growth - this time the figure was revised from 3.3% to 3.2%. In addition, in the July review of the world economy, the IMF estimated the prospects for economic growth in some countries of the world. In particular, the forecast for the current year was slightly reduced for Germany (which is consistent with the findings of the Bundesbank), but remained unchanged for France and Italy. The growth forecast for the Chinese economy in 2019-2020 was reduced by 0.1 percentage points to 6.2% and 6%, respectively. It is noteworthy that the forecast for the growth of the American economy was revised by IMF economists upward (by 2019) by 0.3%, that is, to 2.6%. This factor served as an additional factor supporting the dollar amid falling fears about the "too dovish" actions of the Fed at the July meeting.

But regarding the possible actions of the ECB for EUR/USD traders, the opposite opinion is completely different. So, according to some analysts polled by Bloomberg, the European regulator can divide the monetary policy easing process into two phases, lowering the interest rate at the July meeting further into the negative area, and resuming the quantitative easing program at the September meeting. According to other analysts (of which the majority), Mario Draghi at the July meeting only announces a large-scale softening of the parameters of monetary policy, but he will start taking real steps in the autumn, before his resignation.

In my opinion, the regulator will not be in a hurry with its actions in July, and the market is now "in advance" playing out the dovish intentions of the ECB. In addition, the EUR/USD pair is also falling due to the growth of the dollar index. The US currency is growing on market confidence that the Fed will limit itself to a "warning shot" in the form of a one-time rate cut of 25 basis points. This fact has already been taken into account in the prices since the moment Jerome Powell spoke in Congress. The vast majority of the Fed members who spoke last week before the unofficial "silence regime" (10 days before the Fed meeting) made it clear that the regulator does not intend to take the path of aggressive rate cuts - after the July decline, the Fed is more likely to take a wait-and-see position. Naturally, this fact will not please the White House - but so far traders are guided only by the declared intentions of the US central bank, and not by Trump's hypothetical plans to devalue the national currency. Therefore, the dollar is growing "on all fronts" today, reinforcing the EUR/USD pair's downward trend.

https://forex-images.ifxdb.com/userfiles/20190724/analytics5d379f5eebdd4.jpg

At the time of this writing, the euro-dollar pair was unable to overcome the lower line of the Bollinger Bands indicator (1.1150) due to the attenuation of the downward impulse. If in the near future, bears of the pair do not receive additional support from the information field (which is unlikely), the pair will continue to drift in the price range of 1.1150-1.12230 (where 1.1230 is the lower boundary of the Kumo cloud at D1), until the ECB meeting on which Mario Draghi will dot the i.

Analysis are provided byInstaForex.

Best regards, PR Manager / Learn more about InstaForex Company at http://instaforex.com

Re: InstaForex Analysis

Control zones AUDUSD 07.25.19

Today's trading plan should take into account the approach of the pair to the average value of the weekly move. Sellers need to close a short position and expect a corrective pullback. The test of the average move can allow to obtain favorable prices for the purchase of an instrument in the case of the formation of a "false breakdown" pattern of yesterday's minimum.

https://forex-images.ifxdb.com/userfiles/20190725/analytics5d391ec25094f.png

The probability of closing trades within the average move is 70%, so sales near the zone are not profitable. It is necessary to take into account that the descending model remains a priority, as the weekly CZ of 0.6946-0.6933 has not yet been reached. An alternative model will be to go beyond the average weekly turn for the test of the specified zone. This will allow to get favorable prices for the purchase of a tool, since the probability of returning to the middle course is 90%.

https://forex-images.ifxdb.com/userfiles/20190725/analytics5d391ef414841.png

Daily CZ - daily control zone. The area formed by important data from the futures market, which change several times a year. Weekly CZ - weekly control zone. The zone formed by important marks of the futures market, which changes several times a year. Monthly CZ - monthly control zone. The zone, which is a reflection of the average volatility over the past year.

Analysis are provided byInstaForex.

Best regards, PR Manager / Learn more about InstaForex Company at http://instaforex.com

Re: InstaForex Analysis

#USDX vs GBP / USD H4 vs EUR / USD H4. Comprehensive analysis of movement options from July 26, 2019. Analysis of APLs & ZUP

Let us consider the comprehensive analysis of the options for the development of the movement of currency instruments #USDX vs EUR / USD vs GBP / USD from July 26, 2019.

Minuette (H4)
____________________

US dollar Index

The movement of the dollar index #USDX from July 26, 2019 will result depending on the direction of the range breakdown :
resistance level of 97.75 (starting line SSL for the Minuette operating scale fork);
support level of 97.55 (upper boundary of the 1/2 Median Line channel of Minuette)

The breakdown of the upper boundary of the 1/2 Median Line channel of Minuette (support level of 97.55) will determine the development of the #USDX movement in the 1/2 Median Line channel of Minuette (97.55 - 97.45 - 97.35), and during the breakdown of the lower boundary (97.35) of this channel, the downward movement of the US dollar index can be extended to the median line (97.25) of the Minuette operating scale forks and the equilibrium zone (97.21 - 97.05 - 96.88) of the Minuette operational scale forks.

On the other hand, in case of breakdown of the resistance level of 97.75 on the SSL start line, the Minuette operational scale forks will be followed by updating the local maximum 97.82. After that, the upward movement of #USDX can continue to the targets - the UTL Minuette control line (97.95) - the UWL61.8 Minuette warning line (98.10).

The details of the #USDX movement are shown in the animated graphics.

https://forex-images.ifxdb.com/userfiles/20190725/analytics5d39de30ab2f4.jpg

____________________
Euro vs US dollar

Similarly in the case of the dollar index, the development of the movement of the single European currency EUR / USD from July 26, 2019 will be due to the direction of the range breakdown :

resistance level of 1.1160 (the lower boundary of the 1/2 Median Line channel of the Minuette operational scale fork);
support level of 1.1121 (starting line SSL for the Minuette operating scale).

The breakdown of the resistance level of 1.1160 will make it possible to develop the movement of the single European currency within the boundaries of the 1/2 Median Line channel (1.1160 - 1.1170 - 1.1180) and the equilibrium zone (1.1185 - 1.1205 - 1.1222) of the Minuette operating scale.

In the case of confirmation of the breakdown of the initial SSL line (1.1121) of the Minuette operating scale fork, the downward movement of EUR / USD can be continued towards the targets - minimum 1.1107 - warning line UWL38.2 (1.1052) of the Minuette operational scale fork.

The details of the movement options for this pair are presented in the graph.

https://forex-images.ifxdb.com/userfiles/20190725/analytics5d39de160838c.jpg

___________________
Great Britain pound vs US dollar

Meanwhile, the development of the movement of Her Majesty's Currency GBP / USD from July 26, 2019 will be determined by the development and direction of the breakdown of the boundaries of the 1/2 Median Line channel (1.2530 - 1.2500 - 1.2460) of the Minuette operational scale. The movement options within this channel are shown in the animated graphic.

If the resistance level of 1.2530 is broken down at the upper boundary of the 1/2 Median Line channel Minuette, the upward movement of GBP / USD can be continued to the targets - the lower boundary of the ISL38.2 (1.2615) and the equilibrium zone of the Minuette operating scale fork -the final Schiff Line Minuette (1.2620) is the lower boundary of the ISL38.2 (1.2645) equilibrium zone of the Minuette operational scale fork.

The breakdown of the lower boundary of the 1/2 Median Line channel of Minuette operational scale (support level of 1.2460) will determine the further development of the movement of the single European currency in the 1/2 Median Line channel (1.2460 - 1.2405 - 1.2350) of the Minuette operational scale fork.

The details of the GBP / USD movement are presented in the animated graphics.

https://forex-images.ifxdb.com/userfiles/20190725/analytics5d39ddf3ad720.jpg

____________________
The review was compiled without taking into account of the news background. In addition, the opening of trading sessions of the main financial centers does not serve as a guide to action (placing orders "sell" or "buy").

The formula for calculating the dollar index is:
USDX = 50.14348112 * USDEUR0.576 * USDJPY0.136 * USDGBP0.119 * USDCAD0.091 * USDSEK0.042 * USDCHF0.036.

where power ratios correspond to the weights of currencies in the basket:
Euro - 57.6% ;
Yen - 13.6%;
Pound sterling - 11.9% ;
Canadian dollar - 9.1%;
Swedish krona - 4.2%;
Swiss franc - 3.6%.

The first coefficient in the formula gives the index value to 100 on the starting date - March 1973, when the main currencies began to be freely quoted relative to each other.

Analysis are provided byInstaForex.

Best regards, PR Manager / Learn more about InstaForex Company at http://instaforex.com

Re: InstaForex Analysis

Important Intraday Levels for USD/JPY, July 29, 2019

https://forex-images.ifxdb.com/userfiles/20190729/analytics5d3e5a1ccec36.jpg

In Asia, Japan will release the Retail Sales y/y and the US will not publish any economic data today. So there is a probability the USD/JPY pair will move with low to medium volatility during this day.

TODAY'S TECHNICAL LEVELS:

Resistance.3 : 109.03.

Resistance. 2: 108.82.

Resistance. 1: 108.61.

Support. 1: 107.34.

Support. 2: 107.13.

Support. 3: 107.92.

(Disclaimer) *The market analysis posted here is meant to increase your awareness, but not to give instructions to make a trade.

Best Regards,PR Manager
InstaForex Companies Group

Re: InstaForex Analysis

Control zones for Bitcoin on 07/30/19

Yesterday, Bitcoin has dropped to $ 9000. This allowed us to re-test the monthly minimum. The response to the test was an increase in demand. This makes it possible to indicate that there are limit buyers within the monthly minimum. While levels from 9000 and above are saturated with buyers, a further decrease remains unlikely. Thus, the likelihood of continued movement within the medium-term flat increases.

https://forex-images.ifxdb.com/userfiles/20190730/analytics5d3fa22bb58c4.png

It is also important to note that Bitcoin went beyond the monthly control zone. This makes it possible to search for purchases in the direction of return, since the probability of return is 90%.

When building a trading plan, it is important to note that throughout the past week, the pair has been trading below the level of balance. Today, the situation is similar, so the movement towards yesterday's high will be decisive. If the price is kept below the balance, the probability of updating the monthly minimum will be more than 50%. To break the downward impulse, it will be necessary to consolidate above the balance mark

https://forex-images.ifxdb.com/userfiles/20190730/analytics5d3fa2434f680.png

Daily CZ - daily control zone. The area formed by important data from the futures market, which change several times a year.

Weekly CZ - weekly control zone. The zone formed by important marks of the futures market, which change several times a year.

Monthly CZ - monthly control zone. The zone, which is a reflection of the average volatility over the past year.

Analysis are provided byInstaForex.

Best regards, PR Manager / Learn more about InstaForex Company at http://instaforex.com

Re: InstaForex Analysis

Forecast for EUR/USD for July 31, 2019

On Tuesday, the euro came under pressure from unfavorable economic statistics, but investors missed the data ahead of the Fed's FOMC decision on Wednesday. French GDP for the 2nd quarter was 0.2% against a forecast of 0.3%, personal incomes and consumer spending in the US showed an expected increase of 0.4% and 0.3%, respectively. But trading volumes were not large, as the euro rose by 11 points.

The price reached a Fibonacci level of 110.0% on the daily chart, where it stayed until today's Asian session. The signal line of the Marlin oscillator was discharged - it rose upwards, which may be a sign of a continued decline in case of favorable fundamental component.

https://forex-images.ifxdb.com/userfiles/20190731/analytics5d411f98c7ee8.png

On the four-hour chart, the price reached the balance and MACD line, and also lingered in them. The primary signal for a further decline is the departure of the price below 1.1132. Next, we expect to overcome the support zone of 1.102/12 and further decline to 1.1074 and 1.0985.

https://forex-images.ifxdb.com/userfiles/20190731/analytics5d411fae3b676.png

But today, the Fed will announce the decision on the rate with a market likelihood that it would decrease by a quarter point at 100%. The risk of a short-term growth in the euro to the line of the price channel at 1.1202 (daily), of course. In our opinion, today's rate cut is quickly being absorbed by the market, since, in parallel with the Fed, the European Central Bank also pursues a policy of easing, and amid deteriorating European economic indicators. Western media claim that the Fed rate cut has already been taken into account in the price. We do not agree with this statement, but the message is clear - financial institutions do not want a weakening dollar, which fits into our concept of a strong dollar in the long run.

Therefore, we see two scenarios for the euro's near development: an immediate downward movement after a decision on the rate, and especially after Jerome Powell's press conference, where a pause in the mitigation cycle can be mentioned, and a downward movement after a short-term growth to 1.1202.

*The market analysis posted here is meant to increase your awareness, but not to give instructions to make a trade.

Best Regards,PR Manager
InstaForex Companies Group

Re: InstaForex Analysis

GBP/USD. "Super Thursday" will not help the pound

The pound-dollar pair demonstrated correctional growth today after updating its annual low and reaching two-year price troughs. Bears of GBP/USD could not enter the 20th figure, after which the bulls seized the initiative and nearly 100 points passed in a day. This dynamic is mainly due to technical factors - an overabundance of short positions in the British currency makes itself felt.

https://forex-images.ifxdb.com/userfiles/20190801/analytics5d42258091f64.jpg

In addition, the market "remembered" that the prime minister of Britain, with all his desire, cannot single out the country from the EU - this requires the approval of the Parliament. Ironically, the House of Commons, after several years of confrontation with the government of Theresa May and Brussels, can become an unexpected ally of the Europeans, stopping the implementation mechanism of the chaotic Brexit. Deputies have already taken preventive measures by adopting an amendment to the law on self-government in Northern Ireland. This provision does not allow the prime minister to stop the Parliament's work, which can quickly block withdrawal from the EU without an agreement. In turn, Johnson can decide on early Parliamentary elections, hoping to get the majority under control. There are several other scenarios, one of which is the announcement of a vote of no confidence in the newly minted premier. In any case, Johnson faces a difficult struggle within the walls of the British Parliament, whose members, as we recall, did not support the option of a "hard" Brexit during a signal vote at the beginning of this year.

This disposition made it possible for the pound to move away from the level of two-year lows. On the other hand, the British currency continues to be under strong background pressure, as Brexit prospects remain dim - even if Parliament does not allow Johnson to withdraw the country from the Alliance without an agreement on October 31. London and Brussels are still at different poles on many issues - which includes the fate of the Irish border. Therefore, this political rebus will remain unresolved in any case - until one of the parties makes substantial concessions.

Given the current situation, any growth in the British currency should be treated with caution. Here it is worth recalling that the so-called "super-Thursday" is expected tomorrow, when several important events take place within a day: the Bank of England meeting, the release of the quarterly report on inflation and the publication of a summary of monetary policy. The news marathon is completed by Mark Carney, who will hold an extended press conference. Such a "news jackpot" is relatively rare, so traders are unlikely to ignore it, despite the undeniable priority of the Brexit issue.

https://forex-images.ifxdb.com/userfiles/20190801/analytics5d422593c6fb4.jpg

However, these issues can not be separated from each other. Last year, the head of the Bank of England warned of the extremely negative consequences of a hard Brexit. In particular, he said that if Britain withdraws from the EU without a deal, then the country will have to rely on the conditions of the WTO. The head of the English regulator even admitted the likelihood that the monetary policy in this case would be revised in the direction of easing. Since then, Carney's rhetoric has not undergone any fundamental changes. He does not tire of repeating that the prospects for monetary policy depend primarily on the prospects for the negotiation process. Moreover, the transfer of Brexit in this context will also not be an acceptable solution, since in this case the period of uncertainty will only be extended. In other words, the English regulator unequivocally associated a further increase in the interest rate with a soft Brexit, and Mark Carney consistently advocated this causal relationship.

Given the recent events, the head of the Bank of England is unlikely to toughen his rhetoric - on the contrary, he can describe in more detail the prospects for the chaotic scenario. That is why tomorrow's inflation report and monetary policy summary will play a secondary role, and the focus of GBP/USD traders will be on Carney's rhetoric. Also, do not forget that the English regulator closely monitors the dynamics of the global trade war. Let me remind you that the 12th round of talks between Beijing and Washington was completed ahead of schedule today. The parties noted "some progress" and agreed to meet again in September. The market clearly expected more from this meeting, so anti-risk sentiments returned to the market. This factor can also affect the mood of the members of the English regulator, reinforcing their "dovish" attitude.

Thus, the "super-Thursday" is unlikely to help the British currency in restoring its position. Against the background of the Brexit lull, the pound will follow the US currency in anticipation of the next news drivers. Therefore, the trading strategy for the GBP/USD pair remains unchanged - short positions for any more or less large-scale correctional growth.

Analysis are provided byInstaForex.

Best regards, PR Manager / Learn more about InstaForex Company at http://instaforex.com

Re: InstaForex Analysis

GBP/USD. Unexpected dollar weakness and hopeless pound prospects

The US dollar unexpectedly stopped growing in almost all pairs in the afternoon. The EUR/USD pair pulled back from the bottom of the 10th figure to the level of 1.1085, the USD/JPY pair dropped to the bottom of the 108th figure, and the aussie again went to conquer the 69th price level.

https://forex-images.ifxdb.com/userfiles/20190802/analytics5d4378282a17b.jpg

In varying degrees, the greenback surrendered its positions in the remaining pairs. The pound-dollar pair was no exception: after the price again updated its annual low of 1.2078, a rather sharp reversal and growth followed in the middle of the 21st figure. By and large, a corrective pullback was expected, as the pair was gradually approaching its record high, that is, to a record low of 1.1986, which was reached in January 2017. As the pair's downward impulse exhaled, the probability of a corrective growth increased - from the bottom of the 20th figure. But the dollar was ahead of the event, weakening throughout the market. As a result, the GBP/USD pair retreated by almost 100 points only due to the devaluation of the greenback.

This price dynamics was due to several reasons. First, the ISM Manufacturing Index was published today, which, despite positive forecasts, dropped to 51.2 points, updating its multi-month lows. The structure of the indicator suggests that the employment component fell to 51.7 points (for comparison, it was at 54.7 in the previous month), and the price component of the index (inflation component) fell to 45.1 points, while the growth forecast to 50 -ty points. In general, the indicator has been falling for the fourth month in a row, disrupting the optimistic picture of the US statistical reporting.

After a strong Nonfarms and relatively good data on US GDP growth, today's release has become a kind of "cold shower" for dollar bulls. After all, the words of Jerome Powell are still fresh in their memory, as they allowed a further reduction in the interest rate, if key macroeconomic indicators show a steady decline. Yesterday, this rhetoric supported the dollar, as the key economic indicators that preceded the July Fed meeting came out (mostly) in the green zone or at the level of forecasts. But the ISM index "sobered up" many market participants, especially on the eve of tomorrow's Nonfarms, which traders could also be disappointed in, given the relatively weak report from ADP (according to their data, the increase in the number of employees amounted to 156,000 in July).

Amid doubts that have resurfaced regarding the Fed's future actions, the yield on 10-year Treasuries fell sharply. In just a few hours, this figure fell from 2,053% to 1,952%. The fact of such a rapid decline put additional pressure on the dollar, allowing bulls of the GBP/USD pair to return to the 21st figure.

https://forex-images.ifxdb.com/userfiles/20190802/analytics5d43783c440ea.jpg

In general, the current situation shows how dollar bulls are uncertain in their abilities. Only one macroeconomic report was able to shake the position of the greenback, which has been building up its muscles throughout the day. If subsequent releases will also be released in the "red zone" (especially inflation indicators), the dollar will return the points gained in the medium term, as concerns about the next steps from the Fed will return to the market.

This situation will allow GBP/USD traders to open short positions at the peak of corrective pullbacks. After all, the fundamental picture remains negative for the pound, regardless of the US events. Johnson is still preparing Britain for the hard Brexit, and his aggressive rhetoric addressed to Brussels reduces the likelihood of any compromise. The market hopes for the help of the British Parliament, which can block the implementation of the chaotic scenario. But these hopes are justified only with the current composition of the House of Commons. In the meantime, the British press is increasingly suggesting that Johnson will decide to hold extraordinary Parliamentary elections. Here it is worth noting that with the arrival of the new prime minister, the Conservative Party rating rose by six points at once - that is, to 31%. The Labor Party ranking is now 21%. The gap in the ratings of Conservatives and Laborers was a record in the last five months. Such sociology also has background pressure on the pound, although the question of early elections is not yet on the agenda.

Nevertheless, uncertainty over Brexit prospects, as well as Johnson's aggressive attacks on the EU leadership suggest that the downward dynamics of GBP/USD is still justified. From a technical point of view, the pair is within the framework of the downward movement, as evidenced by the trend indicators on all "higher" timeframes (from H4 and higher). The nearest support level is at 1,2005 (the bottom line of the Bollinger Bands indicator on the monthly chart). The purpose of a possible corrective pullback is the mark of 1.2290 (Tenkan-sen line on the daily chart): if the bulls overcome it, then they will consolidate again in the 23rd figure. However, given the fundamental picture, it will be difficult for the bulls to find a reason for such a significant upward spurt.

Analysis are provided byInstaForex.

Best regards, PR Manager / Learn more about InstaForex Company at http://instaforex.com

Re: InstaForex Analysis

EUR/USD. Useless Nonfarms: Trump made traders turn away from macroeconomic reports

Data on the growth of the US labor market could not support the dollar, which rather unexpectedly came under pressure from an external fundamental background. Another escalation of the trade war between the United States and China has mixed all the cards with dollar bulls. After all, at the end of the July Fed meeting, traders had the confidence that the regulator would limit itself to one round of rate cuts, as a precautionary measure. However, after the release of an extremely weak ISM index in the manufacturing sector, as well as after a resonant statement by Donald Trump, concerns about the Fed's next steps returned to the market.

Let me remind you that at the end of last week, the US president promised to introduce an additional 10 percent duty on imports of Chinese goods worth $300 billion starting on September 1, given that Beijing does not agree to conclude a deal with the United States before this deadline. If this scenario is implemented, additional tariffs will cover almost all imports from China. Trump was also outraged by the fact that China refused to comply with the agreements that were reached at the G-20 summit (we are talking about the resumption of purchases of agricultural goods). The fact that Washington, in fact, did not fulfill its part of the agreements (regarding the lifting of sanctions against Huawei), the head of the White House modestly kept silent.

https://forex-images.ifxdb.com/userfiles/20190805/analytics5d476385e7463.jpg

Nevertheless, the fact remains: recent events suggest that the positive results of the G20 summit have been completely offset. The first round of negotiations after the summit was completed ahead of time and without any clear result, whereas a few days later, Trump announced the above ultimatum. Here, even without official comments, it becomes clear that the parties are still defending their positions, despite the formal desire to find a mutually beneficial compromise. Before the start of the negotiations, Trump suggested that the Chinese would deliberately pull time before the next presidential election in the United States (which will take place in November 2020), hoping for a change of power. The most likely candidates from the Democratic Party are really ahead of the current president - at least for today. Therefore, there is certainly some sense in Beijing's actions: why make a knowingly unprofitable deal with Trump, if in a year it will be possible to agree on other conditions with Biden? This is the reason for such haste in Donald's decisions - given the rating gap from the Democrats, he needs a victory in a trade war, the negative consequences of which are felt not only by China and the world economy, but also by the US economy.

Such prospects had a fairly strong pressure on the US currency. Traders again increased the likelihood of another round of rate cuts at one of the autumn meetings (most likely in September), while some analysts do not rule out more radical scenarios - either a one-time rate cut of 50 basis points or a third decline in December. of the year. Such an unexpected reversal of the plot allowed the EUR/USD pair to move away from the level of a multi-year low (1.1026) and demonstrate corrective growth to the level of 1.1117. In general, the dollar index in a few hours of Friday fell from 98.258 to 97.873. The yield on 10-year-old Treasuries has also declined significantly - the indicator has collapsed to almost a three-year low (1.843%).

The market clearly focused on geopolitical events, as it completely ignored one of the key macroeconomic indicators, Nonfarms. Although this release was supposed to support a further rally in the US currency: the US labor market continues to recover, demonstrating the growth of the main components. Thus, the number of people employed in the non-agricultural sector increased by 164,000 (which fully coincided with the forecast), while the unemployment rate remained at a record low of 3.7%. The number of people employed in the manufacturing sector of the economy increased by 16 thousand (a positive trend for the 2nd month in a row). The growth rate of the average hourly wage also pleased investors: in annual terms, the indicator rose to 3.2% (for the first time since April), and in monthly terms, the component rose to 0.3% (at this level, the indicator goes for the third month in a row). Thus, the July data completely offset concerns about the dynamics of growth in the US labor market, although this issue was on the agenda this spring, both among investors and members of the US regulator.

https://forex-images.ifxdb.com/userfiles/20190805/analytics5d47639b0cbfa.jpg

It is likely that after the release of Friday's data, EUR/USD bears would try to enter the ninth figure area or at least try to test a strong support level of 1.0980 (lower Kumo cloud boundary on the monthly chart) - but an unexpected move by the US president ruined the plans of the dollar bulls. When trading was about to close, the pair approached the first resistance level of 1.1120 (Tenkan-sen line on the daily chart), and if the growth of anti-risk sentiment continues, then the bulls will be able to develop further correction - up to the levels of 1.1190 and 1.1220 (middle line BB and Kijun-sen line on D1).

Here it is worth noting that on Friday, the Chinese Ministry of Commerce has already accused Donald Trump of violating the June agreement with Xi Jinping, promising to use "countermeasures". It is likely that this week we will find out what measures we are talking about. Strengthening the US-China conflict will put pressure on the dollar, since the escalation of trade war is seen by the market through the prism of prospects for further easing of the Fed's monetary policy.

Analysis are provided byInstaForex.

Best regards, PR Manager / Learn more about InstaForex Company at http://instaforex.com

Re: InstaForex Analysis

Control areas AUDUSD 08/06/19

The pair is trading within the medium-term bearish impulse today, therefore, the growth is corrective until the pair absorbs yesterday's movement. If the close of today's trading is below Monday's high, the downward momentum will continue. The probability of updating the weekly low is 70%.

https://forex-images.ifxdb.com/userfiles/20190806/analytics5d48e7ec3f52e.png

Working within the medium-term trend frame always provides an opportunity to search for favorable prices in a prioritized direction, since before the reversal of the momentum, in most cases, there is a false breakout pattern.

Changing the direction of trade requires a breakdown of the main resistance of the WCZ 1/2 0.6823-0.6816 and the closure of today's US session above it. In this case, purchases will come to the fore, the goal of which will be the weekly zontrol zone of 0.6897-0.6884. It is important to understand that work in the upward direction remains corrective.

https://forex-images.ifxdb.com/userfiles/20190806/analytics5d48e80920c70.png

Daily CZ - daily control zone. The area formed by important data from the futures market, which change several times a year.

Weekly CZ - weekly control zone. The zone formed by important marks of the futures market, which change several times a year.

Monthly CZ - monthly control zone. The zone, which is a reflection of the average volatility over the past year.

Analysis are provided byInstaForex.

Best regards, PR Manager / Learn more about InstaForex Company at http://instaforex.com

Re: InstaForex Analysis

Forecast for USD / JPY pair on August 7, 2019

USD / JPY pair
The situation on the yen remains difficult. Thanks to yesterday's growth of the American stock market at S&P 500 by 1.30%, the pair was able to close the day with an increase of 52 points. On the daily chart, the price line was the balance line. Today, the Asian stock market is still falling in the Asian session, except for the Australian S&P/ASX200 index, adding 0.55%. Meanwhile, the Japanese Nikkei225 is now the leader of the fall with 0.83%. The yen "hid in a corner" almost literally as it is held in a triangle formed by the lines of falling and rising price channels. The Support is the line of 105.75 and the resistance is at 106.54. Fixation under the green bottom line will allow the price to decline to 105.00, which consolidates above the upper one that opens up the prospect of growth to 108.62.

https://forex-images.ifxdb.com/userfiles/20190807/analytics5d4a4b154a818.png

On the four-hour chart, the signal line of the Marlin oscillator should go into the zone of positive numbers for the first sign of growth to appear. Visually, this will happen just with the release of prices above 106.54. The first growth target will be the MACD line at 107.42.

https://forex-images.ifxdb.com/userfiles/20190807/analytics5d4a4b30ac604.png

Analysis are provided byInstaForex.

Best regards, PR Manager / Learn more about InstaForex Company at http://instaforex.com

Re: InstaForex Analysis

EUR/USD: Trump's anger, Treasuries fall and RMB rise

After a temporary respite, the dollar again came under pressure from problems of a very diverse nature. Trump criticized the Federal Reserve again (and in a rather harsh form), the yuan renewed its 11-year high again, and the yield on 10-year Treasuries collapsed to three-year lows. The dollar index is actively losing its position amid such a negative fundamental picture, reflecting the greenback being sold throughout the market.

The euro-dollar pair also follows general trends. After dropping to the 11th figure during the European session, Bulls then more than made up for it, reaching 1.1240. By and large, today EUR/USD traders repeated the price path of Tuesday, however, with one exception: the US currency looks much more vulnerable today, and not only in conjunction with the euro. For example, paired with the yen, the greenback sank to the 105th figure (five-month low), and paired with the franc slumped to the 96th figure (11-month low). In other words, the market is actively getting rid of the dollar and investing in defensive assets - by the way, gold has risen to a 6-year high today, that is, to around 1509.

https://forex-images.ifxdb.com/userfiles/20190808/analytics5d4b629ddcc4f.jpg

This dynamics is due to several reasons. First of all, the dollar was a victim of the general nervousness of traders. The unexpected move of the Reserve Bank of New Zealand (which suddenly dropped today by 50 bp immediately) unsettled many investors - it became completely clear that the central banks of the leading countries of the world will soften their monetary policy parameters in the foreseeable future, and the Fed is here will not be an exception.

Indeed, today, in addition to the RBNZ, the Central Bank of India has reduced the interest rate (by 35 basis points at once, to the lowest level since 2010) and the central bank of Thailand - the regulator has reduced the rate from 1.75% to 1.50%. The Thai central bank also surprised investors, as most analysts expected the rate to remain unchanged. Such a peculiar "domino effect" provided strong support for defensive instruments and equally strong downward pressure on the greenback. Wall Street reacted appropriately to the situation: the main indexes plummeted significantly when trading began. The Dow Jones Industrial Average fell by more than 2%, the S&P 500 by almost 2%, while the Nasdaq Composite by 1.6%.

The fundamental background for the dollar is too sharply painted in gloomy tones. Let me remind you that after the July meeting of the Fed (which took place just a week ago), the US currency went up sharply in almost all dollar pairs. Investors were confident that the Fed would limit itself to a "warning shot" in the form of one 25-point rate cut. By and large, Fed members, like Jerome Powell, indirectly confirmed this market assumption, although they did not exclude an alternative scenario. But a week ago, the likelihood of implementing this "alternative" scenario was minimal. However, further events unfolded with such swiftness that in just a few days dollar bulls lost ground.

Trump's resonant statement about 300 billion duties, China's response (refusal to purchase American agricultural products), devaluation of the renminbi, a 50-point reduction in the RBNZ rate and easing of the monetary policy of the central bank of India and Thailand are all links in one chain. With a high degree of probability, the Fed will also not be left out in the end, resorting to another round of rate cuts this year. The only question is - 25 or 50 basis points. It is noteworthy that yesterday James Bullard, one of the most prominent representatives of the "dovish" wing of the Fed, said that the regulator should not reflexively react to the actions of the US and China, which operate on the basis of the "tooth by tooth" principle. He noted that interest rates are now at an optimal level, and before deciding on further steps, the Federal Reserve needs to analyze the reaction of the US economy to a trade war.

https://forex-images.ifxdb.com/userfiles/20190808/analytics5d4b62b2aad05.jpg

But Donald Trump is still vomiting and mosquing, accusing the Federal Reserve of almost tampering. He said that Fed members still cannot admit their mistake, which was that the regulator began to "tighten monetary policy too soon and too quickly." In his opinion, the Federal Reserve should now actively reduce the interest rate, thereby increasing US competitiveness. "The problem is not even in China, but in our central bank," the president concluded.

On the one hand, Jerome Powell has repeatedly stated that such attacks from Trump does not affect the Fed's position. On the other hand, the market again started talking about the fact that the regulator could reduce the interest rate by 50 points in the fall (or resort to a double reduction of 25 bp by the end of the year) - even without taking into account the political pressure of the White House. This fact has a significant impact on the greenback, helping EUR/USD bulls to storm the nearest resistance level of 1.1260 (the lower border of the Kumo cloud on the daily chart).

But it is worth noting here that EUR/USD bulls still can't confirm their dominance - for this they need to gain a foothold over the above resistance level, and for fidelity - to overcome the upper border of the cloud, which corresponds to the level of 1.1302. Until then, the price will fluctuate in the range of 1,1140-1,1260 in anticipation of a powerful information driver that will help traders take the pair outside one of the corridor boundaries.

Analysis are provided byInstaForex.

Best regards, PR Manager / Learn more about InstaForex Company at http://instaforex.com

Posts: 351 to 375 of 1,547

Pages Previous 1 13 14 15 16 17 62 Next

You must login or register to post a reply

Forex Software → Market Analysis → InstaForex Analysis

Similar topics in this forum